

Abstract
A role for the minichromosome maintenance (MCM) proteins in cancer initiation and progression is slowly emerging. Functioning as a complex to ensure a single chromosomal replication per cell cycle, the six family members have been implicated in several neoplastic disease states, including breast cancer. Our study aim to investigate the prognostic significance of these proteins in breast cancer. We studied the expression of MCMs in various datasets and the associations of the expression with clinicopathological parameters. When considered alone, high level MCM4 overexpression was only weakly associated with shorter survival in the combined breast cancer patient cohort (n = 1441, Hazard Ratio = 1.31; 95% Confidence Interval = 1.11-1.55; p = 0.001). On the other hand, when we studied all six components of the MCM complex, we found that overexpression of all MCMs was strongly associated with shorter survival in the same cohort (n = 1441, Hazard Ratio = 1.75; 95% Confidence Interval = 1.31-2.34; p < 0.001), suggesting these MCM proteins may cooperate to promote breast cancer progression. Indeed, their expressions were significantly correlated with each other in these cohorts. In addition, we found that increasing number of overexpressed MCMs was associated with negative ER status as well as treatment response. Together, our findings are reproducible in seven independent breast cancer cohorts, with 1441 patients, and suggest that MCM profiling could potentially be used to predict response to treatment and prognosis in breast cancer patients.
Keywords: Minichromosome maintenance complex, breast cancer, survival, prognosis
Introduction
The minichromosome maintenance (MCM) protein family ensures that chromosomal replication occurs only once per cell cycle [1,2]. MCM proteins, including MCM2-7, which are evolutionally conserved in all eukaryotes, form a hexameric pre-replication complex that is essential for DNA replication initiation and elongation [3,4]. Other than DNA replication, MCM proteins have also been shown to play a central role in genome stability [5].
MCM proteins have been implicated in cancer initiation and progression, with their expression found to be a determinant of aggressiveness of a wide range of epithelial malignancies by microarray analysis, suggesting that their up-regulation is either at a genomic or transcriptional level [6]. As MCM proteins play an important role in DNA replication, their role in cancer cell proliferation is not surprising [7]. Indeed, the expression of MCM proteins has been shown to correlate with cell proliferation and carcinogenesis [8], and therefore, has been suggested to be of diagnostic and prognostic value for human malignancy in the clinical setting [9]. For example, only colonocytes from patients with symptomatic colorectal cancer were positive for MCM2 expression, while those from normal healthy patients lacked similar expression [10]; MCM2 mRNA overexpression has been suggested to be a potential biomarker for early diagnosis of colorectal cancer [11]. Similarly, MCM2 was demonstrated as a biomarker for anal neoplasia [12], esophageal [13,14] and bladder cancers [15]. MCM3 overexpression was demonstrated in various human cancers [16]. Elevated expression of MCM5 in urine sediments has also been shown to be a predictive factor for bladder [17] and prostate [18] cancers. MCM7 was shown to be a biomarker for cervical cancer [19]. Increased MCM2 expression is associated with shorter survival in prostate cancer [20], lung cancer [21], ovarian cancer [22] and renal cell carcinoma [23,24] patients, and also with a higher risk of recurrence in bladder cancer [25]. Increased MCM3 protein also associates with poorer survival in brain cancer patients with astrocytoma [26]. MCM5 and MCM6 have been shown to be an independent prognostic marker in patients with ovarian cancer [22] and melanoma [27] respectively. Lastly, MCM7 expression was demonstrated to be a prognostic factor in colorectal [28], lung [29,30] and ovarian cancers [31].
Despite our understanding of neoplastic regulation by the MCM proteins, little is understood regarding the prognostic value of this family of proteins. MCM4 was shown to be overexpressed in esophageal cancer with higher pathological stage [32] and its increased expression has been associated with shorter survival in patients with melanoma [27]. High level of MCM4 was demonstrated to be associated with cancer initiation but not patient survival in lung cancer [33]. Recently, a hypomorphic allele of the MCM4 gene in mouse was found to increase the risk of breast cancer likely through chromosome instability induced by impairment in regulation of DNA replication [34]. In breast cancer, MCM2 has been shown to be a strong prognostic marker, where a high level of MCM2 expression is shown to associate with survival, regional recurrence and distant metastases [35]. However, other than MCM2, little is known regarding the prognostic value of other MCM components in breast cancer. Recently, a viable allele of MCM4 was discovered, suggesting MCM4 plays a role in the development of breast adenocarcinoma [34]. Despite these results, to the best of our knowledge, the expression of MCM4 in human specimens and its association with human breast cancer progression has not been described. In this study, we initially investigated the prognostic significance of MCM4 in our breast cancer patient cohort and other cohorts, which are available in online databases. We have discovered a significant role for MCM4 overexpression in human breast cancer, although the association between MCM4 expression and disease prognosis was rather weak. For this reason, we extended our study to involve the major components of the MCM replication initiation complex, MCM2-7 for better prognostication for breast cancer patients.
Materials and methods
Patients and samples
Breast cancer cases with available frozen tissues for both breast cancer and non-tumor breast epithelium were retrieved from Department of Pathology, Queen Mary Hospital, Hong Kong. The tissue samples were procured from snap-frozen tissues collected immediately after surgical resection. Breast cancer with > 75% tumor nuclei and the corresponding adjacent normal breast epithelium were used for RNA extraction and for comparison. In total, 35 pairs of breast cancer and adjacent normal breast epithelium had enough tissue for RNA extraction and RT-PCR analysis for MCM4, while 45 pairs had enough tissue for immunohistochemical staining for MCM4. In addition, another 46 breast cancer cases with no available adjacent normal tissue was used for analysis of the correlation between MCM4 expression and ER status by immunohistochemical staining for MCM4.
Total RNA extraction and quantitative RT-PCR
Total RNA was extracted using Trizol reagent (Invitrogen, Carlsbad, CA) according to the manufacturer’s instructions. Thirty 16 micron thick sections of each frozen tissue were used for total RNA extraction. Contaminant DNA in the RNA samples was digested by DNase I (Invitrogen) and the purified RNA was reverse transcribed by SuperScript III reverse transcriptase according to manufacturer’s instruction (Invitrogen). Real-time PCR was performed using SYBR Green Master Mix (Applied Biosystems, Warrington, UK) according to the manufacturer’s instructions. A four-point calibration standard curve was set by serial dilution of linearized plasmid for RNA quantification. MCM4 was amplified by MCM4 cDNA specific primers (5’-CAGCAGCAGAAGATATAGTGGCA-3’ and 5’-CTCCCCAAGTCGTTGCATGT-3’), while TATA-binding protein was used as a loading control (Primer sequences; 5’-ACGAACCACGGCACTGAT-3’ and 5’GCTGGAAAACCCAACTTCTG-3’). The real-time PCR reaction was performed on ABI Prism 7700 (Applied Biosystems).
Immunohistochemical staining
Immunohistochemical staining was performed using the DakoCytomation EnVision Dual Link System-HRP (Dako, Glostrup, Demark) according to the manufacturer’s instructions. Briefly, the tissue sections were deparaffinized, hydrated and then placed in a microwave oven at 95°C in 1 mM EDTA solution (pH 8.0) for 15 min for antigen retrieval. The sections were probed with 1:200 primary mouse monoclonal anti-MCM4 antibodies (SC-28317; Santa Cruz Biotech, Santa Cruz, CA) at 25°C for one hour. Biotin-labeled anti-mouse immunoglobulin was used as secondary antibody and the signal was developed using chromogen DAB. The stained sections were assessed by a pathologist (U.S.K) with no prior knowledge of the clinicopathological data for the patients. Both cores of each specimen were individually scored from 0 to 4, which indicated no nuclear staining, 1-25% nuclei stained positive, 25-50% nuclei stained positive, 50-75% nuclei stained positive and 75%-100% nuclei stained positive, respectively.
Extraction of clinical and microarray gene expression data from breast cancer patient datasets
Seven breast cancer patient datasets, GSE1456 [36], GSE2034 [37], GSE3143 [38], GSE3494 [39], GSE7390 [40], GSE11121 [41] and GSE12276 [42], with survival status available, one breast cancer dataset, GSE5462 [43], with pre- and post-letrozole treatment data available, and three breast cancer patient datasets, GSE22093 [44], GSE22358 [45] and GSE42822 [46], with treatment response available, in the Gene Expression Omnibus (GEO) Database (http://www.ncbi.nlm.nih.gov/gds) were included in this study. The extraction and data analysis were performed as previously described [47].
Statistical analysis
The statistical analysis was performed using SPSS 19.0. Differences in expression levels of MCM4 mRNA and protein between tumor and normal breast tissue in our cohort were analyzed using paired-t test. The associations between expression levels of genes were analyzed by Spearman’s rank test. Expression levels were further divided into high and low levels using median expression level as the cut-off point for Kaplan-Meier survival analysis. Results were compared by log-rank test. Univariate Cox regression was used to correlate the gene expression levels and patient survival and multivariate Cox-regression analysis was used to identify independent predictors for patient survival using a forward stepwise approach with an entry limit of p < 0.05.
Results
MCM4 mRNA and protein expressions in human breast cancer specimens
MCM4 mRNA expression was tested by RT-PCR in 35 pairs of non-tumor and tumor human breast specimens. As shown in Figure 1A, human breast cancer specimens expressed a significantly higher level of MCM4 mRNA compared to non-tumor human breast epithelium specimens (Wilcoxon test; P < 0.001). The result was confirmed by IHC staining of MCM4 proteins in 45 pairs of tumor and non-tumor FFPE human breast specimens. Human breast cancer specimens had a significantly higher level of MCM4 protein expression compared to non-tumor specimens (Paired t-test, P < 0.001; Figure 1B). These results suggest that increased MCM4 mRNA and protein expressions are associated with human breast cancer development.
Figure 1.
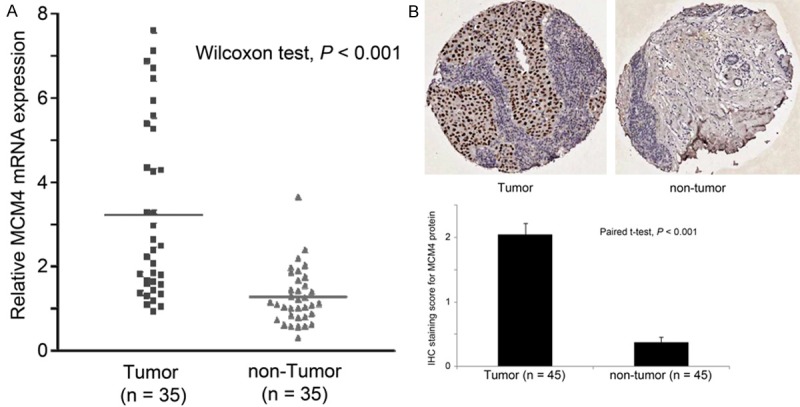
Differential expression of MCM4 in paired breast cancer and non-tumor breast epithelium specimens. A. mRNA expression of MCM4 determined by Real-time PCR in the 35 pairs of tumor and non-tumor specimens. B. Protein expression of MCM4 determined by immunohistochemical staining of the 45 pairs of tumor and non-tumor specimens.
The association between MCM4 expression and ER status in human breast cancer specimens
The association between MCM4 expression and ER status was assessed in the FFPE human breast cancer specimens for which ER status was known (n = 90; 45 pairs specimens); 46% of ER-negative breast cancer specimens (16/35) stained with a high level of MCM4 protein, while only 18% of ER-positive breast cancer specimens (10/55) had a similar MCM4 staining extent (Fisher’s Exact test, P = 0.006; Figure 2A). To confirm the finding in our breast cancer patient cohort, we utilized the Gene Expression Omnibus (GEO) database available online and identified three independent breast cancer datasets comprising information for MCM4 mRNA expression level, ER status of the tumor and survival status and time. In GSE2034 (n = 286), GSE3494 (n = 232) and GSE7390 (n = 198), MCM4 mRNA expression was significantly higher in ER-negative breast cancer compared to ER-positive breast cancer (ANOVA, P ≤ 0.001; Figure 2B-D). When the three datasets were combined and analyzed (n = 716), MCM4 mRNA was again significantly (Fisher’s Exact test, P < 0.001) expressed to a greater degree in patients with ER-negative (72%, 123/172) tumors than those with ER-positive disease (43%, 234/544; Figure 2E). These results indicate that breast cancers, which are independent of ER signaling, may have a higher expression of MCM4.
Figure 2.

The association between MCM4 expression and ER status of breast tumors. (A) Protein expression of MCM4 determined by immunohistochemical staining in 90 breast cancer specimens with different ER status. (B-D) Relative expression of MCM4 mRNA determined by microarray analysis in breast cancer specimens with different ER status in (B) GSE2034, (C) GSE3494 and (D) GSE7390 breast cancer datasets. (E) Percentage of cases with high or low MCM4 mRNA expression in breast cancer specimens with different ER status in the combined breast cancer dataset.
The association between MCM4 expression and histological grading of human breast cancer specimens
In our breast cancer patient cohort, intensity of MCM4 staining increased significantly with increasing histological grade of tumors; 11% of those with grade 1 tumors (1/9) had high staining for MCM4, while 19% of grade 2 (5/27) and 39% of grade 3 (21/54) tumors had a high level staining of MCM4 (Chi Square test, P < 0.001; Figure 3A). Again, we identified four independent breast cancer patient datasets that comprised information detailing MCM4 mRNA expression level, histological grade (histological grade was not available in the other 3 breast cancer datasets), and survival status and time. These datasets were further evaluated for the association between MCM4 expression and histological grade of breast cancer. In GSE1456 (n = 147), GSE3494 (n = 234), GSE7390 (n = 196) and GSE11121 (n = 200), grade 3 breast cancer had a significantly higher level of MCM4 mRNA expression than grade 1 or grade 2 breast cancer (ANOVA, P < 0.001; Figure 3B-E).
Figure 3.

The association between MCM4 expression and histological grading of breast cancers. (A) Protein expression of MCM4 determined by immunohistochemical staining in 91 breast cancer specimens with different histological grading. (B-E) Relative expression of MCM4 mRNA determined by microarray analysis in breast cancer specimens with different histological grading in (B) GSE1456, (C) GSE3494, (D) GSE7390 and (E) GSE11121 breast cancer datasets.
The association between MCM4 expression and survival of human breast cancer patients
We proceeded to investigate whether MCM4 expression could be a prognostic factor for human breast cancer. Seven human breast cancer datasets that comprised more than 150 patients and for whom MCM4 mRNA expression, and survival status and time was available, were identified from the GEO database. In GSE1456 (n = 159), GSE3494 (n = 236) and GSE12276 (n = 204), a significant association between high level mRNA expression of MCM4 and a shorter survival was observed (Wilcoxon-Gehan test, P = 0.001, = 0.023 and < 0.001, respectively; Figure 4A, 4D and 4G). In GSE2034 (n = 286), GSE3141 (n = 158) and GSE11121 (n = 200), an insignificant trend between a high level expression of MCM4 and a shorter survival was seen (Wilcoxon-Gehan test, P = 0.141, = 0.060 and = 0.247, respectively; Figure 4B, 4C and 4F). In GSE7390, the two groups of patients expressing high or low level of MCM4 mRNA had similar survival time as shown in a Kaplan Meier curve (Wilcoxon-Gehan test, P = 0.740; Figure 4E). When all the seven datasets were combined (n = 1441), a high level of MCM4 mRNA expression was strongly associated with a shorter survival time (Wilcoxon-Gehan test, P < 0.001; Figure 4H). These results suggest that MCM4 mRNA expression, by itself, may be a weak prognostic marker for human breast cancer progression.
Figure 4.

The association between MCM4 expression and survival of breast cancer patients. MCM4 mRNA expression was stratified into high or low expression using the median mRNA expression level as the cut-off point. Kaplan-Meier survival curve for MCM expression and the p-value for log-rank test showed alongside for (A) GSE1456, (B) GSE2034, (C) GSE3143, (D) GSE3494, (E) GSE7390, (F) GSE11121, (G) GSE12276 and (H) for all seven breast cancer datasets combined.
mRNA expression levels of MCMs are highly correlated with each other
MCM family members MCM2-7 work as a complex to regulate DNA replication, so it is perhaps unsurprising that overexpression of MCM4 alone may not be highly significantly associated with poor prognosis of breast cancer patients. Indeed, it is possible that overexpression of other components of the MCM complex may also be important for breast cancer progression. To investigate this, the correlations between the expression levels of MCMs were tested in the seven breast cancer datasets previously used for MCM4/disease progression correlation analysis. As shown in Table 1, the mRNA expression levels of all the MCMs were statistically significantly correlated with each other in all seven datasets (Spearman’s rank test, P < 0.05), except between MCM3 and MCM4, and between MCM4 and MCM5 in GSE3141. These results suggest that MCM2-7 may be transcriptionally regulated together in breast cancer. Indeed, DNA sequence analysis of the 2000 base pairs upstream of the transcriptional start sites for MCM2-7 using TFSEARCH, at a score cutoff of 90, identified three potential transcription factors that may bind to promoters of all six MCMs. As shown in Table 2, several transcription factors were identified that may bind and regulate the transcription of more than one MCM gene. Specifically, the transcription factors, AML-1a, GATA-1 and SRY were identified as having the potential to bind to upstream sequences of all MCM2-7 genes (Table 2, highlighted). Together, these results suggest that MCM2-7 genes may be closely co-regulated in breast cancer by common transcription factors.
Table 1.
Correlation among the expression levels of MCM family members in seven breast cancer patient cohorts; (A) GSE1456, (B) GSE2034, (C) GSE3141, (D) GSE3494, (E) GSE7390, (F) GSE11121, (G) GSE12276
| A. GSE1456 dataset (n = 159) MCMs correlation | |||||||||
|
| |||||||||
|---|---|---|---|---|---|---|---|---|---|
| MCM2 | MCM3 | MCM4 | MCM5 | MCM6 | MCM7 | ||||
|
| |||||||||
| Spearman’s rho | MCM2 | Correlation Coefficient | 1.000 | .632** | .734** | .579** | .403** | .696** | |
| P value | . | < 0.001 | < 0.001 | < 0.001 | < 0.001 | < 0.001 | |||
| MCM3 | Correlation Coefficient | .632** | 1.000 | .621** | .588** | .381** | .682** | ||
| P value | < 0.001 | . | < 0.001 | < 0.001 | < 0.001 | < 0.001 | |||
| MCM4 | Correlation Coefficient | .734** | .621** | 1.000 | .556** | .378** | .592** | ||
| P value | < 0.001 | < 0.001 | . | < 0.001 | < 0.001 | < 0.001 | |||
| MCM5 | Correlation Coefficient | .579** | .588** | .556** | 1.000 | .420** | .586** | ||
| P value | < 0.001 | < 0.001 | < 0.001 | . | < 0.001 | < 0.001 | |||
| MCM6 | Correlation Coefficient | .403** | .381** | .378** | .420** | 1.000 | .431** | ||
| P value | < 0.001 | < 0.001 | < 0.001 | < 0.001 | . | < 0.001 | |||
| MCM7 | Correlation Coefficient | .696** | .682** | .592** | .586** | .431** | 1.000 | ||
| P value. | < 0.001 | < 0.001 | < 0.001 | < 0.001 | < 0.001 | . | |||
|
| |||||||||
| B. GSE2034 dataset (n = 286) MCMs correlation | |||||||||
|
| |||||||||
| MCM2 | MCM3 | MCM4 | MCM5 | MCM6 | MCM7 | ||||
|
| |||||||||
| Spearman’s rho | MCM2 | Correlation Coefficient | 1.000 | .622** | .569** | .615** | .707** | .653** | |
| P value | . | < 0.001 | < 0.001 | < 0.001 | < 0.001 | < 0.001 | |||
| MCM3 | Correlation Coefficient | .622** | 1.000 | .431** | .474** | .591** | .506** | ||
| P value | < 0.001 | . | < 0.001 | < 0.001 | < 0.001 | < 0.001 | |||
| MCM4 | Correlation Coefficient | .569** | .431** | 1.000 | .432** | .459** | .536** | ||
| P value | < 0.001 | < 0.001 | . | < 0.001 | < 0.001 | < 0.001 | |||
| MCM5 | Correlation Coefficient | .615** | .474** | .432** | 1.000 | .592** | .548** | ||
| P value | < 0.001 | < 0.001 | < 0.001 | . | < 0.001 | < 0.001 | |||
| MCM6 | Correlation Coefficient | .707** | .591** | .459** | .592** | 1.000 | .459** | ||
| P value | < 0.001 | < 0.001 | < 0.001 | < 0.001 | . | < 0.001 | |||
| MCM7 | Correlation Coefficient | .653** | .506** | .536** | .548** | .459** | 1.000 | ||
| P value. | < 0.001 | < 0.001 | < 0.001 | < 0.001 | < 0.001 | . | |||
|
| |||||||||
| C. GSE3141 dataset (n = 158) MCMs correlation | |||||||||
|
| |||||||||
| MCM2 | MCM3 | MCM4 | MCM5 | MCM6 | MCM7 | ||||
|
| |||||||||
| Spearman’s rho | MCM2 | Correlation Coefficient | 1.000 | .475** | .352** | .341** | .487** | .362** | |
| P value | . | < 0.001 | < 0.001 | < 0.001 | < 0.001 | < 0.001 | |||
| MCM3 | Correlation Coefficient | .475** | 1.000 | .149 | .353** | .466** | .361** | ||
| P value | < 0.001 | . | 0.062 | < 0.001 | < 0.001 | < 0.001 | |||
| MCM4 | Correlation Coefficient | .352** | .149 | 1.000 | .098 | .466** | .255** | ||
| P value | < 0.001 | 0.062 | . | 0.222 | < 0.001 | 0.001 | |||
| MCM5 | Correlation Coefficient | .341** | .353** | .098 | 1.000 | .317** | .477** | ||
| P value | < 0.001 | < 0.001 | 0.222 | . | < 0.001 | < 0.001 | |||
| MCM6 | Correlation Coefficient | .487** | .466** | .466** | .317** | 1.000 | .344** | ||
| P value | < 0.001 | < 0.001 | < 0.001 | < 0.001 | . | < 0.001 | |||
| MCM7 | Correlation Coefficient | .362** | .361** | .255** | .477** | .344** | 1.000 | ||
| P value. | < 0.001 | < 0.001 | 0.001 | < 0.001 | < 0.001 | . | |||
|
| |||||||||
| D. GSE3494 dataset (n = 236) MCMs correlation | |||||||||
|
| |||||||||
| MCM2 | MCM3 | MCM4 | MCM5 | MCM6 | MCM7 | ||||
|
| |||||||||
| Spearman’s rho | MCM2 | Correlation Coefficient | 1.000 | .688** | .654** | .690** | .530** | .659** | |
| P value | . | < 0.001 | < 0.001 | < 0.001 | < 0.001 | < 0.001 | |||
| MCM3 | Correlation Coefficient | .688** | 1.000 | .515** | .614** | .493** | .634** | ||
| P value | < 0.001 | . | < 0.001 | < 0.001 | < 0.001 | < 0.001 | |||
| MCM4 | Correlation Coefficient | .654** | .515** | 1.000 | .526** | .431** | .533** | ||
| P value | < 0.001 | < 0.001 | . | < 0.001 | < 0.001 | < 0.001 | |||
| MCM5 | Correlation Coefficient | .690** | .614** | .526** | 1.000 | .444** | .549** | ||
| P value | < 0.001 | < 0.001 | < 0.001 | . | < 0.001 | < 0.001 | |||
| MCM6 | Correlation Coefficient | .530** | .493** | .431** | .444** | 1.000 | .407** | ||
| P value | < 0.001 | < 0.001 | < 0.001 | < 0.001 | . | < 0.001 | |||
| MCM7 | Correlation Coefficient | .659** | .634** | .533** | .549** | .407** | 1.000 | ||
| P value. | < 0.001 | < 0.001 | < 0.001 | < 0.001 | < 0.001 | . | |||
|
| |||||||||
| E. GSE7390 dataset (n = 198) MCMs correlation | |||||||||
|
| |||||||||
| MCM2 | MCM3 | MCM4 | MCM5 | MCM6 | MCM7 | ||||
|
| |||||||||
| Spearman’s rho | MCM2 | Correlation Coefficient | 1.000 | .616** | .578** | .636** | .664** | .669** | |
| P value | . | < 0.001 | < 0.001 | < 0.001 | < 0.001 | < 0.001 | |||
| MCM3 | Correlation Coefficient | .616** | 1.000 | .513** | .605** | .569** | .682** | ||
| P value | < 0.001 | . | < 0.001 | < 0.001 | < 0.001 | < 0.001 | |||
| MCM4 | Correlation Coefficient | .578** | .513** | 1.000 | .518** | .540** | .574** | ||
| P value | < 0.001 | < 0.001 | . | < 0.001 | < 0.001 | < 0.001 | |||
| MCM5 | Correlation Coefficient | .636** | .605** | .518** | 1.000 | .636** | .673** | ||
| P value | < 0.001 | < 0.001 | < 0.001 | . | < 0.001 | < 0.001 | |||
| MCM6 | Correlation Coefficient | .664** | .569** | .540** | .636** | 1.000 | .646** | ||
| P value | < 0.001 | < 0.001 | < 0.001 | < 0.001 | . | < 0.001 | |||
| MCM7 | Correlation Coefficient | .669** | .682** | .574** | .673** | .646** | 1.000 | ||
| P value. | < 0.001 | < 0.001 | < 0.001 | < 0.001 | < 0.001 | . | |||
|
| |||||||||
| F. GSE11121 dataset (n = 200) MCMs correlation | |||||||||
|
| |||||||||
| MCM2 | MCM3 | MCM4 | MCM5 | MCM6 | MCM7 | ||||
|
| |||||||||
| Spearman’s rho | MCM2 | Correlation Coefficient | 1.000 | .710** | .689** | .624** | .778** | .629** | |
| P value | . | < 0.001 | < 0.001 | < 0.001 | < 0.001 | < 0.001 | |||
| MCM3 | Correlation Coefficient | .710** | 1.000 | .571** | .432** | .666** | .594** | ||
| P value | < 0.001 | . | < 0.001 | < 0.001 | < 0.001 | < 0.001 | |||
| MCM4 | Correlation Coefficient | .689** | .571** | 1.000 | .508** | .645** | .539** | ||
| P value | < 0.001 | < 0.001 | . | < 0.001 | < 0.001 | < 0.001 | |||
| MCM5 | Correlation Coefficient | .624** | .432** | .508** | 1.000 | .650** | .553** | ||
| P value | < 0.001 | < 0.001 | < 0.001 | . | < 0.001 | < 0.001 | |||
| MCM6 | Correlation Coefficient | .778** | .666** | .645** | .650** | 1.000 | .558** | ||
| P value | < 0.001 | < 0.001 | < 0.001 | < 0.001 | . | < 0.001 | |||
| MCM7 | Correlation Coefficient | .629** | .594** | .539** | .553** | .558** | 1.000 | ||
| P value. | < 0.001 | < 0.001 | < 0.001 | < 0.001 | < 0.001 | . | |||
|
| |||||||||
| G. GSE12276 dataset (n = 204) MCMs correlation | |||||||||
|
| |||||||||
| MCM2 | MCM3 | MCM4 | MCM5 | MCM6 | MCM7 | ||||
|
| |||||||||
| Spearman’s rho | MCM2 | Correlation Coefficient | 1.000 | .673** | .554** | .618** | .698** | .665** | |
| P value | . | < 0.001 | < 0.001 | < 0.001 | < 0.001 | < 0.001 | |||
| MCM3 | Correlation Coefficient | .673** | 1.000 | .605** | .631** | .688** | .656** | ||
| P value | < 0.001 | . | < 0.001 | < 0.001 | < 0.001 | < 0.001 | |||
| MCM4 | Correlation Coefficient | .554** | .605** | 1.000 | .500** | .535** | .637** | ||
| P value | < 0.001 | < 0.001 | . | < 0.001 | < 0.001 | < 0.001 | |||
| MCM5 | Correlation Coefficient | .618** | .631** | .500** | 1.000 | .724** | .631** | ||
| P value | < 0.001 | < 0.001 | < 0.001 | . | < 0.001 | < 0.001 | |||
| MCM6 | Correlation Coefficient | .698** | .688** | .535** | .724** | 1.000 | .660** | ||
| P value | < 0.001 | < 0.001 | < 0.001 | < 0.001 | . | < 0.001 | |||
| MCM7 | Correlation Coefficient | .665** | .656** | .637** | .631** | .660** | 1.000 | ||
| P value. | < 0.001 | < 0.001 | < 0.001 | < 0.001 | < 0.001 | . | |||
Correlation is significant at the 0.01 level (2-tailed).
Table 2.
Summary of TFSEARCH results indicating transcription factors that may potentially bind and regulate the MCM family members. Highlighted are the transcription factors predicted to bind upstream of all six MCM members
| Potential transcription factors regulating expression of MCMs | |
|---|---|
| AML-1a | MCM2-7 |
| AP-1 | MCM2, 4, 5 and 7 |
| CDP CR | MCM3, 7 |
| CdxA | MCM2-7 |
| C/EBP | MCM3 and 4 |
| C/EBPb | MCM2, 3 and 5 |
| c-Ets | MCM2, 3 and 7 |
| CP2 | MCM4, 7 |
| c-Rel | MCM2, 4 and 6 |
| CREB | MCM2, 5 |
| Delta-E | MCM4-7 |
| E2F | MCM3, 5 and 6 |
| E47 | MCM6 |
| Elk-1 | MCM7 |
| Evi-1 | MCM2 |
| GATA-1 | MCM2-7 |
| GATA-2 | MCM2-6 |
| GATA-3 | MCM2,4 and 6 |
| GATA-x | MCM2 and 3 |
| HFH-1 | MCM5 and 7 |
| HFH-2 | MCM3, 5 and 7 |
| HFH-3b | MCM3, 5-7 |
| HSF1 | MCM3 and 5 |
| HSF2 | MCM2, 3 and 5 |
| Ik-2 | MCM2 and 5 |
| Lyf-1 | MCM2, 4-7 |
| MZF1 | MCM2-5 and 7 |
| NF-E2 | MCM7 |
| NF-kap | MCM2, 4 and 6 |
| Nkx-2 | MCM2-5 and 7 |
| NRF-2 | MCM7 |
| Oct-1 | MCM3 and 4 |
| P300 | MCM7 |
| Pbx-1 | MCM3, 6 and 7 |
| S8 | MCM5-7 |
| Sox-5 | MCM2-4 and 7 |
| SP1 | MCM3 and 4 |
| SREBP | MCM2 and 4-7 |
| SRY | MCM2-7 |
| STATx | MCM6 |
| v-Myb | MCM3 |
| YY1 | MCM6 |
The prognostic significance of other MCMs in human breast cancer
As the expression of MCM components in the MCM replication complex was shown to be positively correlated, and as each component may contribute to the function of the complex in regulating DNA replication, the prognostic significance of the other components, MCM2, MCM3, MCM5, MCM6 and MCM7, was assessed in the combined breast cancer dataset (n = 1441). As was the case with MCM4, when high mRNA expression was significantly associated with shorter breast cancer patient survival (Wilcoxon-Gehan test, χ2 = 14.648, P < 0.001; Figure 4H), so was high mRNA expression of MCM2 (Wilcoxon-Gehan test, χ2 = 32.988, P < 0.001; Figure 5A), MCM3 (Wilcoxon-Gehan test, χ2 = 12.184, P < 0.001; Figure 5B), MCM5 (Wilcoxon-Gehan test, χ2 = 11.861, P = 0.001; Figure 5C), MCM6 (Wilcoxon-Gehan test, χ2 = 24.442, P < 0.001; Figure 5D) and MCM7 (Wilcoxon-Gehan test, χ2 = 14.401, P < 0.001; Figure 5E). These results suggest that overexpression of MCM components is associated with breast cancer progression.
Figure 5.
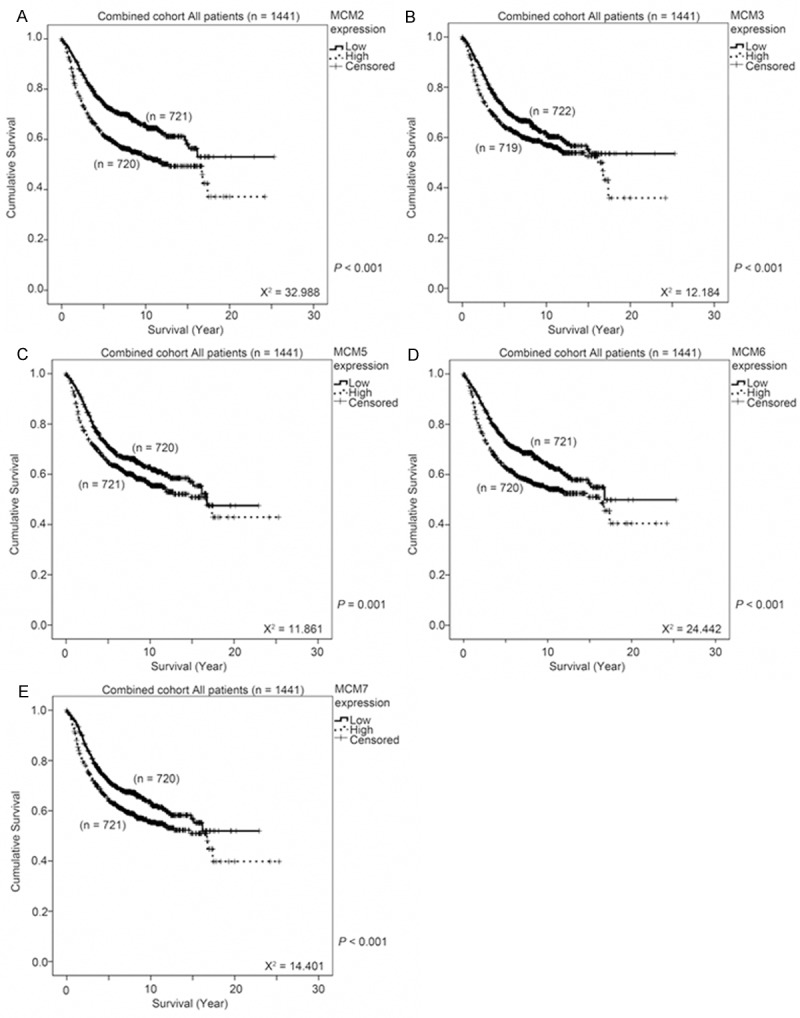
The association between MCMs expression and survival of breast cancer patients. MCM mRNA expression was stratified into high or low expression using the median mRNA expression level as the cut-off point. Kaplan-Meier survival curve for (A) MCM2, (B) MCM3, (C) MCM5, (D) MCM6 and (E) MCM7 expression and the p-value for log-rank test showed alongside for the combined breast cancer dataset.
Combined MCMs overexpression score as a prognostic indicator for breast cancer
As overexpression of any of the components in the MCM replication complex was associated with poorer survival of breast cancer patients, we hypothesized that a combinatorial analysis of expression levels of MCMs could be a better prognostic marker for breast cancer. As shown in Table 3A, patients from dataset GSE1456, whose tumors overexpressed five or six MCMs had a significantly higher risk of death compared to those whose tumors did not overexpress any of the MCMs (Cox-regression analysis - Table 3A). In addition, Kaplan-Meier analysis showed that patients whose breast tumors overexpressed four or more MCM components had a significantly shorter survival time compared to those whose tumors overexpressed three or fewer MCMs (Wilcoxon-Gehan test, P < 0.001; Figure 6A). Similar results were obtained in the other six independent breast cancer patient cohorts included in our study. By Cox-regression analysis, patients whose tumors overexpressed six MCMs had a significantly higher risk of death compared to those patients whose tumors did not overexpress any of the MCMs in GSE2034 (Table 3B), GSE3141 (Table 3C), GSE3494 (Table 3D), GSE11121 (Table 3F) and GSE12276 (Figure 3G) breast cancer cohorts, while patients whose tumors overexpressed four or five MCMs, or three, four or five MCMs also had a significantly higher risk of death compared to those patients whose tumors did not overexpress any of the MCMs in GSE7390 (Table 3E) and GSE12276 (Table 3G), respectively. By Kaplan-Meier analysis, patients whose tumors overexpressed 4 or more MCMs had a significantly shorter survival time than those patients whose tumors overexpressed three or fewer MCMs in GSE3141, GSE3494, GSE7390, GSE11121 and GSE12276 (P < 0.05; Figure 6C-G), while a similar trend, although not statistically significant, was observed in GSE2034 (Figure 6B). In the combined breast cancer dataset consisting of 1441 breast cancer patients, overexpression of increasing number of MCMs is a strong prognostic indictor (Wilcoxon-Gehan test, χ2 = 39.787, P < 0.001; Figure 6H), while patients whose tumors overexpressed 4 or more MCMs had a significantly shorter survival time compared to those patients whose tumors overexpressed three or fewer MCMs by Kaplan-Meier analysis (Wilcoxon-Gehan test, χ2 = 35.189, P < 0.001; Figure 6I). These results strongly suggest that the combinatorial use of the expression levels of MCM2-7 is a reliable prognostic indicator for breast cancer patients. As shown by the Wilcoxon-Gehan test in Figures 4H, 5A-E, and 6H-I, the combinatorial use of the expression levels of MCMs resulted in the highest χ2 values compared to individual use of any of them. Indeed, by using univariate Cox-regression analysis, we found that overexpression of three MCMs is barely significantly associated with an increased hazard ratio, while overexpression of four, five or six MCMs were all statistically significantly associated with an increased hazard ratio (Table 4A). The addition of any of the individual MCMs by multivariate Cox-regression analysis was not statistically significant (Table 4B), suggesting that additional information of the expression of any of the individual MCMs does not contribute significantly to the prognosis of breast cancer on top of the MCMs combinatorial expression score.
Table 3.
Correlation between the number of MCMs overexpressed and the prognosis for patients in seven breast cancer cohorts; (A) GSE1456, (B) GSE2034, (C) GSE3141, (D) GSE3494, (E) GSE7390, (F) GSE11121, (G) GSE12276
| A. Cox-regression analysis for GSE1456 (n = 159) | |||
|
| |||
| Factor | Hazard Ratio | 95% CI | P value |
|
| |||
| MCMs overexpression | |||
| 0 MCM | Reference | ||
| 1 MCMs | 1.03 | 0.21-5.09 | 0.974 |
| 2 MCMs | 1.20 | 0.24-5.95 | 0.823 |
| 3 MCMs | 1.99 | 0.40-9.88 | 0.399 |
| 4 MCMs | 2.75 | 0.66-11.53 | 0.166 |
| 5 MCMs | 1.72 | 1.43-18.00 | 0.012 |
| 6 MCMs | 1.75 | 1.19-15.37 | 0.026 |
|
| |||
| B. Cox-regression analysis for GSE2034 (n = 286) | |||
|
| |||
| Factor | Hazard Ratio | 95% CI | P value |
|
| |||
| MCMs overexpression | |||
| 0 MCM | Reference | ||
| 1 MCMs | 2.11 | 1.00-4.43 | 0.049 |
| 2 MCMs | 1.54 | 0.71-3.35 | 0.278 |
| 3 MCMs | 1.78 | 0.78-3.97 | 0.160 |
| 4 MCMs | 1.81 | 0.81-4.03 | 0.149 |
| 5 MCMs | 1.85 | 0.86-3.98 | 0.117 |
| 6 MCMs | 2.11 | 1.01-4.41 | 0.046 |
|
| |||
| C. Cox-regression analysis for GSE3141 (n = 158) | |||
|
| |||
| Factor | Hazard Ratio | 95% CI | P value |
|
| |||
| MCMs overexpression | |||
| 0 MCM | Reference | ||
| 1 MCMs | 2.24 | 0.69-7.31 | 0.182 |
| 2 MCMs | 1.12 | 0.28-4.52 | 0.873 |
| 3 MCMs | 1.52 | 0.41-5.68 | 0.537 |
| 4 MCMs | 2.49 | 0.80-7.75 | 0.115 |
| 5 MCMs | 2.17 | 0.65-7.25 | 0.207 |
| 6 MCMs | 5.02 | 1.48-17.05 | 0.010 |
|
| |||
| D. Cox-regression analysis for GSE3494 (n = 236) | |||
|
| |||
| Factor | Hazard Ratio | 95% CI | P value |
|
| |||
| MCMs overexpression | |||
| 0 MCM | Reference | ||
| 1 MCMs | 1.39 | 0.45-4.24 | 0.565 |
| 2 MCMs | 1.14 | 0.33-3.94 | 0.837 |
| 3 MCMs | 2.35 | 0.79-7.02 | 0.126 |
| 4 MCMs | 1.86 | 0.54-6.44 | 0.327 |
| 5 MCMs | 2.07 | 0.71-6.05 | 0.185 |
| 6 MCMs | 2.78 | 0.99-7.80 | 0.052 |
|
| |||
| E. Cox-regression analysis for GSE7390 (n = 198) | |||
|
| |||
| Factor | Hazard Ratio | 95% CI | P value |
|
| |||
| MCMs overexpression | |||
| 0 MCM | Reference | ||
| 1 MCMs | 1.74 | 0.53-5.72 | 0.360 |
| 2 MCMs | 1.98 | 0.57-6.86 | 0.281 |
| 3 MCMs | 1.93 | 0.52-7.19 | 0.329 |
| 4 MCMs | 8.81 | 3.26-23.78 | < 0.001 |
| 5 MCMs | 4.39 | 1.52-12.67 | 0.006 |
| 6 MCMs | 1.43 | 0.45-4.52 | 0.539 |
|
| |||
| F. Cox-regression analysis for GSE11121 | |||
|
| |||
| Factor | Hazard Ratio | 95% CI | P value |
|
| |||
| MCMs overexpression | |||
| 0 MCM | Reference | ||
| 1 MCMs | 1.25 | 0.77-2.03 | 0.364 |
| 2 MCMs | 1.29 | 0.76-2.20 | 0.346 |
| 3 MCMs | 2.07 | 1.21-3.54 | 0.008 |
| 4 MCMs | 2.65 | 1.57-4.46 | < 0.001 |
| 5 MCMs | 1.82 | 1.12-2.95 | 0.015 |
| 6 MCMs | 2.18 | 1.42-3.33 | < 0.001 |
|
| |||
| G. Cox-regression analysis for GSE12276 | |||
|
| |||
| Factor | Hazard Ratio | 95% CI | P value |
|
| |||
| MCMs overexpression | |||
| 0 MCM | Reference | ||
| 1 MCMs | 2.78 | 0.72-10.75 | 0.139 |
| 2 MCMs | 3.63 | 0.91-14.52 | 0.069 |
| 3 MCMs | 3.43 | 0.86-13.74 | 0.081 |
| 4 MCMs | 3.41 | 0.85-13.65 | 0.083 |
| 5 MCMs | 3.16 | 0.71-14.13 | 0.132 |
| 6 MCMs | 4.16 | 1.20-14.49 | 0.025 |
Figure 6.

The association between a combinatorial score for MCM2-7 expression and survival of breast cancer patients. (A-G) MCM mRNA expression was stratified into high or low expression using the median mRNA expression level as the cut-off point. Specimens were than stratified into two groups by the number of MCMs expressed at a high level (≤ 3 MCMs or ≥ 4 MCMs expressed at a high level). Kaplan-Meier survival curve for a combinatorial score for MCM2-7 expression and the p-value for log-rank test showed alongside for (A) GSE1456, (B) GSE2034, (C) GSE3141, (D) GSE3494, (E) GSE7390, (F) GSE11121 and (G) GSE12276. (H) Kaplan-Meier survival curve for specimens stratified into seven groups based on the number of MCMs expressed at a high level. (I) Kaplan-Meier survival curve for specimens stratified into two groups based on the number of MCMs expressed at a high level (≤ 3 MCMs or ≥ 4 MCMs expressed at a high level).
Table 4.
Cox-regression analysis reveals that overexpression of four or more MCMs poses a significantly higher hazard ratio than that posed in patients overexpressing three or fewer MCMs
| A. Cox-regression analysis | |||
|
| |||
| Factor | Hazard Ratio | 95% CI | P value |
|
| |||
| MCMs overexpression | |||
| 0 MCM | Reference | ||
| 1 MCMs | 1.22 | 0.89-1.67 | 0.216 |
| 2 MCMs | 1.09 | 0.77-1.54 | 0.610 |
| 3 MCMs | 1.35 | 0.96-1.90 | 0.082 |
| 4 MCMs | 1.84 | 1.35-2.52 | < 0.001 |
| 5 MCMs | 1.72 | 1.26-2.34 | 0.001 |
| 6 MCMs | 1.75 | 1.31-2.34 | < 0.001 |
|
| |||
| B. P value for inclusion in the multivariate Cox-regression analysis | |||
|
| |||
| Factor | P-value for inclusion | ||
|
| |||
| MCM2 | 0.061 | ||
| MCM3 | 0.198 | ||
| MCM4 | 0.881 | ||
| MCM5 | 0.398 | ||
| MCM6 | 0.308 | ||
| MCM7 | 0.641 | ||
The association between MCMs expression and the response to treatment
As MCMs expression was associated with prognosis of breast cancer patients, we further investigated whether expression of MCMs is associated with response to various anti-cancer treatments, including chemotherapies or trastuzumab, in three different breast cancer patient datasets (GSE22093, GSE22358 and GSE42822). We found that breast tumors that responded better (determined by pathological complete response; pCR) to treatment overexpressed statistical significantly more MCMs than those tumors overexpressing fewer MCMs (Figure 7). These results suggest that expression of MCMs can also be used as predictive indicator for response to anti-cancer therapy.
Figure 7.
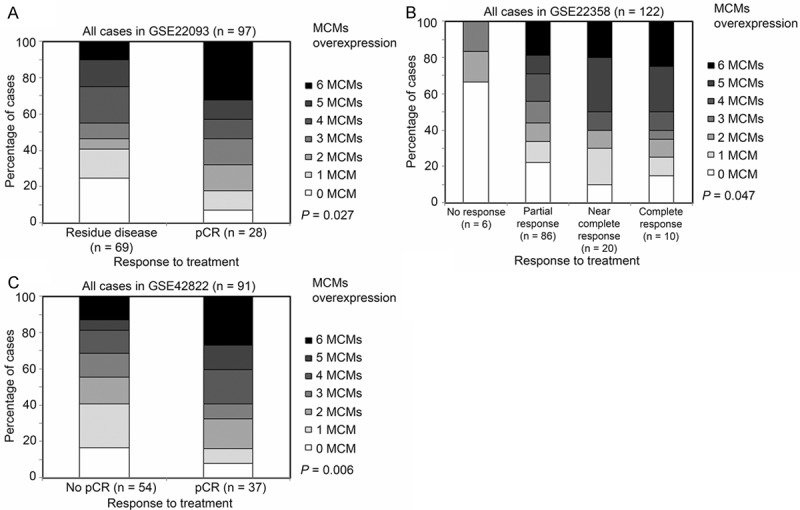
The association between MCMs expression and the response to treatment. Breast cancer patients were stratified according to their response to therapeutic intervention (namely residual disease or pCR for GSE22093 (A); no response, partial response, near complete response or complete response for GSE22358 (B); no pCR or pCR for GSE42822 (C), and this response was correlated with the number of MCM genes overexpressed in individuals’ tumors.
The association between MCM expression and breast cancer patient survival is dependent on the ER status
As MCM4 expression was associated with ER status of breast tumors (Figure 2), we investigated whether the association between MCM4 and survival was dependent on the ER status breast tumor. In the three GEO database breast cancer patient cohorts (GSE2034, GSE3494 and GSE7390) that detailed ER status totaling 716 patients, the association between MCM4 and survival was only observed in patients whose breast tumors were ER positive (P = 0.013; Figure 8B), and not in those patients whose tumors were ER negative (P = 0.487; Figure 8A). Interestingly, ER positive breast cancer was associated with significantly higher expression of all the individual MCMs (MCM2-7) in all three independent breast cancer datasets (ANOVA, P < 0.05; data not shown). As shown in Figure 8C, significantly more ER negative breast tumors overexpressed more MCM components compared to ER positive breast tumors (Chi-Square test, P < 0.001). While only 33% of the ER positive breast tumors had 4 or more MCMs overexpressed, 76% of the ER negative breast tumors had the same extent of MCMs overexpression (Fisher’s Exact test, P < 0.001; Figure 8D). Interestingly, the number of MCMs overexpressed was significantly associated with patient survival time only in patients with ER positive breast tumors (Wilcoxon-Gehan test, P = 0.006; Figure 8F) but not in those patients with ER negative tumors (Wilcoxon-Gehan test, P = 0.281; Figure 8E).
Figure 8.
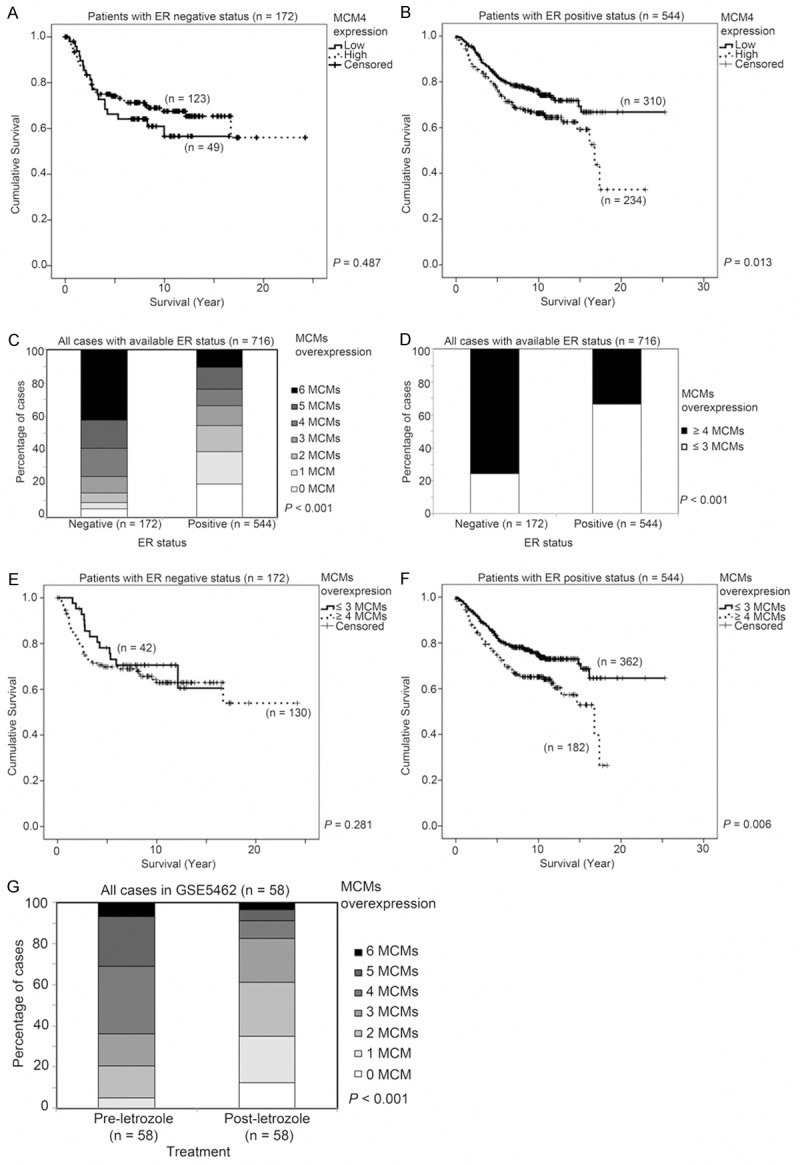
The association of ER status and MCMs mRNA expression, survival and response to letrozole treatment in breast cancer patients. Kaplan-Meier survival curve for MCM4 in specimens with (A) ER-negative and (B) ER positive status. (C) Histogram showing the percentage of cases expressing different numbers of MCMs at a high level. (D) Histogram showing the percentage of cases expressing ≤ 3 MCMs or ≥ 4 MCMs at a high level. Kaplan-Meier survival curve for MCMs combinatorial score (≤ 3 MCMs or ≥ 4 MCMs expressed at a high level) in specimens with (E) ER-negative and (F) ER positive status. (G) Histogram summarizing the impact of letrozole treatment on the expression of MCM mRNAs.
The impact of ER-targeting hormonal therapy on MCM expression was assessed in a breast cancer dataset where the patients were treated with letrozole, and for whom pre-treatment and post-treatment specimens were available [43]. Comparing specimens from pre-letrozole treatment and post-letrozole treatment, we found that mRNA expression of all six MCMs were lower after treatment with letrozole and that the reduction in expression was statistically significant in five of the six MCMs (Paired t test; MCM2, p < 0.001; MCM3, p = 0.003, MCM4, p < 0.001; MCM5, p = 0.083; MCM6, p < 0.001; MCM7, p < 0.001). Indeed, pre-letrozole treated tumors had significantly more MCMs overexpressed compared to those after treatment with letrozole (Figure 8G), indicating that inhibition of ER signaling in ER-positive tumors leads to reduced expression of MCMs. This result suggests that ER signaling is important for expression of MCMs.
Discussion
In this study, we have demonstrated that a high level of expression of MCM4 was associated with breast cancer progression, with ER negative or high grade breast tumors, as well as survival status of breast cancer patients. However, the prognostic significance of MCM4 alone is rather weak; although a high level of MCM4 expression is statistically significantly associated with breast cancer patient survival, the significant association is not robustly observed in the seven independent breast cancer patient cohorts, each with more than 150 patients, included in the current study. Expression levels of all the MCM components in the MCM replication complex are highly correlated with each other, indicating that they may be regulated by similar transcription factors or signaling pathways. Expression level of each MCM in the MCM replication complex, itself, is associated with breast cancer patient survival, suggesting that these MCMs, individually, could contribute to breast cancer prognosis, and co-overexpression of these MCMs may be a better prognostic indicator than MCM4 or other MCMs alone, which could be robustly used for breast cancer prognostication. Indeed, by both Cox-regression and Kaplan-Meier analyses, the association between more MCMs overexpression and a shorter survival time is observed routinely in all the seven independent as well as the combined breast cancer patient cohorts totaling 1441 patients. Most importantly, by multivariate Cox-regression, inclusion of any of the MCMs in the MCM replication complex could not significantly contribute to the power of the combinatorial use of MCMs in breast cancer prognosis.
Although MCM expression is associated with ER negative breast tumors, the MCM-survival association can only be observed in patients with ER positive breast tumors but not in those with ER negative tumors. We hypothesize here that the loss of ER and the resulting ER signaling-independent breast cancer may be associated with uncontrolled MCMs expression. In ER positive breast tumors, it is more likely that signaling pathways or transcription factors downstream of ER signaling activate mRNA expression of MCMs, which leads to increased proliferation and poorer prognosis of breast cancer patients. This hypothesis is supported by the result obtained in GSE5462, where letrozole treatment resulted in a significant decrease in the number of MCMs overexpressed. Our results suggest that ER positive breast cancers are more dependent on MCMs expression, and MCMs may be therapeutic targets for ER positive breast cancer.
A previous study has shown a prognostic role for MCM2 in breast cancer progression [35], the prognostic values of MCM2-7, when considered alone, is not suitably robust in the seven independent breast cancer patient cohorts included in the present study. For this reason, a better prognostic indictor from MCMs expression was sought. Here, we show that the association between a combination of MCMs expressions and survival could be robustly detected in all the seven independent breast cancer patient cohorts, together consisting of 1441 patients, by either Cox-regression analysis or Kaplan-Meier survival analysis. Our results suggest that this combinatorial use of MCM expression levels could be of clinical significance for prognosis of breast cancer patients. In addition, the present study has also demonstrated that expression of MCMs can also be used as predictive indicator for anti-cancer therapy in three independent breast cancer patient datasets, suggesting that combinatorial score of MCMs could be of great clinical interests in the future.
There are limitations in our study. Since the datasets are downloaded from GEO database, patients in these datasets may be of heterogeneous baseline characteristics, treatments, while the laboratory experimental procedures could be heterogeneous too. Nonetheless, the association between high level expression of all MCM proteins and shorter survival was consistently observed in all the individual datasets analyzed and the combined dataset, suggesting that our findings warrant an independent prospective study to confirm the clinical applicability of combining MCM proteins as a prognostic indicator.
In conclusion, the present study has demonstrated the importance of MCM2-7 expression in breast cancer and showed that the combinatorial use of the expressions of MCM2-7 could be a potential novel prognostic and predictive indicator for breast cancer patients.
Acknowledgements
This study was partly supported by the University of Macau SRG grant (SRG2014-00006-FHS) to HFK.
Disclosure of conflict of interest
None to disclose.
References
- 1.Kearsey SE, Maiorano D, Holmes EC, Todorov IT. The role of MCM proteins in the cell cycle control of genome duplication. Bioessays. 1996;18:183–190. doi: 10.1002/bies.950180305. [DOI] [PubMed] [Google Scholar]
- 2.Blow JJ, Dutta A. Preventing re-replication of chromosomal DNA. Nat Rev Mol Cell Biol. 2005;6:476–486. doi: 10.1038/nrm1663. [DOI] [PMC free article] [PubMed] [Google Scholar]
- 3.Tye BK. MCM proteins in DNA replication. Annu Rev Biochem. 1999;68:649–686. doi: 10.1146/annurev.biochem.68.1.649. [DOI] [PubMed] [Google Scholar]
- 4.Labib K, Tercero JA, Diffley JF. Uninterrupted MCM2-7 function required for DNA replication fork progression. Science. 2000;288:1643–1647. doi: 10.1126/science.288.5471.1643. [DOI] [PubMed] [Google Scholar]
- 5.Forsburg SL. Eukaryotic MCM proteins: beyond replication initiation. Microbiol Mol Biol Rev. 2004;68:109–131. doi: 10.1128/MMBR.68.1.109-131.2004. [DOI] [PMC free article] [PubMed] [Google Scholar]
- 6.Tachibana KE, Gonzalez MA, Coleman N. Cell-cycle-dependent regulation of DNA replication and its relevance to cancer pathology. J Pathol. 2005;205:123–129. doi: 10.1002/path.1708. [DOI] [PubMed] [Google Scholar]
- 7.Gonzalez MA, Tachibana KE, Laskey RA, Coleman N. Control of DNA replication and its potential clinical exploitation. Nat Rev Cancer. 2005;5:135–141. doi: 10.1038/nrc1548. [DOI] [PubMed] [Google Scholar]
- 8.Ryu S, Driever W. Minichromosome maintenance proteins as markers for proliferation zones during embryogenesis. Cell Cycle. 2006;5:1140–1142. doi: 10.4161/cc.5.11.2779. [DOI] [PubMed] [Google Scholar]
- 9.Giaginis C, Vgenopoulou S, Vielh P, Theocharis S. MCM proteins as diagnostic and prognostic tumor markers in the clinical setting. Histol Histopathol. 2010;25:351–370. doi: 10.14670/HH-25.351. [DOI] [PubMed] [Google Scholar]
- 10.Davies RJ, Freeman A, Morris LS, Bingham S, Dilworth S, Scott I, Laskey RA, Miller R, Coleman N. Analysis of minichromosome maintenance proteins as a novel method for detection of colorectal cancer in stool. Lancet. 2002;359:1917–1919. doi: 10.1016/S0140-6736(02)08739-1. [DOI] [PubMed] [Google Scholar]
- 11.Wang Y, Li Y, Zhang WY, Xia QJ, Li HG, Wang R, Yang L, Sun XF, Zhou ZG. mRNA expression of minichromosome maintenance 2 in colonic adenoma and adenocarcinoma. Eur J Cancer Prev. 2009;18:40–45. doi: 10.1097/CEJ.0b013e32830c8d5a. [DOI] [PubMed] [Google Scholar]
- 12.Scarpini C, White V, Muralidhar B, Patterson A, Hickey N, Singh N, Mullerat J, Winslet M, Davies RJ, Phillips ML, Stacey P, Laskey RA, Miller R, Nathan M, Coleman N. Improved screening for anal neoplasia by immunocytochemical detection of minichromosome maintenance proteins. Cancer Epidemiol Biomarkers Prev. 2008;17:2855–2864. doi: 10.1158/1055-9965.EPI-08-0288. [DOI] [PubMed] [Google Scholar]
- 13.Sirieix PS, O’Donovan M, Brown J, Save V, Coleman N, Fitzgerald RC. Surface expression of minichromosome maintenance proteins provides a novel method for detecting patients at risk for developing adenocarcinoma in Barrett’s esophagus. Clin Cancer Res. 2003;9:2560–2566. [PubMed] [Google Scholar]
- 14.Huang B, Hu B, Su M, Tian D, Guo Y, Lian S, Liu Z, Wu X, Li Q, Zheng R, Gao Y. Potential role of minichromosome maintenance protein 2 as a screening biomarker in esophageal cancer high-risk population in China. Hum Pathol. 2011;42:808–816. doi: 10.1016/j.humpath.2010.04.022. [DOI] [PubMed] [Google Scholar]
- 15.Saeb-Parsy K, Wilson A, Scarpini C, Corcoran M, Chilcott S, McKean M, Thottakam B, Rai B, Nabi G, Rana D, Perera M, Stewart K, Laskey RA, Neal DE, Coleman N. Diagnosis of bladder cancer by immunocytochemical detection of minichromosome maintenance protein-2 in cells retrieved from urine. Br J Cancer. 2012;107:1384–1391. doi: 10.1038/bjc.2012.381. [DOI] [PMC free article] [PubMed] [Google Scholar]
- 16.Ha SA, Shin SM, Namkoong H, Lee H, Cho GW, Hur SY, Kim TE, Kim JW. Cancer-associated expression of minichromosome maintenance 3 gene in several human cancers and its involvement in tumorigenesis. Clin Cancer Res. 2004;10:8386–8395. doi: 10.1158/1078-0432.CCR-04-1029. [DOI] [PubMed] [Google Scholar]
- 17.Stoeber K, Swinn R, Prevost AT, de Clive-Lowe P, Halsall I, Dilworth SM, Marr J, Turner WH, Bullock N, Doble A, Hales CN, Williams GH. Diagnosis of genito-urinary tract cancer by detection of minichromosome maintenance 5 protein in urine sediments. J Natl Cancer Inst. 2002;94:1071–1079. doi: 10.1093/jnci/94.14.1071. [DOI] [PubMed] [Google Scholar]
- 18.Dudderidge TJ, Kelly JD, Wollenschlaeger A, Okoturo O, Prevost T, Robson W, Leung HY, Williams GH, Stoeber K. Diagnosis of prostate cancer by detection of minichromosome maintenance 5 protein in urine sediments. Br J Cancer. 2010;103:701–707. doi: 10.1038/sj.bjc.6605785. [DOI] [PMC free article] [PubMed] [Google Scholar]
- 19.Brake T, Connor JP, Petereit DG, Lambert PF. Comparative analysis of cervical cancer in women and in a human papillomavirus-transgenic mouse model: identification of minichromosome maintenance protein 7 as an informative biomarker for human cervical cancer. Cancer Res. 2003;63:8173–8180. [PubMed] [Google Scholar]
- 20.Meng MV, Grossfeld GD, Williams GH, Dilworth S, Stoeber K, Mulley TW, Weinberg V, Carroll PR, Tlsty TD. Minichromosome maintenance protein 2 expression in prostate: characterization and association with outcome after therapy for cancer. Clin Cancer Res. 2001;7:2712–2718. [PubMed] [Google Scholar]
- 21.Ramnath N, Hernandez FJ, Tan DF, Huberman JA, Natarajan N, Beck AF, Hyland A, Todorov IT, Brooks JS, Bepler G. MCM2 is an independent predictor of survival in patients with non-small-cell lung cancer. J. Clin. Oncol. 2001;19:4259–4266. doi: 10.1200/JCO.2001.19.22.4259. [DOI] [PubMed] [Google Scholar]
- 22.Gakiopoulou H, Korkolopoulou P, Levidou G, Thymara I, Saetta A, Piperi C, Givalos N, Vassilopoulos I, Ventouri K, Tsenga A, Bamias A, Dimopoulos MA, Agapitos E, Patsouris E. Minichromosome maintenance proteins 2 and 5 in non-benign epithelial ovarian tumours: relationship with cell cycle regulators and prognostic implications. Br J Cancer. 2007;97:1124–1134. doi: 10.1038/sj.bjc.6603992. [DOI] [PMC free article] [PubMed] [Google Scholar]
- 23.Rodins K, Cheale M, Coleman N, Fox SB. Minichromosome maintenance protein 2 expression in normal kidney and renal cell carcinomas: relationship to tumor dormancy and potential clinical utility. Clin Cancer Res. 2002;8:1075–1081. [PubMed] [Google Scholar]
- 24.Dudderidge TJ, Stoeber K, Loddo M, Atkinson G, Fanshawe T, Griffiths DF, Williams GH. Mcm2, Geminin, and KI67 define proliferative state and are prognostic markers in renal cell carcinoma. Clin Cancer Res. 2005;11:2510–2517. doi: 10.1158/1078-0432.CCR-04-1776. [DOI] [PubMed] [Google Scholar]
- 25.Burger M, Denzinger S, Hartmann A, Wieland WF, Stoehr R, Obermann EC. Mcm2 predicts recurrence hazard in stage Ta/T1 bladder cancer more accurately than CK20, Ki67 and histological grade. Br J Cancer. 2007;96:1711–1715. doi: 10.1038/sj.bjc.6603784. [DOI] [PMC free article] [PubMed] [Google Scholar]
- 26.Soling A, Sackewitz M, Volkmar M, Schaarschmidt D, Jacob R, Holzhausen HJ, Rainov NG. Minichromosome maintenance protein 3 elicits a cancer-restricted immune response in patients with brain malignancies and is a strong independent predictor of survival in patients with anaplastic astrocytoma. Clin Cancer Res. 2005;11:249–258. [PubMed] [Google Scholar]
- 27.Winnepenninckx V, Lazar V, Michiels S, Dessen P, Stas M, Alonso SR, Avril MF, Ortiz Romero PL, Robert T, Balacescu O, Eggermont AM, Lenoir G, Sarasin A, Tursz T, van den Oord JJ, Spatz A. Gene expression profiling of primary cutaneous melanoma and clinical outcome. J Natl Cancer Inst. 2006;98:472–482. doi: 10.1093/jnci/djj103. [DOI] [PubMed] [Google Scholar]
- 28.Nishihara K, Shomori K, Fujioka S, Tokuyasu N, Inaba A, Osaki M, Ogawa T, Ito H. Minichromosome maintenance protein 7 in colorectal cancer: implication of prognostic significance. Int J Oncol. 2008;33:245–251. [PubMed] [Google Scholar]
- 29.Fujioka S, Shomori K, Nishihara K, Yamaga K, Nosaka K, Araki K, Haruki T, Taniguchi Y, Nakamura H, Ito H. Expression of minichromosome maintenance 7 (MCM7) in small lung adenocarcinomas (pT1): Prognostic implication. Lung Cancer. 2009;65:223–229. doi: 10.1016/j.lungcan.2008.11.007. [DOI] [PubMed] [Google Scholar]
- 30.Toyokawa G, Masuda K, Daigo Y, Cho HS, Yoshimatsu M, Takawa M, Hayami S, Maejima K, Chino M, Field HI, Neal DE, Tsuchiya E, Ponder BA, Maehara Y, Nakamura Y, Hamamoto R. Minichromosome Maintenance Protein 7 is a potential therapeutic target in human cancer and a novel prognostic marker of non-small cell lung cancer. Mol Cancer. 2011;10:65. doi: 10.1186/1476-4598-10-65. [DOI] [PMC free article] [PubMed] [Google Scholar]
- 31.Ota T, Clayton AC, Minot DM, Shridhar V, Hartmann LC, Gilks CB, Chien JR. Minichromosome maintenance protein 7 as a potential prognostic factor for progression-free survival in high-grade serous carcinomas of the ovary. Mod Pathol. 2011;24:277–287. doi: 10.1038/modpathol.2010.202. [DOI] [PMC free article] [PubMed] [Google Scholar]
- 32.Huang XP, Rong TH, Wu QL, Fu JH, Yang H, Zhao JM, Fang Y. MCM4 expression in esophageal cancer from southern China and its clinical significance. J Cancer Res Clin Oncol. 2005;131:677–682. doi: 10.1007/s00432-005-0011-6. [DOI] [PMC free article] [PubMed] [Google Scholar]
- 33.Kikuchi J, Kinoshita I, Shimizu Y, Kikuchi E, Takeda K, Aburatani H, Oizumi S, Konishi J, Kaga K, Matsuno Y, Birrer MJ, Nishimura M, Dosaka-Akita H. Minichromosome maintenance (MCM) protein 4 as a marker for proliferation and its clinical and clinicopathological significance in non-small cell lung cancer. Lung Cancer. 2011;72:229–237. doi: 10.1016/j.lungcan.2010.08.020. [DOI] [PubMed] [Google Scholar]
- 34.Shima N, Alcaraz A, Liachko I, Buske TR, Andrews CA, Munroe RJ, Hartford SA, Tye BK, Schimenti JC. A viable allele of Mcm4 causes chromosome instability and mammary adenocarcinomas in mice. Nat Genet. 2007;39:93–98. doi: 10.1038/ng1936. [DOI] [PubMed] [Google Scholar]
- 35.Gonzalez MA, Pinder SE, Callagy G, Vowler SL, Morris LS, Bird K, Bell JA, Laskey RA, Coleman N. Minichromosome maintenance protein 2 is a strong independent prognostic marker in breast cancer. J. Clin. Oncol. 2003;21:4306–4313. doi: 10.1200/JCO.2003.04.121. [DOI] [PubMed] [Google Scholar]
- 36.Pawitan Y, Bjohle J, Amler L, Borg AL, Egyhazi S, Hall P, Han X, Holmberg L, Huang F, Klaar S, Liu ET, Miller L, Nordgren H, Ploner A, Sandelin K, Shaw PM, Smeds J, Skoog L, Wedren S, Bergh J. Gene expression profiling spares early breast cancer patients from adjuvant therapy: derived and validated in two population-based cohorts. Breast Cancer Res. 2005;7:R953–964. doi: 10.1186/bcr1325. [DOI] [PMC free article] [PubMed] [Google Scholar]
- 37.Wang Y, Klijn JG, Zhang Y, Sieuwerts AM, Look MP, Yang F, Talantov D, Timmermans M, Meijervan Gelder ME, Yu J, Jatkoe T, Berns EM, Atkins D, Foekens JA. Gene-expression profiles to predict distant metastasis of lymph-node-negative primary breast cancer. Lancet. 2005;365:671–679. doi: 10.1016/S0140-6736(05)17947-1. [DOI] [PubMed] [Google Scholar]
- 38.Bild AH, Yao G, Chang JT, Wang Q, Potti A, Chasse D, Joshi MB, Harpole D, Lancaster JM, Berchuck A, Olson JA Jr, Marks JR, Dressman HK, West M, Nevins JR. Oncogenic pathway signatures in human cancers as a guide to targeted therapies. Nature. 2006;439:353–357. doi: 10.1038/nature04296. [DOI] [PubMed] [Google Scholar]
- 39.Miller LD, Smeds J, George J, Vega VB, Vergara L, Ploner A, Pawitan Y, Hall P, Klaar S, Liu ET, Bergh J. An expression signature for p53 status in human breast cancer predicts mutation status, transcriptional effects, and patient survival. Proc Natl Acad Sci U S A. 2005;102:13550–13555. doi: 10.1073/pnas.0506230102. [DOI] [PMC free article] [PubMed] [Google Scholar]
- 40.Desmedt C, Piette F, Loi S, Wang Y, Lallemand F, Haibe-Kains B, Viale G, Delorenzi M, Zhang Y, d’Assignies MS, Bergh J, Lidereau R, Ellis P, Harris AL, Klijn JG, Foekens JA, Cardoso F, Piccart MJ, Buyse M, Sotiriou C. Strong time dependence of the 76-gene prognostic signature for node-negative breast cancer patients in the TRANSBIG multicenter independent validation series. Clin Cancer Res. 2007;13:3207–3214. doi: 10.1158/1078-0432.CCR-06-2765. [DOI] [PubMed] [Google Scholar]
- 41.Schmidt M, Bohm D, von Torne C, Steiner E, Puhl A, Pilch H, Lehr HA, Hengstler JG, Kolbl H, Gehrmann M. The humoral immune system has a key prognostic impact in node-negative breast cancer. Cancer Res. 2008;68:5405–5413. doi: 10.1158/0008-5472.CAN-07-5206. [DOI] [PubMed] [Google Scholar]
- 42.Bos PD, Zhang XH, Nadal C, Shu W, Gomis RR, Nguyen DX, Minn AJ, van de Vijver MJ, Gerald WL, Foekens JA, Massague J. Genes that mediate breast cancer metastasis to the brain. Nature. 2009;459:1005–1009. doi: 10.1038/nature08021. [DOI] [PMC free article] [PubMed] [Google Scholar]
- 43.Miller WR, Larionov A. Changes in expression of oestrogen regulated and proliferation genes with neoadjuvant treatment highlight heterogeneity of clinical resistance to the aromatase inhibitor, letrozole. Breast Cancer Res. 2010;12:R52. doi: 10.1186/bcr2611. [DOI] [PMC free article] [PubMed] [Google Scholar]
- 44.Iwamoto T, Bianchini G, Booser D, Qi Y, Coutant C, Shiang CY, Santarpia L, Matsuoka J, Hortobagyi GN, Symmans WF, Holmes FA, O’Shaughnessy J, Hellerstedt B, Pippen J, Andre F, Simon R, Pusztai L. Gene pathways associated with prognosis and chemotherapy sensitivity in molecular subtypes of breast cancer. J Natl Cancer Inst. 2011;103:264–272. doi: 10.1093/jnci/djq524. [DOI] [PubMed] [Google Scholar]
- 45.Gluck S, Ross JS, Royce M, McKenna EF Jr, Perou CM, Avisar E, Wu L. TP53 genomics predict higher clinical and pathologic tumor response in operable early-stage breast cancer treated with docetaxel-capecitabine +/- trastuzumab. Breast Cancer Res Treat. 2012;132:781–791. doi: 10.1007/s10549-011-1412-7. [DOI] [PubMed] [Google Scholar]
- 46.Shen K, Qi Y, Song N, Tian C, Rice SD, Gabrin MJ, Brower SL, Symmans WF, O’Shaughnessy JA, Holmes FA, Asmar L, Pusztai L. Cell line derived multi-gene predictor of pathologic response to neoadjuvant chemotherapy in breast cancer: a validation study on US Oncology 02-103 clinical trial. BMC Med Genomics. 2012;5:51. doi: 10.1186/1755-8794-5-51. [DOI] [PMC free article] [PubMed] [Google Scholar]
- 47.Yuen HF, McCrudden CM, Huang YH, Tham JM, Zhang X, Zeng Q, Zhang SD, Hong W. TAZ expression as a prognostic indicator in colorectal cancer. PLoS One. 2013;8:e54211. doi: 10.1371/journal.pone.0054211. [DOI] [PMC free article] [PubMed] [Google Scholar]