

Abstract
Objective:
The purpose of this article is to describe and recommend patient-reported outcome instruments for use in patients with articular cartilage lesions undergoing cartilage repair interventions.
Methods:
Nonsystematic literature search identifying measures addressing pain and function evaluated for validity and psychometric properties in patients with articular cartilage lesions.
Results:
The knee-specific instruments, titled the International Knee Documentation Committee Subjective Knee Form and the Knee injury and Osteoarthritis and Outcome Score, both fulfill the basic requirements for reliability, validity, and responsiveness in cartilage repair patients. A major difference between them is that the former results in a single score and the latter results in 5 subscores. A single score is preferred for simplicity’s sake, whereas subscores allow for evaluation of separate constructs at all levels according to the International Classification of Functioning.
Conclusions:
Because there is no obvious superiority of either instrument at this time, both outcome measures are recommended for use in cartilage repair. Rescaling of the Lysholm Scoring Scale has been suggested, and confirmatory longitudinal studies are needed prior to recommending this scale for use in cartilage repair. Inclusion of a generic measure is feasible in cartilage repair studies and allows analysis of health-related quality of life and health economic outcomes. The Marx or Tegner Activity Rating Scales are feasible and have been evaluated in patients with knee injuries. However, activity measures require age and sex adjustment, and data are lacking in people with cartilage repair.
Keywords: clinical trial, outcome measures, cartilage repair
Outcome measures that reflect patient functioning in a variety of health domains are critical in evaluating the effectiveness of cartilage repair studies and in monitoring the progress of individual patients. Although a number of measures can be identified from the literature, choosing the most appropriate measure requires an understanding of psychometrics. Psychometrics, with its history in psychology and education, is the field concerned with the theory and technique of constructing measures and evaluating the properties of reliability, validity, and responsiveness of instruments such as questionnaires.1 Reliability, validity, and responsiveness result from an interaction between the measure and the context in which it is used. Therefore, the fact that instrument properties have been assessed does not necessarily imply that the properties are sound or better than those of other similar instruments. Rather, the individual researcher or clinician must determine which instrument is the most appropriate for a given group of patients and the intervention of interest.
The purpose of this article is to describe and recommend knee-specific and generic instruments for use in patients with articular cartilage lesions undergoing cartilage repair interventions. This article provides the necessary background related to measurement and describes and recommends knee-specific and generic outcome instruments for use in patients undergoing intervention to promote healing and repair of articular cartilage lesions. In addition, this article provides an overview of some methodological issues that arise in the development, evaluation, interpretation, and application of patient-reported outcomes (PROs).
Measurement Properties
Generic versus Disease-Specific/Organ-Specific Outcome Measures
Outcome measures are categorized as generic or specific. Generic measures include a breadth of domains, often reflecting health-related quality of life, that are relevant across different diseases and populations. In contrast, specific measures include areas of importance related to a specific disease or organ. In research, both a generic and a disease-specific measure are usually included, with a disease-specific measure as the primary outcome. The generic measure is a secondary outcome that should support the results of the primary outcome instrument. An overview of knee-specific and generic instruments of measurement is presented in Table 1.
Table 1.
Knee-Specific and Generic Outcomes Instruments Categorized into Measurement Level, Administration Mode, and How the Result Is Presented
| Measurement Levela | Administration Mode | |||||
|---|---|---|---|---|---|---|
| Scale (Year of Publication) | Body Structure/Body Function | Activity | Participation | Patient Administered | Observer Administered | Assesses Measurement Levelsa in Separate Scores |
| Knee specific | ||||||
| Cincinnati (1984) | • | • | • | |||
| HSS (1989) | • | • | • | |||
| IKDC (1993) | • | • | • | |||
| IKDC Subjective Knee Form (2001) | • | • | • | • | ||
| KSS (1989) | • | • | • | • | ||
| KOOS (1998) | • | • | • | • | • | |
| Lysholm (1982, 1985) | • | • | • | • | ||
| WOMAC (1988) | • | • | • | • | ||
| Generic | ||||||
| EQ-5D (1990) | • | • | • | • | ||
| SF-36 (1992) | • | • | • | • | • | • |
| SF-12 (1996) | • | • | • | • | • | • |
Cincinnati = Cincinnati Knee Rating Scale; HSS = Hospital for Special Surgery knee rating scale; IKDC = International Knee Documentation Committee; KSS = Knee Society Score; KOOS = Knee Injury and Osteoarthritis Outcome Score; Lysholm = Lysholm Knee Scoring Scale; WOMAC = Western Ontario and McMaster Universities Osteoarthritis Index; EQ-5D = EuroQoL-5 Dimensions; SF-36 = Short-Form 36 items of the Medical Outcomes Study; SF-12= Short-Form 12 items of the Medical Outcomes Study.
According to the International Classification of Functioning, Disability and Health (ICF).4
Clinician-Reported versus Patient-Reported Outcomes
Historically, outcome measures for assessment of knee-related symptoms and function have been developed and completed by surgeons. Examples include the Knee Society Score, Hospital for Special Surgery Score, the International Knee Documentation Committee (IKDC) Knee Examination Form, and the Lysholm Scoring Scale. The content and scoring of these measures reflect the surgeon’s perspective of the relative importance of symptoms and function that need to be evaluated, and they are not meant for patient self-completion; that is, the content and responses do not reflect the patient’s perspective.
In contrast, PROs include the patient’s perspective regarding important content, and the responses to the questions reflect the patient’s perception of his or her health status.
Recently, efforts have been made to update some of these clinician-based measures so that they can be used for PROs. Such efforts include providing instructions for and recommending patient self-reporting, which improves standardization and decreases assessor bias. However, this does not improve the content or construct validity of the instrument. To do so, the instrument needs to be reconstructed to ensure inclusion of relevant content from the patient’s perspective, which is then revalidated in clinical studies.
Development and Content Validity of Patient-Reported Outcome Measures
Today, the patient’s perspective is central in health care, and there is consensus that domains such as symptoms, function, and other aspects considered important by patients should be assessed from the patient’s perspective and by the patient. To achieve this standard, processes such as focus groups are used in developing outcome measures. Adhering to this standard ensures content validity and minimizes bias as patients determine the important content for a health measure.
Domain Scores versus a Single Total Score
Clinician-derived scores often provide a single aggregated score. This is despite the individual items assessing separate and not necessarily related constructs, such as pain and range of motion. Although there is appeal in a single score for simplicity’s sake, reporting outcomes in separate subscales helps in interpreting the outcome of clinical studies and can assist patients in their understanding of the expected course of their recovery over a number of outcomes. In a 4-year follow-up of polymer-based autologous chondrocyte grafts,2 a significant improvement was seen at 3 months with the Lysholm Scoring Scale. The IKDC Subjective Knee Evaluation Form showed significant improvement at 6 months. Both these scores were reported as one aggregated score. In contrast, the Knee Injury and Osteoarthritis and Outcome Score (KOOS), which provides subscale scores, showed statistical improvements in the pain, activities of daily living (ADL) function, and knee-related quality-of-life subscale scores at 3 months; the Sport and Recreation Function was not statistically improved until 4 years; and other symptoms, including swelling and range of motion, did not improve significantly during the 4 years. Similarly, Greco et al.,3 at 6 and 12 months following different surgical interventions addressing cartilage defects, found larger improvement in the Western Ontario and McMaster Universities Osteoarthritis Index (WOMAC) function subscale (equivalent to the KOOS ADL subscale) compared to the IKDC Subjective Knee Form and the modified Cincinnati Knee Rating System, both of which evaluate more strenuous activities relating to sport.
Theoretical frameworks such as the International Classification of Functioning, Disability and Health (ICF)4 often provide guidance in grouping the items of a measure into meaningful subscales. For example, this framework includes outcomes at the level of body structure and function (the anatomical and physiological level), activity (the person level), and participation (the level to which the person interacts with society). Items such as pain and activities of daily living represent the ICF domains of body function and activity, respectively. An overview of knee-specific and generic instruments where the measures are categorized according to the ICF is presented in Table 1. Within a subscale, statistical methods such as interitem correlation and factor analysis are used to evaluate whether related items have membership within a subscale. More recently, Rasch analysis and item response theory methods have been used to evaluate whether items in a subscale are measuring the same construct, to rank item difficulty within a subscale, and to create a measure with interval-level scores.5,6
Reliability
Having determined the items in a subscale, reliability is critical because the measurement precision of an attribute is inversely related to the size of the measurement error. For self-report measures, test-retest reliability is calculated, and in the case of interviewer-administered questionnaires, interrater reliability is also evaluated. A number of authors1,7,8 have provided recommended values for reliability coefficients—generally, 0.80 to 0.90 for groups and in excess of 0.90 for individual patient use. In clinical trials, reliability affects the required sample size as measures that have more error will require larger samples.9 At the individual level, reliability affects the ability to determine if an individual patient is actually changing (i.e., the amount of change required beyond measurement error to allow confidence that true change has occurred).10,11 This is often quantified as the minimal detectable change (MDC). The MDC95 is the amount of change you need to see before you are 95% confident that the person is truly changing and is calculated as 1.96 × standard deviation × , where r is the test-retest reliability coefficient.12,13 The effect of a test-retest reliability of 0.97 versus 0.92 can be demonstrated by calculating the MDC95 when the standard deviation is 19 for a measure scored 0 to 100. Solving the equation, the MDC95 is 9.1 and 14.9 points, respectively, for reliability of 0.97 and 0.92.
Construct Validity
Patient-reported outcomes evaluate constructs or abstract concepts (i.e., they are not tangible such as height). Rather, a construct is measured by creating a scale from several items that are related to the construct. For example, activity limitation is a construct and could be measured by asking about difficulty on a number of related items that represent aspects of activity (e.g., walking on level ground, squatting, climbing stairs). Given that there is no tangible, quantitative measure of a construct, validity is determined by testing a series of hypotheses about how the score on such a scale representing the construct is related, both in direction and magnitude, to another external measure. From clinical knowledge, people with knee pain often experience difficulty walking; therefore, one might test the hypothesis that people with higher levels of pain have poorer physical function, as measured by a PRO.
A measure cannot be considered generally “valid” or “invalid,” “reliable” or “not reliable.” Rather, it has validity and reliability in a given context with a specified group of patients for a particular purpose.14 Patient-reported outcomes for use in cartilage repair studies, therefore, require demonstrated validity in patients with articular cartilage defects. Articular cartilage defects are often associated with other knee injuries such as deficiency of the anterior cruciate ligament (ACL) or meniscal tears, and the inclusion of patients in different studies may depend not only on the structural damage of the knee but also on the intervention of interest. A large proportion of patients having ACL reconstruction may have associated articular cartilage defects. It can be argued that measures validated for use in patients with a knee injury of similar age and activity level can be used for assessment of patients undergoing treatment for articular cartilage defects. However, one major difference between patients having a cartilage repair procedure and those having ACL reconstruction is that patients having treatment for articular cartilage defects have experienced symptoms for a prolonged time and perceive pain as a dominant symptom. In this sense, patients with articular cartilage defects are similar to patients with osteoarthritis (OA) of the knee. Constructs important to assess in patients with articular cartilage defects include pain; other symptoms such as stiffness, swelling, and mechanical problems; physical function; quality of life; and physical activity level.15 Function in sport and recreation is more relevant than function in daily life to younger and more active patients.15,16 However, improvement in function in daily life is seen earlier following cartilage repair than improvement in functioning in sport,2,3 suggesting both constructs are of importance.
Responsiveness
Measures used to evaluate outcomes in patients with cartilage repair need to be responsive; that is, they need to be able to detect change in status when true change has occurred. This change may be within a single group over time, between 2 groups where each experienced a different intervention, or a hybrid where the change over time between 2 groups is considered. Irrespective of the type of change, responsiveness can be reported using an effect size (standardized change score) for paired or unpaired data as appropriate.17 Effect size is usually calculated as the difference between the mean before treatment and after treatment and dividing it by the standard deviation of the same measure before treatment.18 Dividing the mean score change by the standard deviation of that score change is usually referred to as the standardized response mean (SRM).19 For example, in the study by Bekkers et al.,20 effect sizes ranging from 0.70 to 1.32 were seen in the KOOS subscales 3 years after autologous cartilage implantation or microfracture (Table 2). In this case, the effect size can be used for calculation of sample size in future studies of these interventions. An effect size of 0.70 implies that 18 patients would be needed to be able to detect a statistical difference within a single group of subjects from before to after treatment with a power of 80% and an alpha level of .05. An effect size of 1.32 implies that only 7 patients would be needed to detect a change over time within a single group of subjects (Figure 1). In the study by Greco et al.,3 the responsiveness of 4 different PROs was determined for a case mix of patients with traumatic cartilage lesions, osteochondritis dissecans, OA, or other diagnoses. The patients had 1 of 6 articular cartilage procedures and, in 40 cases, 1 or more of 12 associated procedures. In this study, the effect sizes reported from the application of the 4 different instruments applied can be compared to each other to determine the most responsive instrument. However, the effect sizes cannot reliably be used for calculation of sample size in future clinical trials of cartilage repair as responsiveness of a measure is based on the context of the participants who comprise the sample and the intervention. An effect size based on patient-reported perceived longitudinal change, as in the examples above, cannot be used to calculate sample size for a between-group analysis. Often the difference in patient-reported outcome between groups is smaller than the longitudinal change within each group, necessitating a larger sample size to detect a significant difference between groups. Sample size is further discussed under “Statistical Issues.”
Table 2.
Examples of Studies with Head-to-Head Comparisons of Different Knee-Specific and Generic Outcomes Instruments Where Data Were Available for Calculation of Effect Size
| Effect Size (ES) | |||||||
|---|---|---|---|---|---|---|---|
| Bekkers et al. (2009)20 | Greco et al. (2010)3 | Robertson et al. (2007)87 | Knutsen et al. (2004)54,a and Knutsen et al. (2007)88 | Ossendorf et al. (2007)56,a | Zaslav et al. (2009)57 | McNickle et al. (2009)60,a | |
| Study details |
N = 40 MACI (n = 20) and microfracture (n = 20) No difference in ES between treatments 36-month follow-up |
N = 50 Various single or multiple procedures, including cell therapy (n = 15), tibial osteotomy (n = 14), mosaicplasty (n = 13), debridement (n = 11) 12-month follow-up |
N = 27 CACI 24-month follow-up |
N = 80 ACI (n = 40) and microfracture (n = 40) 24-month follow-up |
N = 40 ACI 24-month follow-up |
N = 154 ACI 24-month follow-up |
N = 122 ACI 2- to 9.7-year follow-up Mean 4.3-year follow-up |
| Scale | |||||||
| Knee specific | |||||||
| Cincinnati | 1.09 | 2.59 | |||||
| IKDC Subjective Knee Form | 1.06 | 1.97 | |||||
| KOOS | |||||||
| Pain | 0.82 | 1.90 | 0.49 | 1.32 | 1.29 | ||
| Symptoms | 0.72 | 1.32 | 0.34 | 0.86 | 1.11 | ||
| ADL | 0.70 | 1.20 | 1.36 | 0.28 | 1.14 | 0.91 | |
| Sport/Rec | 0.98 | 2.28 | 0.32 | 1.03 | 1.30 | ||
| QOL | 1.32 | 1.70 | 1.01 | 1.56 | 1.50 | ||
| Lysholm scale | 0.53 (ACI) | 1.30 | |||||
| WOMAC | 0.83 (MF) | ||||||
| Pain | 1.14 | ||||||
| Stiffness | 0.72 | ||||||
| Function | 1.20 | ||||||
| Generic | |||||||
| SF-36 | |||||||
| PF | 0.67 | 0.47 | |||||
| RP | 0.63 | 0.45 | |||||
| BP | 0.60 | 0.62 | |||||
| GH | 0.06 | 0.32 | |||||
| VT | 0.43 | 0.45 | |||||
| SF | 0.57 | 0.44 | |||||
| RE | 0.48 | 0.16 | |||||
| MH | 0.32 | 0.29 | |||||
| PCS | 0.10 (ACI) 1.10 (MF) |
1.01 | |||||
| SF-12 | |||||||
| MCS | 0.35 | ||||||
| PCS | 0.27 | ||||||
| Activity rating scales | |||||||
| Marx | 0.76 | ||||||
| Tegner | 0.67 | ||||||
Note: Effect size was calculated by taking the difference between the means before treatment and after treatment and dividing by the standard deviation of the mean before treatment.18 An ES of <0.50, <0.80, and ≥0.80 is considered small, moderate, and large, respectively. Comparisons can only be made within columns since each column describes different populations and different interventions. ES = effect size; ACI = autologous chondrocyte implantation; MACI = matrix-induced autologous chondrocyte implantation; CACI = collagen-covered autologous chondrocyte implantation; IKDC = International Knee Documentation Committee; KOOS = Knee Injury and Osteoarthritis Outcome Score; ADL = activities of daily living; QOL = quality of life; WOMAC = Western Ontario and McMaster Universities Osteoarthritis Index; PCS = physical component score; MF = microfracture; MCS = mental component score; SF-36 = Short-Form 36 items of the Medical Outcomes Study; PF = Physical Functioning subscale; RP = Role—Physical subscale; BP = Bodily Pain subscale; GH = General Health subscale; VT = Vitality subscale; SF = Social Functioning subscale; RE = Role—Emotional subscale; MH = Mental Health subscale; SF-12 = Short-Form 12 items of the Medical Outcomes Study.
Effect sizes were estimated from data reported in figures.
Figure 1.
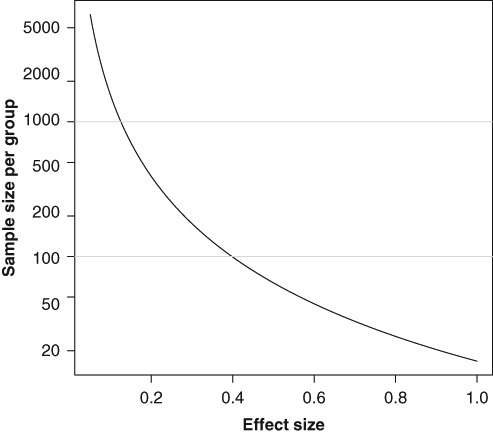
The relation between effect size (difference in mean scores relative to the common standard deviation) and sample size for a comparison of 2 groups of patients using a 2-tailed Student t test with 5% significance level and 80% power.
In determining the effectiveness of an intervention, the proportion of individuals who achieve a minimal clinically important difference (MCID) is also considered. A given PRO has a range of MCIDs, as the value is based on the patient group and intervention. A number of methods exist for considering important change,21-23 the details of which are beyond the scope of this article. However, it is generally considered that patients need to determine the magnitude that represents important change. The reporting of the proportion of responders is also considered necessary in clinical trials, although the MCID has not been determined for many PROs.24
Examples of measures developed and tested according to the above outlined principles include the WOMAC and the KOOS. The WOMAC has been validated in elderly people with knee and hip OA, and the KOOS, which includes WOMAC version 3.0, was developed to ensure validity for the young person with a knee injury, the middle-aged person with posttraumatic OA, and the elderly person with more severe OA. The IKDC Subjective Knee Form was tested according to the above outlined principles, but the initial set of questions for the IKDC Subjective Knee Form was developed by members of the IKDC and did not include patient input.25
Several measures developed earlier, including the Lysholm Scoring Scale, have been modified to meet the current standard for PROs. The IKDC Subjective Knee Form, the KOOS, and the Lysholm Scoring Scale have been selected for this review because these measures address improvements in pain and physical function, which are considered the most clinically meaningful endpoints for treatments of articular cartilage lesions.26 Furthermore, these measures have been evaluated for their validity and psychometric properties in patients with articular cartilage lesions. The measurement properties of the respective questionnaires are described in detail below. A similar description follows of 3 commonly used generic measures—the Short Form–36 (SF-36), the Short Form–12 (SF-12), and the EuroQoL (EQ-5D)—and 2 measures of activity level: the Marx and Tegner Activity Rating Scales.
Measurement Instruments
The IKDC Subjective Knee Form
The IKDC Subjective Knee Form is a PRO measure that assesses symptoms, daily activity, and sports function due to a variety of conditions affecting the knee, including ligament injuries, meniscal injuries, patellofemoral pain, OA, and chondral disorders. The IKDC Subjective Knee Form consists of 18 items that are summed and expressed as a percentage of the maximum total possible score. Scores range from 0 to 100, with 100 indicating the absence of symptoms and higher levels of functioning. The IKDC is widely accepted and used in the international research community. The IKDC Subjective Knee Form is included as a primary outcome measure in the Multicenter Orthopaedic Outcomes Network (MOON) and is available in the International Cartilage Research Society Socrates software program. The IKDC Subjective Knee Form, including a user manual that includes instructions for scoring and management of missing data and an Excel file for scoring, is available from the American Orthopaedic Society for Sports Medicine at www.sportsmed.org/tabs/research/ikdc.aspx.
Psychometric testing of the IKDC Subjective Knee Form in a sample of 533 individuals with ligament and meniscus injuries, articular cartilage lesions, patellofemoral dysfunction, and OA revealed high levels of internal consistency (coefficient α = .92) and test-retest reliability (assessed over on average 49.7 days; intraclass correlation coefficient [ICC] = .95).25 Factor analysis revealed a single dominant component underlying the responses to the items included on the IKDC Subjective Knee Form, indicating that it was reasonable to combine the items into a single score. As hypothesized, the IKDC Subjective Knee Form was found to be related to concurrent measures of physical function (r = .47-.66) but not to emotional function (r = .16-.26). Application of item response theory to assess differential item function indicated that the items functioned similarly for young and old, males and females, and individuals with different diagnoses. Responsiveness was assessed in a sample of 207 individuals with a variety of knee conditions who underwent a variety of operative and nonoperative interventions with an average length of follow-up of 1.6 years.27 The effect size and standardized response mean over the course of time were large (1.13 and 0.94, respectively) for all participants. Analysis of the receiver operating characteristic curve suggested that there were two optimal values for the MCID. A change score of 11.5 had a sensitivity and specificity of change of 82% and 64%, respectively, and a change score of 20.5 had a sensitivity and specificity of change of 64% and 84% to distinguish between those who perceived themselves to be improved from those who did not. These results can be used to help determine the meaningfulness of the change score from the patient’s perspective. A change score of less than 11.5 indicates that it is likely the individual does not perceive himself or herself to be improved. Conversely, if the change score is greater than 20.5, the individual is likely to perceive himself or herself as improved. Age- and sex-specific normative data also have been established in a representative noninstitutionalized sample of 2625 individuals in the United States.28 The IKDC Subjective Knee Form has been validated in 10 languages. It has been modified for use in pediatric patients and found reliable, valid, and responsive in patients 10 to 18 years.29
Psychometric Properties in Patients with Articular Cartilage Lesions
The IKDC Subjective Knee Form has been evaluated in individuals with articular cartilage lesions and OA. Individuals who underwent articular cartilage repair rated the majority of items to be both important and of frequent occurrence.15 Only 1 item (difficulty sitting) was not experienced by at least 51% of the sample, and only 4 items (difficulty sitting, knee locks, swelling limits strenuous activities, and giving way limits strenuous activities) were not experienced by at least 76% of the sample. In individuals with knee OA, all 18 items were experienced by at least 51% of the sample, and only 2 questions had a low mean importance rating.30
Most recently, reliability and responsiveness of the IKDC Subjective Knee Form were evaluated in individuals undergoing articular cartilage surgery.3 The form was administered 3 times over a 12-month period. To assess reliability, the IKDC Subjective Knee Form was administered to 49 subjects who had undergone autologous cartilage cell implantation at least 5 years prior to this study. However, only 17 of these individuals reported no change in the status of their knee over the 12-month follow-up. The ICC for test-retest reliability in the 17 individuals who reported no change in status was .91 and .93 at 6 and 12 months, respectively, and the MDC was 15.6 and 13.7, respectively.
The responsiveness at 6 months, calculated as effect size and standardized response mean for those undergoing a variety of articular cartilage procedures, was .76 and .57, respectively, and at 12 months, it was 1.06 and 1.00. At 6 months, the minimum clinically important change was 6.3, which had a sensitivity of 79% and specificity of 74%. It should be noted that although this change in the IKDC Subjective Knee Form was considered important based on comparison to the patient’s global rating of change, the MCID of 6.3 at 6 months is smaller than the MDC of 15.6 at 6 months, so we cannot be sure that this small MCID does not simply reflect “noise” or error in measurement. Twelve months after surgery, the MCID was 16.7, with a sensitivity of 74% and specificity of 80%. The differential responsiveness, based on the effect size and SRM, at 6 and 12 months after surgery is indicative of the relative difficulty of the items. For example, 6 months after articular cartilage surgery, individuals would still be expected to have limited ability to perform strenuous sports activities, which would limit the magnitude of the change score at this point in time.
The KOOS
The KOOS was developed in 1994-1995 as an extension of the WOMAC Osteoarthritis Index with the purpose of evaluating short-term and long-term symptoms and function in people with knee injury and OA. The KOOS includes 42 items in 5 separately scored subscales: Pain, Other Symptoms, Activities of Daily Living (ADL), Function in Sport and Recreation (Sport/Rec), and Knee-related Quality of Life (QOL). Each subscale is scored from 0 to 100 on a worst to best scale. Evidence supports the use of the KOOS for several orthopedic interventions such as autologous cartilage repair and microfracture,20 ACL reconstruction,31 meniscectomy,32 and total knee replacement.33 The KOOS has been used to evaluate other interventions, including tibial osteotomy, physical therapy, nutritional supplementation, and glucosamine supplementation. The KOOS is used in many large-scale databases, including the prospective registries on ACL reconstruction in Norway, Sweden, and Denmark; the MOON database in the United States; and the National Institutes of Health–sponsored Osteoarthritis Initiative following 5000 patients at risk of OA, or with OA, for 5 years. Data from the latter study are freely available at www.oai.ucsf.edu. Normative data from the general population and from men and women having ACL reconstruction have been published.34-37 The KOOS questionnaire is available in 28 different language versions. These versions, together with a user’s guide and an Excel scoring file, can be downloaded free of charge from www.koos.nu. The KOOS is also included in the International Cartilage Repair Society Socrates outcomes package and software.
Psychometric Properties in Patients with Articular Cartilage Lesions
In the reliability evaluation of the KOOS for people with articular cartilage lesions,20 test-retest was assessed over 2 days. The ICCs ranged from 0.87 to 0.95 for the 5 subscales, and the internal consistency ranged from 0.74 to 0.95. The MDC was 6, 5, 7, 12, and 7 for the subscales Pain, Symptoms, ADL, Sport/Rec, and QOL, respectively. For all subscales but Sport/Rec, the MDCs were smaller than the suggested MCID of 8 to 10,38 indicating that the KOOS has sufficient test-retest reliability to detect the suggested MCID. It should be noted, however, that the MCID has not been assessed for patients having cartilage repair procedures. For the subscale Sport/Rec, the MDC was 12 due to a very large standard deviation at baseline. In that study, smaller differences than 12 could not be detected for the subscale Sport/Rec.
Construct validity was assessed in comparison to the SF-36, EQ-5D, and the Lysholm Scoring Scale.20 Moderate correlations were found in support of the a priori hypotheses: KOOS symptoms and SF-36 physical function rS = .58, KOOS pain and SF-36 bodily pain rS = .66, KOOS ADL and SF-36 physical functioning rS = .56, and KOOS Sport/Rec and Lysholm rS = .70. No a priori unexpectedly low correlations (<.50) were found.
The responsiveness at 3 years following autologous cartilage implantation or microfracture was similar and considered moderate to large, with effect sizes ranging from 0.70 to 1.32. The ADL subscale was the least responsive at 0.70, whereas the subscales Sport/Rec and knee-related QOL were the most responsive, with effect sizes of 0.98 and 1.32, respectively, as shown in Table 2.
Lysholm Scoring Scale
The Lysholm Scoring Scale,39 first introduced in 1982 and later modified in 1985, is a commonly used scale for the assessment of knee function after knee ligament injury. The scale consists of 8 items assessing pain (25 points), instability (25 points), locking (15 points), swelling (10 points), limp (5 points), stair climbing (10 points), squatting (5 points), and need for support (5 points) aggregated into a total score of 0 to 100, worst to best. Normative values for individuals with normal knees have been determined.40 Recently, the Lysholm Scoring Scale was modified for patient self-completion41 and for use in articular cartilage damage.42,43
Psychometric Properties in Patients with Articular Cartilage Lesions
The reliability and validity of the Lysholm Scoring Scale were evaluated in large samples of patients with a variety of chondral defects.43 Based on patient self-report, internal consistency was 0.65, and test-retest reliability over a period of up to 4 weeks was 0.91 based on the ICC. Individual item reliability coefficients ranged from 0.61 for pain to 0.98 for use of a support. Validity was demonstrated based on moderate associations with the SF-12 subscales, the WOMAC subscales, and the Tegner Activity Scale. In addition, people with more severe defects (thickness, number, etc.) had poorer scores than expected, and people with more difficulty working and engaging in their sporting activities had worse Lysholm scores. Responsiveness was evaluated after arthroscopic microfracture in 248 patients. The standardized response mean after, on average, 4.2 years was large at 1.10, with individual item values ranging from 0.20 for instability to 1.28 for pain.
More recently, Smith et al.42 evaluated the scaling properties (i.e., determining that the measure was a single construct with an interval level total score) of the Lysholm score using Rasch analysis. After removal of the swelling item, the data met the model assumptions. Internal consistency was .73, and importantly, there was high agreement between patient and physiotherapist ratings (ICC = .90). The analysis, however, did find that the arbitrary weighting system (described above) was not supported. For example, squatting is the second most difficult item based on the Rasch analysis, yet it is weighted with the lowest difficulty items. Of note, these data were based on 157 patients awaiting surgery for a chondral lesion in the United Kingdom and Norway. Given the limited sample and the cross-sectional nature of the data, further study is required to confirm the results using Rasch analysis prior to modifying the measure. Furthermore, longitudinal administration and evaluation of responsiveness are required.
Additional Scales and Data for Analysis of Health-Related Quality of Life and Health Economic Outcomes
The pain and dysfunction from OA are known to be associated with significant deterioration in patients’ general physical and mental well-being.44-47 Individuals with untreated articular cartilage defects also experience chronic pain and prolonged inactivity and have an increased risk of decline in general health status. Improving overall health-related quality of life (HRQOL), therefore, should be a treatment goal, along with the primary goals of relieving pain and restoring patients to normal function. The SF-36, SF-12, and EQ-5D are generic, patient-reported HRQOL measures that are recommended for inclusion in clinical trials of cartilage defect interventions. Although published data are limited for estimating effect sizes among patients having cartilage repair (Table 2), the generic instruments have demonstrated acceptable sensitivity to change in numerous other diseases. The instruments generally have good measurement properties, and patients find them easy to complete. In addition, scores from these instruments can be converted to quality-adjusted life years (QALYs) for cost-effectiveness analysis. The instruments are described below.
Medical Outcomes Study 36-Item Short-Form Health Survey (SF-36)
The SF-36 is a 36-item instrument with 8 scales (Physical Functioning, Role—Physical, Bodily Pain, General Health, Vitality, Social Functioning, Role—Emotional, and Mental Health) and 2 summary measures (physical and mental well-being).48-50 Standardized scores range from 0 to 100, with higher scores indicating better health status. The SF-36 has been validated among clinical trial participants with arthritis of the knee or hip.51,52 Normative data are available for interpreting the scale by comparing to average values from various subpopulations, such as individuals without chronic conditions (i.e., healthy individuals) or individuals with chronic or comorbid conditions (e.g., arthritis, back pain, cancer, depression). Brazier et al.53 have developed a method for mapping SF-36 scores to utility scores that can be converted to QALYs for cost-effectiveness analysis. License to use the SF-36 (and SF-12) and a user manual can be obtained for a fee from www.sf-36.org.
The SF-36 has been widely used as a general health status measure in clinical trials of cartilage repair treatments and has demonstrated sensitivity to change, with effect sizes ranging from small to large3,54-57 (Table 2).
Medical Outcomes Study 12-Item Short-Form Health Survey (SF-12)
The SF-12 is an abbreviated version of the SF-36.58 Similar to the SF-36, the SF-12 provides summary measures for physical and mental well-being, with standardized scores that range from 0 to 100. Normative data are available for the SF-12 version 2. Scores from the SF-12 can be mapped to utility scores for cost-effectiveness analysis.59 The measure has demonstrated sensitivity to change in clinical trials of patients with chondral defects of the patella, trochlea, or femoral condyles; meniscus transplantation; and knee OA60-62 (Table 2).
EuroQoL 5 Dimension Health Questionnaire (EQ-5D)
The EQ-5D is used in a wide range of health conditions and treatments. The instrument includes a visual analog scale (VAS) and 5 HRQOL items that evaluate the concepts of anxiety/depression, mobility, pain/discomfort, self-care, and usual activities.63,64 Scores from the 5 concepts are transformed into a single utility score that can be converted to QALYs for cost-effectiveness analysis. The VAS is a separate quantitative measure of overall health status. Higher values for the utility scores and VAS indicate less dysfunction. The measure has demonstrated the ability to detect changes over time in studies of treatments for cartilage defects and OA of the knee.65-67
Health Care Resource Use for Cost-Effectiveness Analysis
With the current global focus on cost-effectiveness and comparative effectiveness of medical interventions, it is important for payers to see evidence of the economic value of new treatments.68-70 Cost assessment is beyond the scope of this article, but, in brief, collection of data on patients’ health care resource use and HRQOL, which can be converted to utility scores, will allow a cost-effectiveness analysis to be conducted. Clinical trial case report forms should include data on the performance of the index procedure, unscheduled follow-up treatments, concomitant medications, and serious adverse events. Unit costs such as national average payments can be assigned to the units of resource use in the data analysis, thus making the cost estimates more representative and the collection of specific cost data from the trial unnecessary.
Activity Rating Scales for Use in Cartilage Repair
Ability to return to preinjury activity is regarded as an important factor when judging the results after different orthopedic procedures. Activity level is a separate construct, not necessarily related to pain and function,71 and therefore, to provide a more complete evaluation of the patient’s situation, it should be evaluated in addition to the functional outcome captured by the KOOS, the IKDC Subjective Knee Form, or the Lysholm score. It is important to note that activity level scales should not be used to make comparisons between individual patients but to note longitudinal change in activity level within the same individual over time. The preinjury, current, and desired activity level can easily be defined.
It is recommended that an activity rating scale be used as a secondary outcome measure for all studies of outcome following orthopedic surgery, particularly for studies evaluating cartilage repair surgery. When comparing self-reported activity level between treatment groups in a clinical trial, adjustment is needed for age and gender.71
Tegner Activity Rating Scale
The Tegner Activity Rating Scale was constructed by having athletes and doctors grade a number of activities according to how difficult they considered them to be for a patient with a cruciate ligament injury. Since the scale was first published, it has been used in several hundred studies. Although it was originally tested and used for ACL injuries, it has been used for other knee problems72,73 and in the evaluation of other joints.74,75
The Tegner Activity Rating Scale is a numerical 11-point scale in a compact format that makes it easy and quick to use. It is intended to be used as a patient self-completed instrument. It initially contained only 19 kinds of sports, but today it includes more than 170 activities (Y. Tegner, personal communication, 2009). The Tegner Activity Rating Scale separates recreational and competitive sporting activities because the risk and injury incidence are higher in competitive sports. For example, an individual participating in soccer, football, or rugby at an elite level is considered to have an activity level of 10. If the individual is participating in the same activities but at a recreational level, the activity level is 7. If an individual is on sick leave due to knee problems, the activity level is 0. Work activities are also classified in the Tegner Activity Rating Scale. The maximum level for a work activity is 5 (e.g., a firefighter or a person in the military).
Recently, the Tegner Activity Rating Scale was evaluated and showed good validity and reliability in a group of patients with ACL injury.41 Test-retest reliability for these patients demonstrated an ICC of .82. Construct validity was demonstrated with an inverse correlation to pain, difficulty with running, difficulty with activities of daily living, difficulty working, difficulty with sports, and abnormal knee function. Responsiveness also was demonstrated post-ACL reconstruction, with an effect size of 1.0 or greater at 9, 12, and 24 months after surgery.41 Similar measurement properties were found in patients with meniscal tears.76 An effect size of 0.67 was found at 4 years following cartilage repair (Table 2).
Recently, a normal population was evaluated, and the median activity level was 6.40 In this study, it was shown that the activity level was lower among women and that it declined with age. Similar findings were shown in a study of soccer players where older age, female gender, and lower level of competition (football division) were independently associated with lower self-reported activity level, as measured by the Tegner Activity Rating Scale.71
Marx Activity Rating Scale
The Marx Activity Rating Scale was published in 2001 with the goal of standardizing activity level across various sports.77 It was developed with patient and expert clinician input using standard item generation and item reduction techniques78 and is composed of 4 questions that measure the frequency with which patients run, cut, decelerate, and pivot. The Marx Activity Rating Scale is scored from 0 (meaning patients do each of these activities less than once a month) to a maximum score of 16 (the patients run, cut, decelerate, and pivot 4 or more times a week for each of the 4 activities). It was found to be well correlated with the Tegner Activity Rating Scale and was inversely correlated with age.78 It has demonstrated responsiveness following cartilage repair (Table 2).
Statistical Issues
Patient-Reported Outcomes as Primary Endpoint
The methodologies for evaluating treatment effects on PROs do not differ principally from the methodologies used for evaluation of other treatment effects. Analysis methods are described in general in standard statistical textbooks, such as Altman.79 There are, however, some aspects that are especially important when the primary endpoint in a confirmatory randomized trial is a PRO, and these have been well described in international guidelines for trials performed as a basis for approval of new medicinal products.24,80,81 One important consideration is that the instrument used for measuring the outcome should be validated. Content validity (i.e., patient input into the relevant concepts for measurement), construct validity, reliability, responsiveness (i.e., effect size and the proportion of people who respond to the treatment by reaching an MCID), and interpretability should have been assessed previously for the studied condition and in the target population.
Single Subscale versus Overall Score
For PROs summarizing information from several subscales, the relation between subscales and overall score is often discussed. For example, can a subscale be used as a primary endpoint? The answer is yes, if the endpoint is defined a priori and the measurement instrument is validated for the particular subscale. Furthermore, if an overall score is used as an endpoint and an analysis of subscales shows that an improvement in overall score is caused by a change in a single subscale, the interpretation of the results of the overall score must take this into account.
Multiplicity
Another important issue that is related to the analysis of subscales is multiplicity of inference (e.g., from repeated testing). The concern is that if there is not proper accounting for multiplicity in the analysis, the chance of finding at least one false-positive statistical result will be higher than the nominal significance level, in some cases much higher. PROs that have multiple subscales as well as repeated measurement during follow-up increase concern about multiplicity issues.
The recommended method for addressing such multiplicity issues is hierarchical testing of endpoints—that is, the primary endpoint is tested first; if this is statistically significant, the secondary endpoint is tested, and so on. When an endpoint is statistically insignificant, no further endpoints are tested. The hierarchy of endpoints should of course be defined a priori and be described in the study protocol.
Other approaches exist, for example, correcting P values using the Bonferroni method. The disadvantage with these methods is that it reduces statistical power and therefore requires compensation in the calculation of sample size performed during the planning of the study.
Missing Values
A third consideration is missing values. Some patients may have missing values on 1 or more items of an overall score. It is then questionable if an overall score can be calculated. General rules for handling missing data should be determined during the development of a score and preferably be provided in a user’s guide. The statistical analysis plan should describe specific rules for handling missing observations of entire scores. Analyzing only patients with complete data, a complete case analysis, is problematic because this implies a selection of patients, creating potential selection bias.
Missing data are therefore often replaced by hypothetical ones, for example, by carrying the last observation forward (LOCF imputation). This is, again, problematic. LOCF imputation is not necessarily conservative. Using the recently developed multiple imputation method82 is clearly a better approach. Performing sensitivity analyses and investigating worst-case scenarios also are recommended because statistical methods used for handling missing data are typically based on the assumption of “missing at random.” Departures from this assumption can have serious consequences. The sensitivity of results to such departures can be investigated using statistical modeling, for example, with pattern mixture models and selection models.83
Study Populations
Statistical analyses of randomized trials usually include two study populations: the intention-to-treat (ITT) population, with treatment defined by randomization, and the per protocol (PP) population, having received treatment as described in the protocol. The two populations should ideally be identical but differ in practice because of protocol violations, noncompliance, loss to follow-up, and so on. Results from analyses of the ITT population can thus suffer from dilution bias, due to misclassified treatment, and analyses of the PP population from selection bias, but not vice versa.84 The credibility of a trial is strengthened when both study populations yield the same conclusion.
PROs are often used in trials comparing a surgical treatment with a nonsurgical intervention. In contrast to patients in blinded drug trials, patients in trials comparing surgical and nonsurgical trials know the treatment to which they have been randomized. The statistical analysis is complicated if patients randomized to nonsurgery have greater propensity for crossing over to surgery than those patients randomized to surgery crossing over to nonsurgery.85 Patients crossing over to surgery are namely in the analysis of the ITT population and handled as if they had a nonsurgical treatment. The results from the analysis of the ITT population then represent a comparison of one group of patients, having had either planned nonsurgery or unplanned surgery, with another group of patients having had planned surgery. This phenomenon may require special attention both when interpreting the results from the analysis of the ITT population and when comparing the results from the analyses of the ITT and PP populations.
Superiority versus Noninferiority
All trials are not performed to show that one treatment is superior to another. Some trials have the purpose of investigating whether one treatment is as good as another. It is sometimes suggested that statistical insignificance is an indication of noninferiority, but that is not correct. The approach is inappropriate because it is based on the misconception that statistical insignificance indicates evidence of absence, which it does not. It indicates absence of evidence—that is, the P value is only about the probability of a finding being false positive; it says nothing about the risk of falsely classifying a true-positive finding as negative.
That two treatments have similar effect (equivalence of treatments) is usually shown using a 95% confidence interval for the difference in treatment effect. If the confidence interval excludes all clinically significant differences, which of course have to be defined in advance, the two treatments are considered equivalent.
In many cases, it is considered more important to show noninferiority than equivalence. For example, a new treatment may cost less but have at least as good effect as an old one. It could then be relevant to show that the new treatment is at least not inferior to the old one. Evidence of noninferiority is usually evaluated using one-sided 97.5% confidence intervals. If such a confidence interval excludes all clinically significant treatment effect differences to the advantage of the old treatment, noninferiority of the new treatment is shown. Again, the definition of a clinically significant difference must be made in advance.
Sample Size Estimation for Studies of Cartilage Repair
The range of treatment effect differences regarded as clinically significant needs to be defined a priori and should be based on a combination of statistical reasoning and clinical judgment. The relevance of a change in a PRO should, in general, be justified. Development of a generally accepted MCID can facilitate the use of the score as a primary endpoint.
Sample size calculations are usually performed on the basis of a specified effect size, a relative effect measure, defined in terms of difference in mean score relative to a common standard deviation. The relation between effect size and sample size is described in Figure 1. In brief, investigating small effect sizes takes more participants than large ones.
When testing a specified effect size, two different instruments always require the same sample size, irrespective of what they measure. However, as the effect size is a relative measure, relative to the standard deviation, the standard deviation itself may vary with inclusion criteria and instruments. This should of course be reflected in the sample size calculation. Absolute score difference (and MCID) is, therefore, often the more appropriate criterion when designing a study and calculating sample size.
Retrospective power estimation (i.e., calculating power for an observed effect) is popular but theoretically problematic.86 It is far better to describe the statistical precision of an observation using confidence intervals.
Summary
The IKDC Subjective Knee Form and the KOOS both fulfill the basic requirements for reliability, validity, and responsiveness in cartilage repair patients. The major difference between the IKDC Subjective Knee Form and KOOS is that the former results in a single score, and the latter results in 5 subscores. A single score is preferred for simplicity’s sake, whereas subscores allow for evaluation of separate constructs at all levels according to the ICF. Because there is no obvious superiority of either the IKDC Subjective Knee Form or the KOOS at this time, both outcome measures are recommended for use in cartilage repair. Rescaling of the Lysholm Scoring Scale has been suggested, and confirmatory longitudinal studies are needed prior to recommending this scale for use in cartilage repair. Inclusion of a generic measure such as the SF-36, SF-12, or EQ-5D is feasible in cartilage repair studies and allows analysis of HRQOL and health economic outcomes. Evaluation of activity level in knee-injured patients seems possible using the Marx or Tegner Activity Rating Scales. However, adjustment for age and gender is needed, and data from cartilage repair patients are lacking. Effect size from previous studies with similar sample sizes can be used for sample size calculations to design clinical trials with sufficient power to detect clinically important differences from treatments studied.
Footnotes
Funding: The authors received no financial support for the research and/or authorship of this article.
Declaration of Conflicting Interests: The authors declared no potential conflicts of interests with respect to the authorship and/or publication of this article.
References
- 1. Nunnally JC. Psychometric theory. 2nd ed. New York: McGraw-Hill; 1978. [Google Scholar]
- 2. Kreuz PC, Muller S, Ossendorf C, Kaps C, Erggelet C. Treatment of focal degenerative cartilage defects with polymer-based autologous chondrocyte grafts: four-year clinical results. Arthritis Res Ther. 2009;11(2):R33. [DOI] [PMC free article] [PubMed] [Google Scholar]
- 3. Greco NJ, Anderson AF, Mann BJ, Cole BJ, Farr J, Nissen CW, et al. Responsiveness of the International Knee Documentation Committee Subjective Knee Form in comparison to the Western Ontario and McMaster Universities Osteoarthritis Index, modified Cincinnati Knee Rating System, and Short Form 36 in patients with focal articular cartilage defects. Am J Sports Med. 2010;38(5):891-902. [DOI] [PubMed] [Google Scholar]
- 4. World Health Organization (WHO). International classification of functioning, disability and health. Geneva, Switzerland: WHO; 2001. [Google Scholar]
- 5. Lord FM. Applications of item response theory to practical testing problems. Hillsdale, NJ: Lawrence Erlbaum; 1980. [Google Scholar]
- 6. Rasch G. Probablistic model for some intelligence and attainment tests. Reprinted ed. Chicago: University of Chicago Press; 1960. [Google Scholar]
- 7. Landis JR, Koch GG. The measurement of observer agreement for categorical data. Biometrics. 1977;33(1):159-74. [PubMed] [Google Scholar]
- 8. Terwee CB, Dekker FW, Wiersinga WM, Prummel MF, Bossuyt PM. On assessing responsiveness of health-related quality of life instruments: guidelines for instrument evaluation. Qual Life Res. 2003;12(4):349-62. [DOI] [PubMed] [Google Scholar]
- 9. Fleiss JL. The design and analysis of clinical experiments. New York: John Wiley; 1986. [Google Scholar]
- 10. Beaton DE. Understanding the relevance of measured change through studies of responsiveness. Spine (Phila Pa 1976). 2000;25(24):3192-9. [DOI] [PubMed] [Google Scholar]
- 11. Lassere MN, van der Heijde D, Johnson K, Bruynesteyn K, Molenaar E, Boonen A, et al. Robustness and generalizability of smallest detectable difference in radiological progression. J Rheumatol. 2001;28(4):911-3. [PubMed] [Google Scholar]
- 12. Stratford PW, Binkley J, Solomon P, Finch E, Gill C, Moreland J. Defining the minimum level of detectable change for the Roland-Morris questionnaire. Phys Ther. 1996;76(4):359-65; discussion 366-8. [DOI] [PubMed] [Google Scholar]
- 13. Stratford PW, Binkley JM. Applying the results of self-report measures to individual patients: an example using the Roland-Morris Questionnaire. J Orthop Sports Phys Ther. 1999;29(4):232-9. [DOI] [PubMed] [Google Scholar]
- 14. Streiner DL, Norman GR. Health measurement scales: a practical guide to their development and use. 4th ed. Oxford, UK: Oxford University Press; 2008. [Google Scholar]
- 15. Hambly K, Griva K. IKDC or KOOS? Which measures symptoms and disabilities most important to postoperative articular cartilage repair patients? Am J Sports Med. 2008;36(9):1695-704. [DOI] [PubMed] [Google Scholar]
- 16. Comins J, Brodersen J, Krogsgaard M, Beyer N. Rasch analysis of the Knee Injury and Osteoarthritis Outcome Score (KOOS): a statistical re-evaluation. Scand J Med Sci Sports. 2008;18(3):336-45. [DOI] [PubMed] [Google Scholar]
- 17. Cohen J. Statistical power analysis for the behavioral sciences. 2nd ed. Hillsdale, NJ: Lawrence Erlbaum; 1988. [Google Scholar]
- 18. Kazis LE, Anderson JJ, Meenan RF. Effect sizes for interpreting changes in health status. Med Care. 1989;27(3 Suppl):S178-89. [DOI] [PubMed] [Google Scholar]
- 19. Liang MH, Fossel AH, Larson MG. Comparisons of five health status instruments for orthopedic evaluation. Med Care. 1990;28(7):632-42. [DOI] [PubMed] [Google Scholar]
- 20. Bekkers JE, de Windt TS, Raijmakers NJ, Dhert WJ, Saris DB. Validation of the Knee Injury and Osteoarthritis Outcome Score (KOOS) for the treatment of focal cartilage lesions. Osteoarthritis Cartilage. 2009;17(11):1434-9. [DOI] [PubMed] [Google Scholar]
- 21. Jaeschke R, Singer J, Guyatt GH. Measurement of health status: ascertaining the minimal clinically important difference. Control Clin Trials. 1989;10(4):407-15. [DOI] [PubMed] [Google Scholar]
- 22. Juniper EF, Guyatt GH, Willan A, Griffith LE. Determining a minimal important change in a disease-specific quality of life questionnaire. J Clin Epidemiol. 1994;47(1):81-7. [DOI] [PubMed] [Google Scholar]
- 23. Tubach F, Ravaud P, Beaton D, Boers M, Bombardier C, Felson DT, et al. Minimal clinically important improvement and patient acceptable symptom state for subjective outcome measures in rheumatic disorders. J Rheumatol. 2007;34(5):1188-93. [PMC free article] [PubMed] [Google Scholar]
- 24. Food and Drug Administration. Guidance on patient reported outcomes in clinical research [cited June 2, 2010]. http://www.invivodata.com/epro-resources/fda-draft-guidance—patient-reported-outcomes-pro/?gclid=CI648dS1_6ECFY9M5Qod51jdDg
- 25. Irrgang JJ, Anderson AF, Boland AL, et al. Development and validation of the International Knee Documentation Committee Subjective Knee Form. Am J Sports Med. 2001;29(5):600-13. [DOI] [PubMed] [Google Scholar]
- 26. Food and Drug Administration. Guidance for industry preparation of IDEs and INDs for products intended to repair or replace knee cartilage [cited June 7, 2010]. http://www.fda.gov/downloads/BiologicsBloodVaccines/GuidanceComplianceRegulatoryInformation/Guidances/CellularandGeneTherapy/ucm078710.pdf
- 27. Irrgang JJ, Anderson AF, Boland AL, et al. Responsiveness of the International Knee Documentation Committee Subjective Knee Form. Am J Sports Med. 2006;34(10):1567-73. [DOI] [PubMed] [Google Scholar]
- 28. Anderson AA, Irrgang JJ, Kocher MS, Mann BJ, Harrast JJ; International Knee Documentation Committee. The International Knee Documentation Committee Subjective Knee Evaluation Form: normative data. Am J Sports Med. 2006;34(1):128-35. [DOI] [PubMed] [Google Scholar]
- 29. Iversen MD, Lee B, Connell P, Andersen J, Anderson AF, Kocher MS. Validity and comprehensibility of the International Knee Documentation Committee Subjective Knee Evaluation form in children. Scand J Med Sci Sports. 2010;20(1):e87-95. [DOI] [PubMed] [Google Scholar]
- 30. Tanner SM, Dainty KN, Marx RG, Kirkley A. Knee-specific quality-of-life instruments: which ones measure symptoms and disabilities most important to patients? Am J Sports Med. 2007;35(9):1450-8. [DOI] [PubMed] [Google Scholar]
- 31. Roos EM, Roos HP, Lohmander LS, Ekdahl C, Beynnon BD. Knee Injury and Osteoarthritis Outcome Score (KOOS): development of a self-administered outcome measure. J Orthop Sports Phys Ther. 1998;28(2):88-96. [DOI] [PubMed] [Google Scholar]
- 32. Roos EM, Roos HP, Ekdahl C, Lohmander LS. Knee injury and Osteoarthritis Outcome Score (KOOS): validation of a Swedish version. Scand J Med Sci Sports. 1998;8(6):439-48. [DOI] [PubMed] [Google Scholar]
- 33. Roos EM, Toksvig-Larsen S. Knee Injury and Osteoarthritis Outcome Score (KOOS): validation and comparison to the WOMAC in total knee replacement. Health Qual Life Outcomes. 2003;1:17. [DOI] [PMC free article] [PubMed] [Google Scholar]
- 34. Granan LP, Bahr R, Steindal K, Furnes O, Engebretsen L. Development of a national cruciate ligament surgery registry: the Norwegian National Knee Ligament Registry. Am J Sports Med. 2008;36(2):308-15. [DOI] [PubMed] [Google Scholar]
- 35. Paradowski PT, Bergman S, Sunden-Lundius A, Lohmander LS, Roos EM. Knee complaints vary with age and gender in the adult population: population-based reference data for the Knee Injury and Osteoarthritis Outcome Score (KOOS). BMC Musculoskelet Disord. 2006;7:38. [DOI] [PMC free article] [PubMed] [Google Scholar]
- 36. Ageberg E, Forssblad M, Herbertsson P, Roos EM. Sex differences in patient-reported outcomes after anterior cruciate ligament reconstruction: data from the Swedish Knee Ligament Register. Am J Sports Med. 2010;38(7):1334-42. [DOI] [PubMed] [Google Scholar]
- 37. Lind M, Menhert F, Pedersen AB. The first results from the Danish ACL reconstruction registry: epidemiologic and 2 year follow-up results from 5,818 knee ligament reconstructions. Knee Surg Sports Traumatol Arthrosc. 2009;17(2):117-24. [DOI] [PubMed] [Google Scholar]
- 38. Roos EM, Lohmander LS. Knee Injury and Osteoarthritis Outcome Score (KOOS): from joint injury to osteoarthritis. Health Qual Life Outcomes. 2003;1:64. [DOI] [PMC free article] [PubMed] [Google Scholar]
- 39. Tegner Y, Lysholm J. Rating systems in the evaluation of knee ligament injuries. Clin Orthop Relat Res. 1985;198:43-9. [PubMed] [Google Scholar]
- 40. Briggs KK, Steadman JR, Hay CJ, Hines SL. Lysholm score and Tegner activity level in individuals with normal knees. Am J Sports Med. 2009;37(5):898-901. [DOI] [PubMed] [Google Scholar]
- 41. Briggs KK, Lysholm J, Tegner Y, Rodkey WG, Kocher MS, Steadman JR. The reliability, validity, and responsiveness of the Lysholm score and Tegner activity scale for anterior cruciate ligament injuries of the knee: 25 years later. Am J Sports Med. 2009;37(5):890-7. [DOI] [PubMed] [Google Scholar]
- 42. Smith HJ, Richardson JB, Tennant A. Modification and validation of the Lysholm Knee Scale to assess articular cartilage damage. Osteoarthritis Cartilage. 2009;17(1):53-8. [DOI] [PubMed] [Google Scholar]
- 43. Kocher MS, Steadman JR, Briggs KK, Sterett WI, Hawkins RJ. Reliability, validity, and responsiveness of the Lysholm Knee Scale for various chondral disorders of the knee. J Bone Joint Surg Am. 2004;86A(6):1139-45. [DOI] [PubMed] [Google Scholar]
- 44. Minas T, Gomoll AH, Solhpour S, Rosenberger R, Probst C, Bryant T. Autologous chondrocyte implantation for joint preservation in patients with early osteoarthritis. Clin Orthop Relat Res. 2010;468(1):147-57. [DOI] [PMC free article] [PubMed] [Google Scholar]
- 45. Rabenda V, Burlet N, Ethgen O, Raeman F, Belaiche J, Reginster JY. A naturalistic study of the determinants of health related quality of life improvement in osteoarthritic patients treated with non-specific non-steroidal anti-inflammatory drugs. Ann Rheum Dis. 2005;64(5):688-93. [DOI] [PMC free article] [PubMed] [Google Scholar]
- 46. De Bock GH, Kaptein AA, Touw-Otten F, Mulder J. Health-related quality of life in patients with osteoarthritis in a family practice setting. Arthritis Care Res. 1995;8:88-93. [DOI] [PubMed] [Google Scholar]
- 47. Dexter P, Brandt K. Distribution and predictors of depressive symptoms in osteoarthritis. J Rheumatol. 1994;21:279-86. [PubMed] [Google Scholar]
- 48. McHorney CA, Ware JEJ, Lu JF, Sherbourne CD. The MOS 36-item Short-Form Health Survey (SF-36): III. Tests of data quality, scaling assumptions, and reliability across diverse patient groups. Med Care. 1994;32(1):40-66. [DOI] [PubMed] [Google Scholar]
- 49. McHorney CA, Ware JEJ, Raczek AE. The MOS 36-item Short-Form Health Survey (SF-36): II. Psychometric and clinical tests of validity in measuring physical and mental health constructs. Med Care. 1993;31(3):247-63. [DOI] [PubMed] [Google Scholar]
- 50. Ware JEJ, Sherbourne CD. The MOS 36-item Short-Form Health Survey (SF-36): I. Conceptual framework and item selection. Med Care. 1992;30(6):473-83. [PubMed] [Google Scholar]
- 51. Kosinski M, Keller SD, Hatoum HT, Kong SX, Ware JE. The SF-36 Health Survey as a generic outcome measure in clinical trials of patients with osteoarthritis and rheumatoid arthritis: tests of data quality, scaling assumptions and score reliability. Med Care. 1999;37(5 Suppl):MS10-22. [DOI] [PubMed] [Google Scholar]
- 52. Kosinski M, Keller S-D, Ware JEJ, Hatoum HT, Kong SX. The SF-36 Health Survey as a generic outcome measure in clinical trials of patients with osteoarthritis and rheumatoid arthritis: relative validity of scales in relation to clinical measures of arthritis severity. Med Care. 1999;37(5 Suppl):MS23-39. [DOI] [PubMed] [Google Scholar]
- 53. Brazier J, Roberts J, Deverill M. The estimation of a preference-based measure of health from the SF-36. J Health Econ. 2002;20:271-92. [DOI] [PubMed] [Google Scholar]
- 54. Knutsen G, Drogset JO, Engebretsen L, Grontvedt T, Isaksen V, Ludvigsen TC, et al. A randomized trial comparing autologous chondrocyte implantation with microfracture: findings at five years. J Bone Joint Surg Am. 2007;89:2105-12. [DOI] [PubMed] [Google Scholar]
- 55. Mithoefer K, Williams RJ, Warren RF, Potter HG, Spock CR, Jones EC, et al. The microfracture technique for the treatment of articular cartilage lesions in the knee: a prospective cohort study. J Bone Joint Surg Am. 2005;87:1911-20. [DOI] [PubMed] [Google Scholar]
- 56. Ossendorf C, Kaps C, Kreuz PC, Burmester GR, Sittinger M, Erggelet C. Treatment of posttraumatic and focal osteoarthritic cartilage defects of the knee with autologous polymer-based three-dimensional chondrocyte grafts: 2-year clinical results. Arthritis Res Ther. 2007;9(2):R41. [DOI] [PMC free article] [PubMed] [Google Scholar]
- 57. Zaslav K, Cole B, Brewster R, DeBerardino T, Farr J, Fowler P, et al. A prospective study of autologous chondrocyte implantation in patients with failed prior treatment for articular cartilage defect of the knee. Am J Sports Med. 2009;37(1):42-55. [DOI] [PubMed] [Google Scholar]
- 58. Ware JEJ, Kosinski M, Keller SD. A 12-Item Short-Form Health Survey: construction of scales and preliminary tests of reliability and validity. Med Care. 1996;34:220-33. [DOI] [PubMed] [Google Scholar]
- 59. Brazier J, Roberts J. The estimation of a preference-based measure of health from the SF-12. Med Care. 2004;42(9):851-9. [DOI] [PubMed] [Google Scholar]
- 60. McNickle AG, L’Heureux DR, Yanke AB, Cole BJ. Outcomes of autologous chondrocyte implantation in a diverse patient population. Am J Sports Med. 2009;37(7):1344-50. [DOI] [PubMed] [Google Scholar]
- 61. Cole BJ, Dennis MG, Lee SJ, Nho SJ, Kalsi RS, Hayden JK, et al. Prospective evaluation of allograft meniscus transplantation: a minimum 2-year follow-up. Am J Sports Med. 2006;34(6):919-27. [DOI] [PubMed] [Google Scholar]
- 62. Marzieres B, Hucher M, Zaim M, Garnero P. Effect of chondroitin sulphate in symptomatic knee osteoarthritis: a multicenter, randomized, double-blind, placebo-controlled study. Ann Rheum Dis. 2007;66(5):639-45. [DOI] [PMC free article] [PubMed] [Google Scholar]
- 63. Brooks R. EuroQoL: the current state of play. Health Policy. 1996;37(1):53-72. [DOI] [PubMed] [Google Scholar]
- 64. Rabin R, de Charro F. EQ-5D: a measure of health status from the EuroQol Group. Ann Med. 2001;33(5):337-43. [DOI] [PubMed] [Google Scholar]
- 65. Gobbi A, Kon E, Berruto M, Francisco R, Filardo G, Marcacci M. Patellofemoral full-thickness chondral defects treated with Hyalograft-C: a clinical, arthroscopic, and histologic review. Am J Sports Med. 2006;34(11):1763-73. [DOI] [PubMed] [Google Scholar]
- 66. Marcacci M, Berruto M, Brocchetta D, Delcogliano A, Ghinelli D, Gobbi A, et al. Articular cartilage engineering with Hyalogrft C: 3-year clinical results. Clin Orthop Relat Res. 2005;435:96-105. [DOI] [PubMed] [Google Scholar]
- 67. Raman R, Dutta A, Day N, Sharma HK, Shaw CJ, Johnson GV. Efficacy of Hylan G-F 20 and sodium hyaluronate in the treatment of osteoarthritis of the knee: a prospective randomized clinical trial. Knee. 2008;15(4):318-24. [DOI] [PubMed] [Google Scholar]
- 68. Analysis of comparative effectiveness. 2009. [cited May 26, 2010]. http://www.randcompare.org/analysis-of-options/analysis-of-comparative-effectiveness
- 69. Kristensen FB, Makela M, Neikter SA, Rehnqvist N, Haheim LL, Morland B, et al. European network for health technology assessment, EUnetHTA: planning, development, and implementation of a sustainable European network for health technology assessment. Int J Technol Assess Health Care. 2009;25(Suppl 2):107-16. [DOI] [PubMed] [Google Scholar]
- 70. Schoen C, Guterman S, Shih A. Bending the curve: options for achieving savings and improving value in U.S. health spending. 2007. [cited May 26, 2010]. http://www.commonwealthfund.org/usr_doc/Schoen_bendingthecurve_1080.pdf
- 71. Frobell RB, Svensson E, Gothrick M, Roos EM. Self-reported activity level and knee function in amateur football players: the influence of age, gender, history of knee injury and level of competition. Knee Surg Sports Traumatol Arthrosc. 2008;16(7):713-9. [DOI] [PubMed] [Google Scholar]
- 72. Fuchs S, Tibesku CO, Frisse D, Genkinger M, Laass H, Rosenbaum D. Clinical and functional comparison of uni- and bicondylar sledge prostheses. Knee Surg Sports Traumatol Arthrosc. 2005;13(3):197-202. [DOI] [PubMed] [Google Scholar]
- 73. Nagel A, Insall JN, Scuderi GR. Proximal tibial osteotomy: a subjective outcome study. J Bone Joint Surg Am. 1996;78(9):1353-8. [DOI] [PubMed] [Google Scholar]
- 74. Fruensgaard S, Helmig P, Riis J, Stovring JO. Conservative treatment for acute rupture of the Achilles tendon. Int Orthop. 1992;16(1):33-5. [DOI] [PubMed] [Google Scholar]
- 75. Krips R, van Dijk CN, Lehtonen H, Halasi T, Moyen B, Karlsson J. Sports activity level after surgical treatment for chronic anterolateral ankle instability: a multicenter study. Am J Sports Med. 2002;30(1):13-9. [DOI] [PubMed] [Google Scholar]
- 76. Briggs KK, Kocher MS, Rodkey WG, Steadman JR. Reliability, validity, and responsiveness of the Lysholm knee score and Tegner activity scale for patients with meniscal injury of the knee. J Bone Joint Surg Am. 2006;88(4):698-705. [DOI] [PubMed] [Google Scholar]
- 77. Marx RG. Evaluating outcome following cartilage procedures. In: Williams RJ, editor. Cartilage repair strategies. Totowa, NJ: Humana; 2007. p. 13-7. [Google Scholar]
- 78. Marx RG, Stump TJ, Jones EC, Warren RF, Wickiewicz TL. Development and evaluation of an activity rating scale for disorders of the knee. Am J Sports Med. 2001;29(2):213-8. [DOI] [PubMed] [Google Scholar]
- 79. Altman DG. Practical statistics for medical research. New York: Chapman & Hall; 1991. [Google Scholar]
- 80. Committee for Medicinal Products for Human Use (CHMP). Reflection paper on the regulatory guidance for the use of health-related quality of life (HRQL) measures in the evaluation of medicinal products. London: CHMP; 2005. [Google Scholar]
- 81. Committee for Proprietary Medicinal Products (CPMP). Points to consider on multiplicity issues in clinical trials. London: CPMP; 2002. [Google Scholar]
- 82. Little RJA, Rubin DB. Statistical analysis with missing data. New York: John Wiley; 1987. [Google Scholar]
- 83. Diggle PJ. Dealing with missing data in longitudinal studies. In: Everitt BS, Dunn G, editors. Advances in the statistical analysis of medical data. London: Arnold; 1998. p. 203-28. [Google Scholar]
- 84. Bubbar VK, Kreder HJ. The intention-to-treat principle: a primer for the orthopaedic surgeon. J Bone Joint Surg Am. 2006;88(9):2097-9. [DOI] [PubMed] [Google Scholar]
- 85. Herman A, Botser IB, Tenenbaum S, Chechick A. Intention-to-treat analysis and accounting for missing data in orthopaedic randomized clinical trials. J Bone Joint Surg Am. 2009;91(9):2137-43. [DOI] [PubMed] [Google Scholar]
- 86. Hoenig JM, Heisey DM. The abuse of power: the pervasive fallacy of power calculations in data analysis. Am Stat. 2001; 55:9-24. [Google Scholar]
- 87. Robertson WB, Fick D, Wood DJ, Linklater JM, Zheng MH, Ackland TR. MRI and clinical evaluation of collagen-covered autologous chondrocyte implantation (CACI) at two years. Knee. 2007. March;14(2):117-27. Epub 2007 Jan 25. PubMed PMID: 17257849. [DOI] [PubMed] [Google Scholar]
- 88. Knutsen G, Drogset JO, Engebretsen L, Grontvedt T, Isaksen V, Ludvigsen TC, et al. A randomized trial comparing autologous chondrocyte implantation with microfracture, findings at five years. J Bone Joint Surg Am. 2007;89:2105-12. [DOI] [PubMed] [Google Scholar]