

Abstract
Large-scale comparisons of patients and healthy controls have unearthed genetic risk factors associated with a range of neurological and psychiatric illnesses. Meanwhile, brain imaging studies are increasing in size and scope, revealing disease and genetic effects on brain structure and function, and implicating neural pathways and causal mechanisms. With the advent of global neuroimaging consortia, imaging studies are now well powered to discover genetic variants that reliably affect the brain. Genetic analyses of brain measures from tens of thousands of people are being extended to test genetic associations with signals at millions of locations in the brain. Connectome-wide, genome-wide scans can jointly screen brain circuits and genomes, presenting new statistical challenges. There is a growing need for the community to establish and enforce standards in this developing field to ensure robust findings. Here we discuss how neuroimagers and geneticists have formed alliances to discover how genetic factors affect the brain. The field is rapidly advancing with ultra-high-resolution imaging and whole-genome sequencing. We recommend a rigorous approach to neuroimaging genomics that capitalizes on its recent successes and ensures the reliability of future discoveries.
Worldwide consortia offer new opportunities for discovery in neuroscience, vastly expanding the scale of brain imaging and genomics studies. The higher power to discover genetic factors associated with brain differences has led to key insights in neurology and psychiatry and helped us understand genetic pathways that shape the brain. Genes that contribute to mental illness and individual brain differences are now being reliably detected, mapped and quantified.
Large-scale genetic studies are uncovering many common genetic variants associated with Alzheimer’s disease1, schizophrenia2 and many other disorders. These new discoveries often arise from genome-wide association studies (GWAS), which compare large samples of patients with healthy controls to detect differences in allele frequencies (or regress continuous traits on the number of risk alleles) at genetic markers across the genome.
What is perhaps less well known is that genomic screening efforts are also occurring in the brain imaging community. In the largest brain imaging studies yet performed, two large consortia, Enhancing Neuroimaging Genetics through Meta-Analysis (ENIGMA) and the Cohorts for Heart and Aging Research in Genomic Epidemiology (CHARGE), recently amassed brain magnetic resonance imaging (MRI) scans and genome-wide data from 21,151 individuals3,4. These worldwide consortium efforts have increased the power to identify genetic variations that influence brain structure and function. The combined sample sizes are not unusual in genetics, but in neuroimaging they are vast. Neuroimaging and genotyping of large cohorts can be costly. However, consortium models draw on repositories of existing data, fueling collaborations and combining the expertise of scientists from around the world.
Twenty years of data collection in neuroimaging have led to rich and diverse data sets for genetic analysis. In particular, GWAS of neuroimaging measures can localize across the genome genetic effects on the brain, offering new information on how variants promote disease risk. Here we review some opportunities that arise when analyzing genomes and brain images, including new statistical methods. As images and genomic data are collected at ever higher resolutions, data analyses now draw on large branches of work in mathematics, signal processing, informatics and basic neuroscience.
GWAS of imaging
For common neurological diseases, a few common genetic variants of large effect have been identified. Similarly, few copy number variants of large effect have been identified, but only a few common genetic risk factors, individually, substantially affect disease risk. The best-known may be apolipoprotein E4 (ApoE4), which was discovered using a biologically informed approach5. Each copy of the E4 haplotype in the APOE gene boosts Alzheimer’s disease risk by a factor of 3 or more; APOE explains around 6% of Alzheimer’s disease risk. From an imaging perspective, ApoE4 carriers lose brain tissue faster as they age. As young adults, carriers have thinner cortical gray matter than noncarriers6. The first GWAS studies of brain images searched for associations between common variants and volumes of key brain regions, such as the hippocampus, and were well powered to detect the effects of APOE (ref. 7).
In large-scale GWAS meta-analyses, variants with large effects are exceptional; when found, they tend to be associated with later-onset diseases. The single nucleotide polymorphism (SNP) with the strongest evidence for association in the ENIGMA-CHARGE study3 explained around 0.27% of the variance in hippocampal volume, although the differences between carriers and noncarriers had an effect comparable to that of several years of brain aging. In a related study of the overall volume of the brain, carriers of an HMGA2 allele averaged 9 ml larger brain volumes per allele.
Despite expectations that brain images might be more sensitive than clinical phenotypes to genetic effects, experience has indicated that, as with other complex traits, large sample sizes are needed to discover genetic variants that influence the brain. Significantly associated SNPs have an expected effect size <0.5% of the phenotypic variance8 in quantitative traits, even for measures extracted from images. Work so far by imaging consortia such as ENIGMA and CHARGE suggests that the distribution of effect sizes for brain measures is similar to that seen when studying other quantitative traits, although only the simplest brain measures have so far been assessed with GWAS.
Even so, imaging studies can provide information not available in genetic comparisons of patients and controls. Imaging can identify potential mechanisms and circuits promoting disease risk, making it easier to develop and evaluate treatments. A more mechanistic understanding should make it easier to discover disease-modifying factors.
For logistic reasons, the largest collaborative analyses of brain images have so far focused on simple measures such as regional volumes. Efforts are underway to examine whether larger gene effects may be found with diffusion tensor imaging (DTI) and functional MRI; a parallel effort (see below) seeks to prioritize brain measures and define new features to make genetic studies more efficient. Global harmonization efforts are underway to derive measures from MRI9–11, DTI12 and electroencephalography (EEG) scans in a consistent way, making it easier to integrate data from studies initially designed with different goals. Global collaborations are also using meta-analysis to combine evidence from many cohorts, to discover the genetic variants that influence the brain13.
Large-scale brain imaging consortia
Some major imaging consortia have published GWAS studies (Table 1). Sample sizes are difficult to estimate and are increasing over time, as many studies are still enrolling participants. Published papers lag ongoing work: for instance, as of April 2014, collaborative work by ENIGMA and CHARGE has amassed MRI and GWAS data from 29,000 participants, but the largest published studies (from 2012) have around 11,000 participants per consortium and around 21,000 in aggregate3. Several new initiatives are planned (for example, the UK Biobank) that assess more cohorts with large-scale scanning and genotyping, offering ever-increasing power for genetic studies.
Table 1.
Imaging consortia that have published GWAS
| Name of imaging consortium, URL |
Sample size* |
Goal | Representative papers |
|---|---|---|---|
| ENIGMA (http://enigma.ini.usc.edu/) |
13,171 (unpublis heddata); ~29,000 with CHARGE and replication cohorts |
Genetic analysis of brain MRI, DTI, EEG and other brain measures, in cohorts across the lifespan; working groups on major brain diseases, including schizophrenia, bipolar illness, major depression and attention deficit–hyperactivity disorder |
Stein et al. 2012 (ref. 3) Jahanshad et al. 2013 (ref. 12) Thompson et al. 2014 (ref. 13) Hibar et al. 2013 (ref. 11) Hibar et al. (unpublished data) |
| CHARGE (http://web.chargeconsortium.com/); includes several large cohorts, for example, the Framingham Heart study, the Rotterdam Study, the Icelandic AGES study, Atherosclerosis Risk in Communities (ARIC) and the Cardiovascular Health Study (CHS) |
~29,000 when combined with ENIGMA in (unpubli shed data) |
Genetic analysis of neuroimaging and cardiovascular health data, including stroke |
Bis et al. 2012 (ref. 4) Ikram et al. 2012 (ref. 64) Psaty et al. 2009 (ref. 65) |
| ADNI (http://adni.loni.usc.edu/) and related worldwide initiatives |
~800 in phase 1 (ADNI1); ~850 additional participants in ADNI- GO and ADNI2 |
Longitudinal study of MRI, PET and CSF and plasma biomarkers from elderly people at ~50 North American sites; includes people with mild cognitive impairment and Alzheimer’s disease |
Weiner et al. 2012 (ref. 14) Shen et al. 2013 (ref. 39) |
| IMAGEN (http://www.imagen-europe.com/) |
2,223 14- year-old children across Europe (in Pallière Martinot et al. 2013 (ref. 21)) |
European Research Project studying biological and environmental factors affecting mental health in adolescence |
Nymberg et al. 2012 (ref.66) Pallière Martinot et al. 2013 (ref. 67) |
| PING (http://www.chd.ucsd.edu/research/ping-study.html) |
1,400 children, aged 3–20 years |
Studies of the genetic basis of individual differences in brain structure and connectivity, cognition, and personality |
Eicher et al. 2013 (ref. 68) |
| IMAGEMEND (http://www.imagemend.eu/) |
13,000 participants |
Primarily European study, focusing on schizophrenia, bipolar disorder and attention deficit– hyperactivity disorder |
Project began October 2013 |
| fBIRN (http://www.birncommunity.org/) |
300 | Functional and structural imaging study of schizophrenia patients in the United States |
Potkin and Ford 2009 (ref. 69) |
Many neuroimaging consortia were formed with goals other than genetic analysis (for example, to study disease effects on the brain), so here we focus on studies that have published GWAS of brain images. Some multisite consortia, such as IMAGEN, publish their own studies but also take part in larger consortia such as ENIGMA. ENIGMA also conducts studies of nine major brain diseases for which GWAS data is not necessary, so those numbers are not included here.
Sample sizes are estimates as of April 2014. ENIGMA, Enhancing Neuroimaging Genetics through Meta-Analysis; CHARGE, Cohorts for Heart and Aging in Genomic Epidemiology; ADNI: Alzheimer’s Disease Neuroimaging Initiative; IMAGEN, Imaging Genetics; PING, Pediatric Imaging, Neurocognition, and Genetics Study; IMAGEMEND, Imaging Genetics For Mental Disorders; fBIRN: Functional Bioinformatics Research Network. In addition to the North American ADNI14, large-scale projects on the neuroimaging of Alzheimer’s disease are underway in Europe, Japan, Australia, Korea, Taiwan and Argentina, with a new program in China and a planned program in Brazil15.
One issue sometimes raised, when analyzing polygenic traits, is the fallacy of classical inference. Put simply, this means that, with a sufficient number of subjects, one will inevitably declare trivial effect sizes to be significant. While the effect sizes identified by GWAS are typically small, this does not indicate that the importance of the gene on the development of a trait or its effectiveness as a potential treatment target is trivial. For example, in studies of type 2 diabetes and cardiovascular diseases, the effect sizes of loci that are drug targets are small (<1% of the variation in disease risk), but the drugs themselves can be highly effective16-18. Thus, the effect size of a specific allele does not necessarily reflect the potential contribution of the gene to a trait.
Data harmonization
To amass the largest possible sample, data from different genotyping chips are typically prepared using standardized quality control procedures and then imputed using publicly available references from the HapMap (http://www.hapmap.org/) or the 1000 Genomes Project (http://www.1000genomes.org/). On the imaging side, automated algorithms can yield consistent measures from brain scans. For structural MRI, software packages such as FreeSurfer and FSL have been validated and widely used. For the main brain structures, these automated techniques give reproducible measures when a person is scanned repeatedly over time or on different scanners19. Further quality checks are possible when deriving measures from a large number of brain scans, such as spotting outliers from the distribution of values and their standard errors. Even so, genetic analyses have typically been more successful for the larger brain structures that tend to be measured more reliably.
Searching maps of the brain
A typical brain image—mapping brain activation with functional MRI, for example, or white matter microstructure with diffusion-weighted MRI—may have upwards of 2 million three-dimensional data points, or voxels (Fig. 1a). Statistical parametric maps have long been used by imagers to pinpoint regions where activation relates to behavior or to cognitive tasks performed in a scanner.
Figure 1.
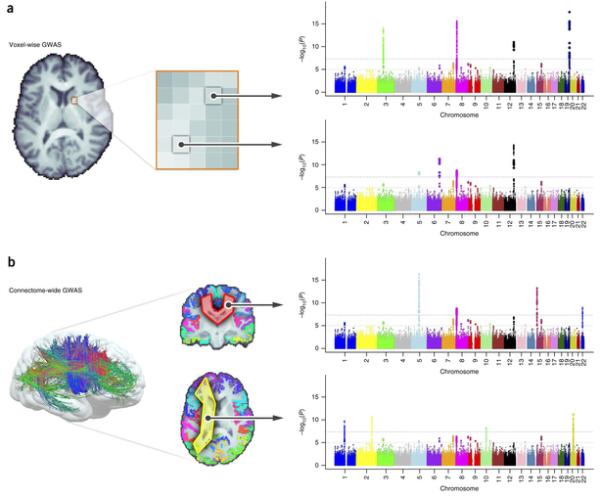
(a) Voxel-wise genetic association analysis. This kind of analysis involves a genome-wide search at each voxel in the brain, after aligning all subjects’ images to a common template. (b) Extending this method to study brain connections, Jahanshad et al.30 described connectome-wide searches. They combined diffusion-based MRI tractography and cortical parcellations to perform GWAS at all connections between cortical regions of interest. Artificial Manhattan plots are illustrated here, with thresholds shown based on a single GWAS. Despite the vast number of tests, promising findings emerged, even after correction, from these whole-connectome genetic screens.
Voxel-wise, genome-wide scans, or vGWAS20, extend this idea. They search the image, examining evidence for associations across the genome at each voxel in the image. Depending on the resolution adopted, vGWAS methods can aim to find genetic variants influencing up to 2 million locations in the brain. The sheer number of statistical tests requires sufficient computational power, as well as analytical rigor to avoid reporting false positive findings.
As a proof of principle, Stein et al.20 screened 31,622 voxels and 448,293 SNPs to search for genetic variants related to regional brain volumes in around 700 participants scanned as part of the Alzheimer’s Disease Neuroimaging Initiative (ADNI; http://adni.loni.usc.edu/). This initial study was underpowered, but later refinements focused on gene-based or pathway analyses and detected genetic effects that replicated across independent cohorts21.
Maps of brain circuitry can be screened as well (Fig. 1b). There is a wide range of methods to find fiber tracts in images, and we can extend the search to identify genetic effects on fiber bundles, one bundle at a time and one genetic variant at a time. In the first successful genome-wide screen of the human connectome, Jahanshad et al.22 analyzed brain connections traced using tractography methods and found that a variant in the gene SPON1 influenced brain connectivity in vivo. This gene’s protein product is a key factor in the processing and cleavage of amyloid-β precursor protein, APP—a key pathological hallmark of Alzheimer’s disease. This finding linked risk for neurodegeneration in old age with brain integrity in young adulthood, around 50 years before Alzheimer’s disease typically hits. Only a few weeks later, the same gene (though a different variant) was implicated in an independent study of cognitive decline23.
Biological interpretation of GWAS results
After identifying significant genetic effects, further work is needed to understand their biological mechanism and functional or behavioral significance. With a couple of notable exceptions (APOE and possibly a newly discovered Alzheimer’s disease-associated variant in TREM224,25,), individual SNPs account for, at most, 1% of the variance in imaging features tested so far. This effect size is comparable to that of SNPs affecting cognitive measures or psychiatric diagnosis. As with other GWAS, many imaging genetics studies follow up their top statistical findings with functional evaluations of the top SNPs.
SNPs implicated in a GWAS may affect gene expression, disease susceptibility or behavior—or they may have no detectable effects on any of these. Collaborative partnerships between genetics consortia in psychiatry or neurology (such as PGC or GERAD) and imaging consortia (such as ENIGMA) are beginning to show that some SNPs associated with brain volumes do indeed overlap with some SNPs that confer heightened risk for disease. Methods to test the overlap of two GWAS, such as Reduced Rank Hypergeometric Overlap (RRHO)26, can detect enrichment of SNPs affecting two traits, without relying on any one set of candidate genes selected in advance. They assess the rank order of SNPs in one GWAS and test whether it has any relation to the rank order of SNPs in another GWAS. Some brain-associated SNPs detected by screening images can predict histological measures from the same regions in mice when the homologous mouse gene is used as a predictor. Follow-up functional assessments of GWAS results may involve analyses of multiple kinds of images (MRI, fMRI or DTI), as well as blood and plasma biomarkers. In the case of the TREM2 variant, a potent risk factor for Alzheimer’s disease 24,25, carriers show faster brain atrophy, faster cognitive decline24,25,27. These multimodal imaging assessments can identify biological roles for the genes involved and their consequences for brain function.
Multiple-testing issues
As genome-wide approaches to genetic analysis became possible, the genetics community derived statistical thresholds to limit the reporting of false positive discoveries that would fail to replicate. These thresholds were based on theoretical and empirical analyses of the number of independent tests that would be conducted if one were to examine evidence of association across the genome using sequence-level data28,29. Basing these thresholds on the number of independent tests across the genome rather than the number of variants tested in any given study, as well as focusing on replication, has helped limit the reporting of type I errors in the literature.
In imaging also, decades of statistical work has been applied to evaluate whether a statistical association is likely robust. In imaging genetics, the significance threshold may depend on whether a study is an initial unbiased discovery sample at the whole-brain and whole-genome levels (for which the threshold will be the strictest) or a replication of this finding. It may also change when disease-associated variants that already meet genome-wide significance are subsequently followed up.
How many tests?
Whole-genome analyses of whole-brain images involve running multiple GWAS on multiple brain measures. For example, ENIGMA’s second large-scale genetics study analyzed MRI scans from 29,000 people (unpublished data). They performed a GWAS on 8 different brain measures. Analysis of correlations among the 8 measures revealed that the effective number of statistical tests was approximately 7. As such, the threshold for declaring a result significant was adjusted, by dividing the standard threshold for a genome-wide screen by 7, to P < (5 × 10⁻⁸)/7 = 7.1 × 10⁻⁹.
Although neuroimaging data may appear very high dimensional (with millions of voxels), the effective number of degrees of freedom is generally much smaller. This is because imaging data have spatial contiguity properties that mean they are better treated as continuous functions of space. Thus, not all the tests are independent, as signals at neighboring voxels are correlated. Statistical parametric maps, the mainstay of voxel-based analyses, take into account the effective number of independent tests, which depends on the resolution of the scan and biological correlations of the signal30. If all the voxels in the brain were completely correlated, the effective number of tests would be 1, regardless of the scanner resolution. The correction for multiple comparisons is thus much less severe than might be anticipated at first glance.
Correcting for the number of voxels
The history of brain mapping suggests why a strict voxel-based correction may not be widely adopted or used: genes are not likely to produce highly focal effects in images, and their effects are not likely to affect just a single voxel in isolation. Performing tests at each voxel without reference to what is going on elsewhere in the image is equivalent to a ‘peak height’ test or ‘maximum statistic’ test: it frames only one hypothesis about the most extreme statistic in the whole image. Neglecting information in the rest of the scan leads to tests that are not very sensitive to spatially extended effects. Imagers soon developed more complex, ‘cluster-based’ tests that considered the spatial extent of an effect in an image, in addition to its peak height3.
Brains also vary in structure. Because of this, it is not expected that the same activation will occur at the exact same three-dimensional spatial coordinate (or voxel) in every person scanned. Although genomes can be aligned to a reference panel, registration of brain images to a standard three-dimensional template does not perfectly align functional areas of the brain across individuals. ‘Warping’ algorithms can now align structural imaging data with high precision, but function still varies relative to the anatomy, and relative to the three-dimensional coordinates of the reference template. To accommodate individual differences in locations of effects, tests of suprathreshold clusters (regions of images exceeding a statistical threshold) are much more widely used. These tests are much more sensitive to nonfocal signals that are not especially strong in any one voxel but are strong enough to reject the null hypothesis of no effect. Arguably, the effect of a gene on the brain, such as a growth factor, will be widespread and not focused on any one specific voxel.
If a correction is made for the total number of tests in an image, a second, more intriguing problem may arise: for some data, the image-wide threshold may depend on the magnetic field or the resolution of the scanner and the actual detail in the signal. Some measures extracted from an image—for example, the size of a tract or major nucleus—do not depend highly on the scanner resolution, and thus the effective number of tests is unchanged. But other signals—from diffusion MRI, for example—resolve finer scale fibers and connections when the scanner resolution or field strength is increased. This is addressed with methods that find features at multiple scales, prioritizing the most spatially extended signals32. In genetics, similar issues were observed as the coverage and depth of whole-genome sequencing improved. To a large extent, the sequencing of publicly available reference samples in the HapMap and 1000 Genome Projects has helped resolve many of these issues.
Setting a statistical threshold
To assess the dimensionality of imaging data and estimate a genome-wide significance level for the analysis of voxel level data, we extracted whole-brain voxel-level data (2,019,874 voxels) for 208 healthy, unrelated individuals for whom genotype data (Illumina Human610-Quad BeadChip) were available. These data were computed with methods previously described33 using data from ADNI collected with 1.5-T scanners. We performed quantitative tests of association at each voxel using 100 independent markers. We then sampled these results to assess the average minimum P value. Following Dudbridge and Gusnanto28, we then estimated the dimensionality of the voxel-level analysis to be 9,122. Adopting a conservative correction for testing 10,000 independent traits, the genome-wide, voxel-wide significance threshold would then be (1 × 10−4) × (5 × 10−8)/10,000 = 5 × 10⁻¹². We plot the growth in the effective number of tests, based on the minimum uncorrected P value observed in null data (Fig. 2). Encouragingly, the largest imaging genetics studies to date show effects on the order of P ≈ 10−23 (unpublished data), so such a threshold is within the reach of available sample sizes.
Figure 2.
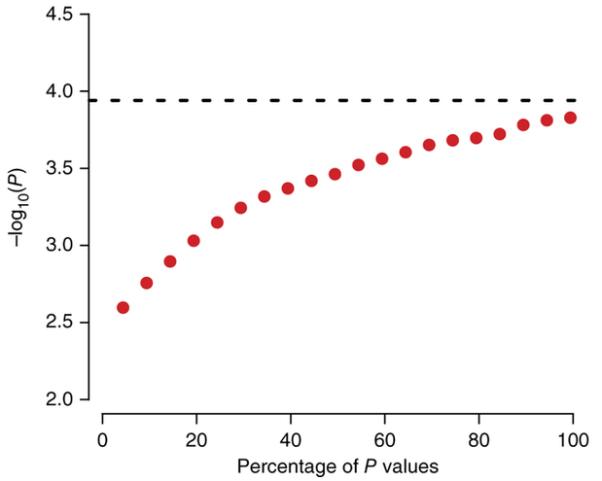
Testing genetic associations in an image. As a greater percentage of the voxels in the brain image are tested for associations (x axis), the minimum uncorrected P value will increase (y axis), even if the SNPs have no effect (that is, the null hypothesis is true). To correct for this, the genome-wide significance threshold can be divided by the effective number of independent tests on the image, based on P values that actually occur in simulated null data with the same spatial coherence.
The most conservative thresholds for searching images and genomes at the same time could be based on the effective number of independent tests in the genome and image. From the MRI simulation (Fig. 2), the standard and widely used threshold of P = 5 × 10⁻⁸ for a GWAS analysis of a single trait could be extended to 5 × 10⁻¹² when correcting for around 10,000 tests in a three-dimensional image.
Other considerations apply when testing effects of a single, GWAS-significant disease locus across the whole brain, or testing its effects on a single region of interest. If a candidate gene is well validated at the genome-wide level—as is, for example, APOE—one could perform a legitimate hypothesis test for its effects on an region of interest, such as the hippocampal volume (at P < 0.05) or across the whole brain—either using the conservative Bonferroni correction of 0.05/1 or 0.05/10,000, respectively or less conservative cluster- or set-based tests, which are more commonly used in neuroimaging.
Power and replication
Replication is vital to verify association signals and minimizes type I error in the literature. This push for replication comes from both the genetics and neuroimaging communities. If brain imaging studies are pooled after the data have been collected, it is unlikely that many similar cohorts will be scanned with exactly the same methods; if anything, the push for innovation has led to studies with different and ever-evolving designs. Even so, recent large-scale international imaging consortia galvanized the field to identify genetic associations with worldwide support. This offers a credible basis for prioritizing findings for follow-up analyses.
How much power do we have?
Methods exist to compute how many subjects are needed to secure a given level of statistical power in a GWAS of a single trait, such as Alzheimer’s disease diagnosis, or the size of a specific region of the brain. The power to identify a given genetic effect, at a given voxel, can be determined if we can estimate the proportion of variance in the signal at that voxel due to the variant. One commonly used tool to calculate power is the Genetic Power Calculator (GPC)34.
For example, if we ran a univariate GWAS to find SNPs influencing a single voxel, the sample size required to detect a SNP effect as strong as ApoE4’s effect on Alzheimer’s disease (namely, 6% of the variance) with 80% power would be 660 participants. For a brain-wide voxel-wise search, we would apply an additional multiple testing correction. While work is currently underway to determine a suitably robust correction factor, for the purposes of this illustration we will correct for 10,000–15,000 effectively independent voxels. Using this additional correction factor the threshold to declare significance increases from 5 × 10⁻⁸ to 3 × 10⁻¹². With this threshold, a sample of 1,015 individuals is needed to detect this same SNP effect in a voxel-level analysis with 80% power. For a more realistic SNP effect explaining around 0.5% of the variance, these sample sizes increase to 7,915 and 12,200 respectively—around the size of the first successful meta-analytic studies. These sample sizes are typically well beyond the reach of any single MRI study but well within the reach of collaborative consortia.
Do discoveries generalize?
Replicated genome-wide association results are expected to generalize, but they may not if factors such as age or ethnicity influence the measures analyzed. Replication studies can determine whether discoveries generalize across populations—and if not, why not. This is especially important in genetic studies where a seemingly significant discovery could lead to further useful biological validations, including mouse knockout models and genetic pathway analyses. If results are not robust, these efforts may be a waste of time.
Tactics to reduce the search space
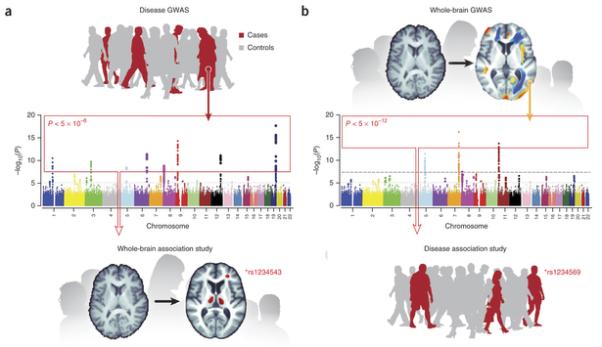
Perhaps, in these early days of imaging genomics, it would be prudent to take a conservative approach for reducing the search spaces. One could imagine a series of hierarchical tests, first performing whole-genome association analysis with brain-wide measures—structural and functional, as well as measures of brain connectivity and networks. This would ensure an unbiased screen at both the genomic and imaging levels. Subsequent follow up studies might include, for example, screening all significant disease GWAS hits with whole-brain data and then screening significant whole-brain hits, in independent samples, in specific regions of interest (Fig. 3). In all cases, the critical factor will be selecting the appropriate statistical threshold and ensuring sufficient power considering the expected effect size.
Figure 3.
Genomic efforts
As so many tests can be performed on an image, many attempts have been made, in study design and analysis, to reduce the search space for an association. This includes selecting specific regions of interest, connections, pathways or genes. However, GWAS has typically shown little support for candidate genes studied in this way. For instance, the largest schizophrenia GWAS so far2 did not support previous claims about several candidate genes involved in the disorder. This is often the case for candidate genes selected on the basis of biological plausibility. Many polymorphic growth factor genes, such as BDNF, were initially expected to be strong candidates for affecting regional brain volumes. Perhaps surprisingly, in the ENIGMA-CHARGE analysis of 21,151 people, the only well-known candidate gene affecting hippocampal volume was APOE. A more nuanced interpretation is that some gene effects may be context dependent—they may depend on the age or diagnostic status of the cohort. Or they may interact with other factors that diminish their aggregate effect in a meta-analysis.
Depending on the goal at hand, rather than performing GWAS, it may be of interest to assess effects on the brain of candidate genes that have been previously identified in GWAS as exploratory follow-ups of the initial discoveries. For example, when a strong genome-wide supported variant or mutation has been found to be highly significant in a neurological disease on the basis of GWAS, then mapping its pathways of action in the brain is a high priority. While the rare variant in the TREM2 gene was recently found to greatly increase disease risk in a genome-wide analysis of Alzheimer’s disease24,25, the neuroanatomical pathways remained unknown. Owing to the low prevalence of this variant (minor allele frequency ~0.005), even current imaging sample sizes may not be able to detect these drastic effects if a genome-wide image-wide threshold of P ~1 × 10⁻¹² is applied. Instead, a candidate gene–type study of this variant was able to determine that elderly carriers of the mutation exhibit greatly enhanced rates of temporal lobe atrophy27, offering a plausible explanation for the reduced cognitive functioning presented in the original discovery paper.
In addition to single SNP candidate analyses, the genetic search space can be narrowed by searching only genes of interest. The validity of this approach depends strongly on how those genes are chosen and the prior evidence of association for those candidates. Because a plausible case can be made for choosing any set of genes, this approach is typically less reliable and robust than unbiased screens. Such studies require replication in multiple cohorts, but they reduce the genetic search space by testing candidate mechanisms. Greater protection against type I error would be provided by correcting for the number of candidate genes that could have been assessed, at the cost of overlooking true positive findings that replication studies could verify.
Dimension reduction
As genomes and images are both high-dimensional, novel mathematical techniques may be useful to pick out weak signals in these vast computational searches. One promising data reduction method uses penalized regression to detect weak signals in large data sets, using sparse regression or independent components analysis (ICA), among other data reduction models35. The mathematically related field of compressive sensing36 has achieved great success in engineering and applied mathematics. Sparse methods try to model signals using as few predictors as possible—they penalize the number of predictors and favor those that explain most variance in the data. These ‘heavy-tailed priors’ embody the prior belief that associations or effects have a sparse distribution. In other words, there are a small number of strong associations and a large number of weak associations. These data reduction methods boost the power and efficiency of the search when all predictors are weak. Even so, they often make effective predictions when aggregated37.
Whatever methods are used for dimensionality reduction, they need to be validated. In genetics, robust association studies are designed using simulations with real genomic data, and similar methods are being applied to different imaging tests to ensure that they are validated before becoming widely adopted.
Results so far
It is too early to predict what may be learned from genome-wide analyses of voxel level data. The published studies that have addressed this research question are underpowered, with <1,000 participants (see Supplementary Table 1). Initial image-wide screens by Stein et al.20 and Hibar et al.38 on voxel-based GWAS failed to find any results after appropriate correction for multiple comparisons. There are some promising findings using dimension reduction, but these await replication.
While systematic comparisons are not yet possible, there are mixed results regarding the effects on the brain of popular candidate genes in psychiatry. As noted by ref. 39, many of the major Alzheimer’s disease risk genes do indeed have robust effects on brain structure and pathology assessed using MRI and PET. By contrast, candidate genes encoding growth factors and genes in classical neurotransmitter pathways have not appeared among the top hits in the larger imaging GWAS. However, we have to bear in mind that only the simplest brain measures have been tested in samples large enough to produce findings with genome-wide significance.
Should we rank brain measures?
A more neuroscientifically driven approach is to rank features in brain images for genetic analysis if they are already implicated in a disease of interest. Meta-analyses of brain differences in different disorders can help to rigorously define these. ENIGMA’s Schizophrenia10 and Bipolar Disorder9 Working Groups, for example, meta-analyzed regional brain volumes in the largest psychiatric MRI studies to date (2,047 patients and 2,059 controls for schizophrenia and 1747 patients and 2,615 controls for bipolar disorder). Several basal ganglia components and the hippocampus show robust case-control differences in cohorts worldwide and their volumes are highly heritable40.
Glahn et al.41 advocated selecting brain measures on the basis of both their heritability and their relevance for a disease being studied. They defined the endophenotype ranking value (ERV) based on the square-root of the heritability of the disorder (hi2), the square root of the heritability of the brain measure (he2) and their genetic correlation (ρg):
In schizophrenia, for example, decades of studies report morphometric differences in patients versus controls, for a range of different structures. The ENIGMA Schizophrenia Working Group is now ranking brain measures in order of their effect sizes for case-control differences; weighting these effects, based on their genetic correlation with the illness, would give another ranking. This takes into account that there is not complete overlap between the variants influencing a disease-related trait and the disease itself. Clearly, a disease will not affect the brain identically in all patients. But the variety of cohorts in ENIGMA makes it possible to dig deeper into medication-related, geographic or demographic and genetic factors to explain why brain differences vary so drastically across different studies.
One intriguing tactic is to use information from one very widely available imaging modality to inform the genetic analysis of another. For example, worldwide, there are many more structural brain MRI scans from people who have been genotyped than functional imaging scans or scans of pathology (such as amyloid imaging). To empower the search for variants affecting data that is in shorter supply, methods such as seemingly unrelated regression (SUR) can exploit information from all data types, such as clinical and imaging features combined, boosting power to detect associations42. Other multivariate methods combine data from multiple scan types; however, they often require a complete data set, where all subjects have all sets of information. Because it is less commonly collected, there will never be as much PET, DTI or functional MRI data as standard anatomical MRI data; therefore, methods are helpful to impute or explicitly model these complex missing data structures43,44.
Integrating diverse imaging methods and genomic variation
Functional neuroimaging
Genetic analysis of functional neuroimaging data is an active field45,46, as functional MRI has been widely used for over two decades. Data standardization across multiple protocol designs and consortia has not yet been fully established. So far, researchers have mainly used structural MRI measures to examine the genetic architecture of the brain. Future studies are likely to develop large databases of EEG and functional MRI measures. It is too early to say if these measures will offer more explanatory power as mediators of genetically driven variability in behavior and related risk for psychopathology. Some groups advocate the adoption of standardized functional probes across large, federally funded studies as is being done for behavioral phenotypes (for example, PhenX).
Functional imaging measures may be more challenging to harmonize than structural measures of regional brain volumes. For anatomical MRI, automated analysis software is widely used, such as FreeSurfer (http://freesurfer.net/) and FSL (http://fsl.fmrib.ox.ac.uk/fsl/fslwiki/). This has led to an understanding of the statistical norms and reliability of structural brain measures that informed subsequent GWAS. Ongoing efforts in data harmonization for genetic analysis include fMRI, DTI and EEG12,47.
Once processing steps have been harmonized and reliable and genetically influenced phenotypes have been extracted from the functional scans of multiple groups, then tests of genetic associations can be performed. As with structural imaging GWAS, functional neuroimaging associations with the genome will likely begin with a handful of phenotypes of interest. When studies are sufficiently powered, a whole-brain approach will ultimately supplant the need for candidate regions based on incomplete knowledge of disease circuits. In either case, multiple comparisons corrections are needed that take into account the number of independent tests performed.
Neurogenetic syndromes
A somewhat more consistent picture emerges from neuroimaging studies of neurogenetic syndromes. These include 22q deletion syndrome, fragile X syndrome, Williams syndrome, Turner syndrome and others. Neuroimaging shows generally consistent patterns of abnormalities in these disorders. In general, their effects on the brain and behavior are far greater than the effects of common genetic variants (see our review in ref. 48). Some neurogenetic disorders result from deletion of chromosomal material important for development, leading to brain abnormalities and characteristic behavioral and cognitive effects. Williams syndrome, for example, arises due to a contiguous deletion of approximately 26–28 genes from chromosome 7 and is characterized by abnormal social and emotional processing and abnormal brain structure and function.
In Williams syndrome, cortical folding is more complex in some regions, with distinctive patterns of greater and lesser gray matter thickness in different cortical areas; polymicrogyria and gyral anomalies are common. A related neurodevelopmental disorder, fragile X syndrome49 involves an abnormal expansion of the CGG trinucleotide repeat affecting the fragile X mental retardation 1_(FMR1) gene on the X chromosome. This leads to impaired executive function and visuo-spatial skills. In affected females, brain volume abnormalities correlate with reduction in systemically measured levels of the fragile X mental retardation protein (FMRP), the gene product of FMR1. supporting theories that FMRP is required for normal dendritic pruning in fronto-striatal-limbic pathways. The neuroimaging findings in these and other neurogenetic disorders have led to a growing understanding of many genetic factors crucial for axonal guidance and migration, cortical folding and dendritic pruning. Aberrations in these processes can lead to widespread macroscopic effects in neuroimaging data. Consortium efforts are also being applied to study neurogenetic syndromes (such as the ENIGMA-22q initiative), to assess differences in cohorts worldwide and what factors promote better outcomes in children with these neurodevelopmental disorders.
Structural and rare variation
For traits such as psychiatric diagnosis, genetic analyses have assessed an assortment of genetic variants. At this point, few brain imaging studies have evaluated CNVs, rare variants or other kinds of genetic variation; common variants are more widely studied, because standardized protocols are available and because sufficiently large sample sizes needed to power a study are only now becoming available for other variants. When examining the impact of rare variation on imaging phenotypes a number of different analytic approaches may be adopted. However, as explored by Zuk et al.50, the sample sizes required for rare variant analysis are as large or larger than those required for common variant analyses.
Current SNP chip technologies genotype around 250,000 to 5 million variants across the genome. However, with the advent of next generation sequencing (NGS) technology it is, in principle, possible to evaluate all genetic variants. Two common modalities for NGS experiments are whole exome sequencing, which aims to capture all genetic variation, common and rare, in the coding regions of the human genome (with some additional content such as non-coding RNAs) and whole-genome sequencing which aims to capture the entire genome. In practice, the proportion of the variants obtained from WES and WGS depend on a number of factors including the depth of the coverage (how many times each section of DNA is sequenced), error rates and the sequence complexity of the region (repetitive sequences, for example, are still difficult to sequence). As discussed in other papers in this issue51, WES and WGS can evaluate rare and de novo (newly arisen) variation. Already, insights into neuropsychiatric disorders, such as epilepsy52,53 and autism54–57, are emerging from WGS studies. These discoveries explain a modest percent of the variance in disease risk.
Recommendations
In summary, some imaging studies are now large enough to discover reproducible effects of single SNPs on simple brain measures, for example, the volume of the hippocampus3,4 and other subcortical regions16. Some neuroimaging projects, such as ADNI, began by harmonizing the image acquisition across multiple centers, achieving samples of over a thousand individuals. A far larger sample, in the tens of thousands, can be achieved by combining data from multiple centers, even if the data was originally collected with other goals in mind.
Consortium efforts such as ENIGMA and CHARGE show, without any doubt, that there is sufficient harmony in the acquisition and analysis of brain scans to identify consistent genetic effects across cohorts worldwide.
Effect sizes of individual SNPs are small for all imaging traits examined so far. There is a need for rigor in declaring genome-wide significance, especially when a number of traits are assessed in the same study. Arguably, this issue is not avoided by focusing on a small set of candidate genes or biological pathways.
When searching the whole brain for genetics effect, consortia currently have sufficient power to correct for the effective number of independent tests performed on the image. The history of neuroimaging has shown that tests for focal effects are not as powerful in detecting widespread effects, and other tests of cluster size or image-derived features can be more powerful. Even so, given the vast number of association tests undertaken, approaches are needed to correct for type I error.
Dimension reduction methods for ‘big data’ abound, and there is no substitute for replication. More efficient generative models of genomic and imaging variation will be created in the future, seeking the most relevant features to test, leading to tests performed on a more restricted set of parameters58. Such models have been successful in modeling natural languages, where the latent structure in the signals is modeled using a generative grammar of much lower dimension than the signals used to represent or record the data.
In the future, mutational load or burden tests of rare mutations might be applied to imaging data, as well as any other genetic analyses amenable to quantitative traits. A brain structural pathway or functional network might be treated similarly to a cellular pathway or protein interaction network; a burden test for rare loss-of-function mutations could be applied in a voxel-wise or connectome-wide manner to aspects of brain networks. In statistical analyses of the connectome for example, we can test for effects on pathways or networks at various levels59. Often we test for associations element-wise—at single connections or hubs—and then we move to a more global level, aiming to detect more systematic relationships in whole pathways or organizational properties. Future studies are likely to identify specific genetic associations for higher order properties of brain organization.
Finally, imaging studies using sequencing based genotypes can effectively be limited to study genomic regions already implicated in standard GWAS. One could then use data reduction methods such as LASSO or ridge regression, to estimate the variance explained in the neighborhood of a sequenced locus60–62. Bayesian methods can also target causal disease associated SNPs in densely genotyped regions63. The experience of global consortia, at least for the limited structural measures so far subjected to GWAS, suggests that measures extracted from brain images do not show larger effect sizes than other quantitative traits. With rapid innovations in image acquisition and processing, the pool of phenotypes available from imaging is essentially infinite.
Conclusion
Ongoing collaborations between brain imagers and geneticists have led to worldwide consortia dedicated to finding factors that influence brain imaging measures. This review has focused on GWAS, which have accelerated consortium studies worldwide. As sample sizes and power increase in imaging studies, other types of genetic variation—rare variants and CNVs—may also be assessed. As geneticists and neuroimagers worked together, there have been several surprises along the way. Genetic analyses of brain images still require thousands of individuals to find credible genetic associations that replicate across cohorts.
Brain imaging can measure signals at over two million locations in the brain; if each signal is surveyed while screening the genome as well, the resulting statistical search is so vast that collaboration is essential to secure enough power to detect associations. The future is likely to bring ever more complex imaging data into the hands of geneticists—for genetic screening of the elaborate networks derived from brain connectivity analyses30 and other deep phenotyping efforts. These worldwide efforts will reveal new factors that affect the brain and mechanistic factors that drive resilience and risk for disease, as well as normal variations in brain function and structure over the lifespan.
Supplementary Material
ACKNOWLEDGMENTS
S.E.M. is supported by an Australian Research Council Future Fellowship, 110100548. N.J. and P.M.T. were supported, in part, by US National Institutes of Health R01 grants NS080655, AG040060, EB008432, MH097268, MH085667, MH089722 and MH094343, and grants U01 AG024904 and P41 EB015922. B.M.N. was supported in part by R01 MH101244.
Footnotes
Note: Any Supplementary Information and Source Data files are available in the online version of the paper.
COMPETING FINANCIAL INTERESTS The authors declare no competing financial interests.
Reprints and permissions information is available online at http://www.nature.com/reprints/index.html.
References
- 1.Lambert JC, et al. Meta-analysis of 74,046 individuals identifies 11 new susceptibility loci for Alzheimer’s disease. Nat. Genet. 2013;45:1452–1458. doi: 10.1038/ng.2802. Medline CrossRef. [DOI] [PMC free article] [PubMed] [Google Scholar]
- 2.Ripke S, et al. Genome-wide association analysis identifies 13 new risk loci for schizophrenia. Nat. Genet. 2013;45:1150–1159. doi: 10.1038/ng.2742. Medline CrossRef. [DOI] [PMC free article] [PubMed] [Google Scholar]
- 3.Stein JL, et al. Identification of common variants associated with human hippocampal and intracranial volumes. Nat. Genet. 2012;44:552–561. doi: 10.1038/ng.2250. Medline CrossRef. [DOI] [PMC free article] [PubMed] [Google Scholar]
- 4.Bis JC, et al. Common variants at 12q14 and 12q24 are associated with hippocampal volume. Nat. Genet. 2012;44:545–551. doi: 10.1038/ng.2237. Medline CrossRef. [DOI] [PMC free article] [PubMed] [Google Scholar]
- 5.Strittmatter WJ, et al. Apolipoprotein E: high-avidity binding to beta-amyloid and increased frequency of type 4 allele in late-onset familial Alzheimer disease. Proc. Natl. Acad. Sci. USA. 1993;90:1977–1981. doi: 10.1073/pnas.90.5.1977. Medline CrossRef. [DOI] [PMC free article] [PubMed] [Google Scholar]
- 6.Shaw P, et al. Cortical morphology in children and adolescents with different apolipoprotein E gene polymorphisms: an observational study. Lancet Neurol. 2007;6:494–500. doi: 10.1016/S1474-4422(07)70106-0. Medline CrossRef. [DOI] [PubMed] [Google Scholar]
- 7.Potkin SG, et al. Hippocampal atrophy as a quantitative trait in a genome-wide association study identifying novel susceptibility genes for Alzheimer’s disease. PLoS ONE. 2009;4:e6501. doi: 10.1371/journal.pone.0006501. Medline CrossRef. [DOI] [PMC free article] [PubMed] [Google Scholar]
- 8.Flint J, Munafo MR. Candidate and non-candidate genes in behavior genetics. Curr. Opin. Neurobiol. 2013;23:57–61. doi: 10.1016/j.conb.2012.07.005. Medline CrossRef. [DOI] [PMC free article] [PubMed] [Google Scholar]
- 9.Hibar DP, et al. Meta-analysis of structural brain differences in bipolar disorder: the ENIGMA-Bipolar Disorder. proceedings Organization of Human Brain Mapping; Seattle, WA USA. June 2013. [Google Scholar]
- 10.Turner JA, et al. A prospective meta-analysis of subcortical brain volumes in schizophrenia via the ENIGMA Consortium. proceedings Organization of Human Brain Mapping; Seattle, WA USA. June 2013. [Google Scholar]
- 11.Hibar DP, et al. ENIGMA2: genome-wide scans of subcortical brain volumes in 16,125 subjects from 28 cohorts worldwide. proceedings Organization of Human Brain Mapping; Seattle, WA USA. June 2013. [Google Scholar]
- 12.Jahanshad N, et al. Multi-site genetic analysis of diffusion images and voxelwise heritability analysis: A pilot project of the ENIGMA-DTI working group. Neuroimage. 2013;81:455–469. doi: 10.1016/j.neuroimage.2013.04.061. Medline CrossRef. [DOI] [PMC free article] [PubMed] [Google Scholar]
- 13.Thompson PM, et al. The ENIGMA Consortium: large-scale collaborative analyses of neuroimaging and genetic data. Brain Imaging Behav. 2014 Jan 8; doi: 10.1007/s11682-013-9269-5. doi:10.1007/s11682-013-9269-5. Medline CrossRef. [DOI] [PMC free article] [PubMed] [Google Scholar]
- 14.Weiner MW, et al. The Alzheimer’s Disease Neuroimaging Initiative: a review of papers published since its inception. Alzheimers Dement. 2012;8:S1–S68. doi: 10.1016/j.jalz.2011.09.172. Medline CrossRef. [DOI] [PMC free article] [PubMed] [Google Scholar]
- 15.Carrillo MC, Bain LJ, Frisoni GB, Weiner MW. Worldwide Alzheimer’s disease neuroimaging initiative. Alzheimers Dement. 2012;8:337–342. doi: 10.1016/j.jalz.2012.04.007. Medline CrossRef. [DOI] [PubMed] [Google Scholar]
- 16.Lehmann JM, et al. An antidiabetic thiazolidinedione is a high affinity ligand for peroxisome proliferator-activated receptor gamma (PPAR gamma) J. Biol. Chem. 1995;270:12953–12956. doi: 10.1074/jbc.270.22.12953. Medline CrossRef. [DOI] [PubMed] [Google Scholar]
- 17.Pearson ER, et al. Variation in TCF7L2 influences therapeutic response to sulfonylureas: a GoDARTs study. Diabetes. 2007;56:2178–2182. doi: 10.2337/db07-0440. Medline CrossRef. [DOI] [PubMed] [Google Scholar]
- 18.Global Lipids Genetics Consortium Discovery and refinement of loci associated with lipid levels. Nat. Genet. 2013;45:1274–1283. doi: 10.1038/ng.2797. Medline CrossRef. [DOI] [PMC free article] [PubMed] [Google Scholar]
- 19.Wonderlick JS, et al. Reliability of MRI-derived cortical and subcortical morphometric measures: effects of pulse sequence, voxel geometry, and parallel imaging. Neuroimage. 2009;44:1324–1333. doi: 10.1016/j.neuroimage.2008.10.037. Medline CrossRef. [DOI] [PMC free article] [PubMed] [Google Scholar]
- 20.Stein JL, et al. Voxelwise genome-wide association study (vGWAS) Neuroimage. 2010;53:1160–1174. doi: 10.1016/j.neuroimage.2010.02.032. Medline CrossRef. [DOI] [PMC free article] [PubMed] [Google Scholar]
- 21.Hibar DP, et al. Alzheimer’s disease risk gene, GAB2, is associated with regional brain volume differences in 755 young healthy twins. Twin Res. Hum. Genet. 2012;15:286–295. doi: 10.1017/thg.2012.15. Medline CrossRef. [DOI] [PMC free article] [PubMed] [Google Scholar]
- 22.Jahanshad N, et al. Genome-wide scan of healthy human connectome discovers SPON1 gene variant influencing dementia severity. Proc. Natl. Acad. Sci. USA. 2013;110:4768–4773. doi: 10.1073/pnas.1216206110. Medline CrossRef. [DOI] [PMC free article] [PubMed] [Google Scholar]
- 23.Sherva R, et al. Genome-wide association study of the rate of cognitive decline in Alzheimer’s disease. Alzheimers Dement. 2014;10:45–52. doi: 10.1016/j.jalz.2013.01.008. Medline. [DOI] [PMC free article] [PubMed] [Google Scholar]
- 24.Guerreiro R, et al. TREM2 variants in Alzheimer’s disease. N. Engl. J. Med. 2013;368:117–127. doi: 10.1056/NEJMoa1211851. Medline CrossRef. [DOI] [PMC free article] [PubMed] [Google Scholar]
- 25.Jonsson T, et al. Variant of TREM2 associated with the risk of Alzheimer’s disease. N. Engl. J. Med. 2013;368:107–116. doi: 10.1056/NEJMoa1211103. Medline CrossRef. [DOI] [PMC free article] [PubMed] [Google Scholar]
- 26.Plaisier SB, Taschereau R, Wong JA, Graeber TG. Rank-rank hypergeometric overlap: identification of statistically significant overlap between gene-expression signatures. Nucleic Acids Res. 2010;38:e169. doi: 10.1093/nar/gkq636. Medline CrossRef. [DOI] [PMC free article] [PubMed] [Google Scholar]
- 27.Rajagopalan P, Hibar DP, Thompson PM. TREM2 and neurodegenerative disease. N. Engl. J. Med. 2013;369:1565–1566. doi: 10.1056/NEJMc1306509#SA3. Medline. [DOI] [PMC free article] [PubMed] [Google Scholar]
- 28.Dudbridge F, Gusnanto A. Estimation of significance thresholds for genomewide association scans. Genet. Epidemiol. 2008;32:227–234. doi: 10.1002/gepi.20297. Medline CrossRef. [DOI] [PMC free article] [PubMed] [Google Scholar]
- 29.Pe’er I, Yelensky R, Altshuler D, Daly MJ. Estimation of the multiple testing burden for genomewide association studies of nearly all common variants. Genet. Epidemiol. 2008;32:381–385. doi: 10.1002/gepi.20303. Medline CrossRef. [DOI] [PubMed] [Google Scholar]
- 30.Kiebel SJ, Poline JB, Friston KJ, Holmes AP, Worsley KJ. Robust smoothness estimation in statistical parametric maps using standardized residuals from the general linear model. Neuroimage. 1999;10:756–766. doi: 10.1006/nimg.1999.0508. Medline CrossRef. [DOI] [PubMed] [Google Scholar]
- 31.Hayasaka S, Phan KL, Liberzon I, Worsley KJ, Nichols TE. Nonstationary cluster-size inference with random field and permutation methods. Neuroimage. 2004;22:676–687. doi: 10.1016/j.neuroimage.2004.01.041. Medline CrossRef. [DOI] [PubMed] [Google Scholar]
- 32.Worsley KJ, Marrett S, Neelin P, Evans AC. Searching scale space for activation in PET images. Hum. Brain Mapp. 1996;4:74–90. doi: 10.1002/(SICI)1097-0193(1996)4:1<74::AID-HBM5>3.0.CO;2-M. Medline CrossRef. [DOI] [PubMed] [Google Scholar]
- 33.Hua X, et al. Unbiased tensor-based morphometry: improved robustness and sample size estimates for Alzheimer’s disease clinical trials. Neuroimage. 2013;66:648–661. doi: 10.1016/j.neuroimage.2012.10.086. Medline. [DOI] [PMC free article] [PubMed] [Google Scholar]
- 34.Purcell S, Cherny SS, Sham PC. Genetic Power Calculator: design of linkage and association genetic mapping studies of complex traits. Bioinformatics. 2003;19:149–150. doi: 10.1093/bioinformatics/19.1.149. Medline CrossRef. [DOI] [PubMed] [Google Scholar]
- 35.Hibar DP, Kohannim O, Stein JL, Chiang MC, Thompson PM. Multilocus genetic analysis of brain images. Front. Genet. 2011;2:73. doi: 10.3389/fgene.2011.00073. Medline CrossRef. [DOI] [PMC free article] [PubMed] [Google Scholar]
- 36.Candès EJ, Romberg JK, Tao T. Stable signal recovery from incomplete and inaccurate measurements. Commun. Pure Appl. Math. 2006;59:1207–1223. CrossRef. [Google Scholar]
- 37.Inkster B, et al. Histone deacetylase gene variants predict brain volume changes in multiple sclerosis. Neurobiol. Aging. 2013;34:238–247. doi: 10.1016/j.neurobiolaging.2012.07.007. Medline CrossRef. [DOI] [PubMed] [Google Scholar]
- 38.Hibar DP, et al. Voxelwise gene-wide association study (vGeneWAS): Multivariate gene-based association testing in 731 elderly subjects. Neuroimage. 2011;56:1875–1891. doi: 10.1016/j.neuroimage.2011.03.077. Medline CrossRef. [DOI] [PMC free article] [PubMed] [Google Scholar]
- 39.Shen L, et al. Genetic analysis of quantitative phenotypes in AD and MCI: imaging, cognition and biomarkers. Brain Imaging Behav. 2013 Oct 5; doi: 10.1007/s11682-013-9262-z. doi:10.1007/s11682-013-9262-z. Medline CrossRef. [DOI] [PMC free article] [PubMed] [Google Scholar]
- 40.den Braber A, et al. Heritability of subcortical brain measures: A perspective for future genome-wide association studies. Neuroimage. 2013;83:98–102. doi: 10.1016/j.neuroimage.2013.06.027. Medline CrossRef. [DOI] [PubMed] [Google Scholar]
- 41.Glahn DC, et al. High dimensional endophenotype ranking in the search for major depression risk genes. Biol. Psychiatry. 2012;71:6–14. doi: 10.1016/j.biopsych.2011.08.022. Medline CrossRef. [DOI] [PMC free article] [PubMed] [Google Scholar]
- 42.Jahanshad N, et al. Seemingly Unrelated Regression empowers detection of network failure in dementia. Neurobiol Aging. 2014 doi: 10.1016/j.neurobiolaging.2014.02.032. in the press 2012). [DOI] [PMC free article] [PubMed] [Google Scholar]
- 43.Yuan L, Wang Y, Thompson PM, Narayan VA, Ye J. Multi-source feature learning for joint analysis of incomplete multiple heterogeneous neuroimaging data. Neuroimage. 2012;61:622–632. doi: 10.1016/j.neuroimage.2012.03.059. Medline CrossRef. [DOI] [PMC free article] [PubMed] [Google Scholar]
- 44.Xiang S, et al. Bi-level multi-source learning for heterogeneous block-wise missing data. Neuroimage. 2013 Aug 27; doi: 10.1016/j.neuroimage.2013.08.015. doi:10.1016/j.neuroimage.2013.08.015. Medline CrossRef. [DOI] [PMC free article] [PubMed] [Google Scholar]
- 45.Glahn DC, et al. Genetic control over the resting brain. Proc. Natl. Acad. Sci. USA. 2010;107:1223–1228. doi: 10.1073/pnas.0909969107. Medline CrossRef. [DOI] [PMC free article] [PubMed] [Google Scholar]
- 46.Potkin SG, et al. A genome-wide association study of schizophrenia using brain activation as a quantitative phenotype. Schizophr. Bull. 2009;35:96–108. doi: 10.1093/schbul/sbn155. Medline CrossRef. [DOI] [PMC free article] [PubMed] [Google Scholar]
- 47.Kochunov P, et al. Multi-site study of additive genetic effects on fractional anisotropy of cerebral white matter: comparing meta and mega analytical approaches for data pooling. Neuroimage. 2014 Mar 18; doi: 10.1016/j.neuroimage.2014.03.033. doi:10.1016/j.neuroimage.2014.03.033. Medline CrossRef. [DOI] [PMC free article] [PubMed] [Google Scholar]
- 48.Dennis EL, Thompson PM. Typical and atypical brain development: a review of neuroimaging studies. Dialogues Clin. Neurosci. 2013;15:359–384. doi: 10.31887/DCNS.2013.15.3/edennis. Medline. [DOI] [PMC free article] [PubMed] [Google Scholar]
- 49.Lee AD, et al. 3D pattern of brain abnormalities in Fragile X syndrome visualized using tensor-based morphometry. Neuroimage. 2007;34:924–938. doi: 10.1016/j.neuroimage.2006.09.043. Medline CrossRef. [DOI] [PMC free article] [PubMed] [Google Scholar]
- 50.Zuk O, et al. Searching for missing heritability: designing rare variant association studies. Proc. Natl. Acad. Sci. USA. 2014;111:E455–E464. doi: 10.1073/pnas.1322563111. Medline CrossRef. [DOI] [PMC free article] [PubMed] [Google Scholar]
- 51.Gratten J, Wray NR, Keller MC, Visscher PM. Light after the long dark tunnel: elucidating the genetic architecture of psychiatric disorders through large-scale genomics. Nat. Neurosci. 2014;17:xxx–yyy. doi: 10.1038/nn.3708. [DOI] [PMC free article] [PubMed] [Google Scholar]
- 52.Carvill GL, et al. Targeted resequencing in epileptic encephalopathies identifies de novo mutations in CHD2 and SYNGAP1. Nat. Genet. 2013;45:825–830. doi: 10.1038/ng.2646. Medline CrossRef. [DOI] [PMC free article] [PubMed] [Google Scholar]
- 53.Epi4K Consortium & Epilepsy Phenome/Genome Project De novo mutations in epileptic encephalopathies. Nature. 2013;501:217–221. doi: 10.1038/nature12439. Medline CrossRef. [DOI] [PMC free article] [PubMed] [Google Scholar]
- 54.Neale BM, et al. Patterns and rates of exonic de novo mutations in autism spectrum disorders. Nature. 2012;485:242–245. doi: 10.1038/nature11011. Medline CrossRef. [DOI] [PMC free article] [PubMed] [Google Scholar]
- 55.O’Roak BJ, et al. Sporadic autism exomes reveal a highly interconnected protein network of de novo mutations. Nature. 2012;485:246–250. doi: 10.1038/nature10989. Medline CrossRef. [DOI] [PMC free article] [PubMed] [Google Scholar]
- 56.Sanders SJ, et al. De novo mutations revealed by whole-exome sequencing are strongly associated with autism. Nature. 2012;485:237–241. doi: 10.1038/nature10945. Medline CrossRef. [DOI] [PMC free article] [PubMed] [Google Scholar]
- 57.Iossifov I, et al. De novo gene disruptions in children on the autistic spectrum. Neuron. 2012;74:285–299. doi: 10.1016/j.neuron.2012.04.009. Medline CrossRef. [DOI] [PMC free article] [PubMed] [Google Scholar]
- 58.Chattopadhyay I, Lipson H. Data smashing. 2014 doi: 10.1098/rsif.2014.0826. Preprint at http://arxiv.org/pdf/1401.0742v1.pdf. [DOI] [PMC free article] [PubMed]
- 59.Duarte-Carvajalino JM, et al. Hierarchical topological network analysis of anatomical human brain connectivity and differences related to sex and kinship. Neuroimage. 2012;59:3784–3804. doi: 10.1016/j.neuroimage.2011.10.096. Medline CrossRef. [DOI] [PMC free article] [PubMed] [Google Scholar]
- 60.Tibshirani R. Regression shrinkage and selection via the Lasso. J. R. Stat. Soc. Series B Stat. Methodol. 1996;58:267–288. [Google Scholar]
- 61.Kohannim O, et al. Boosting power to detect genetic associations in imaging using multi-locus, genome-wide scans and ridge regression. Biomedical Imaging: From Nano to Macro, 2011 IEEE International Symposium on 1855–1859; IEEE; 2011. [Google Scholar]
- 62.Kohannim O, et al. Discovery and replication of gene influences on brain structure using LASSO regression. Front. Neurosci. 2012;6:115. doi: 10.3389/fnins.2012.00115. Medline CrossRef. [DOI] [PMC free article] [PubMed] [Google Scholar]
- 63.Wellcome Trust Case Control Consortium et al. Bayesian refinement of association signals for 14 loci in 3 common diseases. Nat. Genet. 2012;44:1294–1301. doi: 10.1038/ng.2435. Medline CrossRef. [DOI] [PMC free article] [PubMed] [Google Scholar]
- 64.Ikram MA, et al. Common variants at 6q22 and 17q21 are associated with intracranial volume. Nat. Genet. 2012;44:539–544. doi: 10.1038/ng.2245. Medline CrossRef. [DOI] [PMC free article] [PubMed] [Google Scholar]
- 65.Psaty BM, et al. Cohorts for Heart and Aging Research in Genomic Epidemiology (CHARGE) Consortium. Design of prospective meta-analyses of genome-wide association studies from 5 cohorts. Circ. Cardiovasc. Genet. 2009;2:73–80. doi: 10.1161/CIRCGENETICS.108.829747. Medline CrossRef. [DOI] [PMC free article] [PubMed] [Google Scholar]
- 66.Nymberg C, Jia T, Ruggeri B, Schumann G. Analytical strategies for large imaging genetic datasets: experiences from the IMAGEN study. Ann. NY Acad. Sci. 2013;1282:92–106. doi: 10.1111/nyas.12088. Medline CrossRef. [DOI] [PubMed] [Google Scholar]
- 67.Paillère Martinot ML, et al. White-matter microstructure and gray-matter volumes in adolescents with subthreshold bipolar symptoms. Mol. Psychiatry. 2014;19:462–470. doi: 10.1038/mp.2013.44. Medline. [DOI] [PMC free article] [PubMed] [Google Scholar]
- 68.Eicher JD, et al. Genome-wide association study of shared components of reading disability and language impairment. Genes Brain Behav. 2013;12:792–801. doi: 10.1111/gbb.12085. Medline CrossRef. [DOI] [PMC free article] [PubMed] [Google Scholar]
- 69.Potkin SG, Ford JM. Widespread cortical dysfunction in schizophrenia: the FBIRN imaging consortium. Schizophr. Bull. 2009;35:15–18. doi: 10.1093/schbul/sbn159. Medline CrossRef. [DOI] [PMC free article] [PubMed] [Google Scholar]
Associated Data
This section collects any data citations, data availability statements, or supplementary materials included in this article.