

Abstract
From 1984-2001, the Pediatric Oncology Group (POG) conducted 12 acute lymphoblastic leukemia (ALL) studies. 10-year event free survival (EFS) for patients >12 months of age with B-precursor ALL on Acute Leukemia in Children 14, 15, and 16 series were 66.7 ± 1.2%, 68.1 ± 1.4% and 73.2 ± 2.1%, respectively. Intermediate dose methotrexate (ID MTX; 1 g/m2) improved outcomes for standard risk patients (10-year EFS 77.5 ± 2.7% vs. 66.3 ± 3.1% for oral MTX). Neither MTX intensification (2.5 g/m2) nor addition of cytosine arabinoside/daunomycin/teniposide improved outcomes for higher risk patients. Intermediate dose mercaptopurine (1 g/m2) failed to improve outcomes for either group. 10-year EFS for patients with T-cell ALL, POG 8704 and 9404, were 49.1 ± 3.1% and 72.2 ± 4.7%, respectively. Intensive asparaginase (10-year EFS 61.8% vs 42.7%) and high dose MTX (5 g/m2) (10-year EFS 78.0% vs. 65.8%) improved outcomes. There was a non-significant improvement in EFS for infants (10-year EFS 17.7 ± 7.2% to 31.9 ± 8.3%). Prognostic indicators for B-precursor ALL were age and WBC at diagnosis, gender, central nervous system disease, DNA index, and cytogenetic abnormalities. Only gender was prognostic in T-cell ALL. In infants, WBC and MLL translocation were linked to inferior outcome.
Keywords: B-lineage ALL, T-lineage ALL, Infant ALL, Prognostic factors, Outcome
INTRODUCTION
Over the past 50 years, there have been dramatic improvements in the outcome of children with acute lymphoblastic leukemia (ALL): 5 year overall survival is now approaching 90%(1-3). During this period, the Pediatric Oncology Group (POG) focused on risk- adapted therapy attempting to both limit toxicities and to maximize cures. Early studies for patients with lower risk B-precursor ALL focused on antimetabolite- based therapy, avoiding the use of anthracyclines, alkylating agents, and epipodophyllotoxins. Because patients with higher risk B-precursor ALL had an inferior outcome with antimetabolite- based therapy alone, further studies investigated the Goldie-Coldman hypothesis by the alternating use of anti-tumor agents that are relatively non-cross resistant to prevent the emergence of (or to treat) drug resistant leukemic clones.
Leukemic cells from children with T- cell ALL and Infant ALL have different biologic characteristics compared to those of children with B-precursor ALL. Therefore, these patients were treated on lineage and age specific protocols. Children with T- cell ALL were initially treated with rotating chemotherapeutic agents, including anthracyclines, alkylators, and epipodophyllotoxins along with intensification of asparaginase. However, because of a high rate of secondary malignancies, subsequent studies focused on intensification with asparaginase and methotrexate. Infants proved difficult to treat throughout this period with high rates of relapse, despite the use of antimetabolites, anthracyclines, alkylators, and epipodophyllotoxins.
From 1984-2001 the POG conducted seven studies for the treatment of B- precursor ALL, two for T- cell ALL and three for Infant ALL. In this paper we report the long term outcomes of patients enrolled on these studies.
MATERIALS AND METHODS
Patients
Between 1984 and 2001, 7393 patients diagnosed with ALL were enrolled on twelve POG studies. Patients with B-precursor ALL (n=6524) were ≥ 12 months to ≤21.999 years of age. Patients with L3 morphology were treated on other studies. Patients with T -cell ALL (n=705) were also ≥ 12 months to ≤21.999 years of age. Infants with ALL (n=164; POG 8398/8493/9107) were < 12 months of age. The POG 8398 and 8493 infant ALL protocols included infants with B-precursor (non- L3 morphology) and the occasional infant with T- cell ALL. Infants with T- cell ALL were not eligible for POG 9107. For all studies, patients could not have received prior therapy except for emergent treatment with steroids and/or radiation for severe respiratory distress. Blasts were Sudan black and/or myeloperoxidase negative and non-specific esterase negative. Immunophenotyping, chromosome analysis, and DNA index determination were performed at POG reference laboratories for all patients. On ALinC 16, patients also had reference laboratory flouresence in situ hybridization testing for trisomies 4 and 10 and subsets of patients had molecular screening for TEL-AML1 (ETV6-RUNX1) and/or for MLL rearrangements. Infants on the 8398, 8493, and 9107 protocols had subsequent MLL testing from cryopreserved bone marrow samples. All studies were approved by the institutional review board for each participating center. Informed consent was obtained prior to registration and treatment.
Treatments
B-Precursor ALL
Treatments are summarized in Table 1, and included 3 eras, Acute Leukemia in Children (ALinC) 14 - 16. Each POG study was numbered so that the first two numbers indicated the anticipated start year and the second two numbers indicated the study number within the category. POG 8602 (ALinC 14) included patients with both lower and higher risk disease. Subsequently, patients with lower or higher risk disease were treated on separate POG studies. Four POG studies focused on patients with lower risk disease (POG 9005, 9201, 9405, and 9605) and two POG studies focused on patients with higher risk disease (POG 9006 and 9406).
Table 1.
Pediatric Oncology Group Treatment Overview
| B-Precursor | T-cell | Infant | ||||||||||
|---|---|---|---|---|---|---|---|---|---|---|---|---|
| ALinC 14 | ALinC 15 | ALinC 16 | ||||||||||
|
8602 (1986-1991) |
9005 (1991-1994) |
9006 (1991-1994) |
9201 (1992-1999) |
9405 (1994-1995) |
9406 (1994-1999) |
9605 (1996-1999) |
8704 (1987-1992) |
9404 (1996-2001) |
8398 (1984-1990) |
8493 (1984-1990) |
9107 (1991-1993) |
|
| Induction | PVAsp | PVAsp | PVDAsp | PVAsp | PVAsp | PVDAsp | PVAsp | PVDoxCy AC/Cy/Asp |
PVDox/MTX/MP Randomize (4 groups) ± HDMTX × 4 ± Dexrazoxane |
PVDAsp | VP/Cy/AC | VP/Cy/AC |
| Intensification |
Randomize IDMTX q3wk × 6 VP |
Randomize IDMTX/IDMP q2wk × 12 |
Randomize IDMTX (1 g/m2) + IDMP q2wk × 12 |
IDMTX q3wk × 6 VP |
Randomize IDMTX (1 g/m2) + IDMP q4wk × 12 |
Randomize IDMTX (1 g/m2) + IDMP × 6 VM26/AC × 3 PVDAsp/AC × 3 (30 wk total) |
IDMTX q3wk × 6 VP (20 wk total), then Randomize IM MTX qwk × 28 PO MP(qd) VP |
AC/VM26 PVDox (8 wk total) |
VPDox/MP/Asp (27 wk total) |
IVMTX/IVMP × 6 VM26/AC × 3 D/AC × 3 (30 wk total) |
VM26/AC (3 wk total) then, |
HDAC/D VP16/AC IVMTX/IVMP VP/Cy/AC (52 wk total) |
| IDMTX q3wk × 6 + Asp qwk × 24 VP |
PO MTX/IDMP q2wk × 12 |
IDMTX (1 g/m2) + IDMP × 6 VM26/AC × 3 PVDAsp/AC × 3 (30 wk total) |
IDMTX (2.5 g/m2) + IDMP q4 wk X 12 |
IDMTX (1 g/m2) + IDMP × 6 HDAC/Asp × 3 PVDAsp/AC × 3 |
ddMTX qowk × 14 PO MP(qd) VP |
MTX/MP VP/Cy/AC VM26/AC (96 wk total) |
||||||
| IDMTX/AC q3wk × 6 VP |
IDMTX q2wk × 12 |
Pilot IDMTX (2.5 g/m2) + IDMP × 6 VM26/AC × 3 PVDAsp/AC × 3 (30 wk total) |
IDMTX (2.5 g/m2) + IDMP × 6 VM26/AC × 3 PVDAsp/AC × 3 |
IM MTX qwk × 28 PO MP(BID) VP |
||||||||
| IDMTX/AC q12wk × 6 VP |
IDMTX (2.5 g/m2) + IDMP × 6 HDAC/Asp × 3 PVDAsp/AC × 3 |
ddMTX qowk × 14 PO MP(BID) VP |
||||||||||
| Continuation | MTX/MP VP q16 wk |
MTX/MP | MTX/MP | MTX/MP VP q16 wk |
Randomize IM MTX PO MP(BID) |
MTX/MP |
Continue MP as Randomized IM MTX PO MP VP q16 wk × 4 |
Randomize AC/Cy PVDox/MP AC/VM26 ± Asp qwk × 20 |
MTX/MP VP q3 wk |
MTX/MP | MTX/MP PV q12 wk |
MTX/MP VP16/AC VP/Cy/AC (50 wk total) |
| IM MTX PO MP(qd) |
IM MTXPO MP(qd) VP q16 wk × 4 |
|||||||||||
|
CNS
prophylaxis |
TIT ab | TIT a | TIT ab | IT MTX ac | TITa | IT MTXabc | IT MTXac | TITa CXRTd or CSXRT b |
IT MTX/ACa CXRT |
TIT | TIT | TIT |
|
Duration of
Therapy |
156 wks from diagnosis |
130 wks of CCR |
130 wks of CCR | 130 wks from diagnosis |
130 wks from diagnosis |
130 wks of CCR | 130 wks from diagnosis |
104 wks from diagnosis |
104 wks of CCR |
130 wks of CCR |
156 wks from diagnosis |
104 wks of CCR |
P-prednisone, V-vincristine, Asp-aspariginase, D-daunomycin, Dox – doxorubicin, Cy-cytoxan, AC-cytosine arabinoside, MTX – methotrexate, MP-6 mercaptopurine, IDMTX-intermediate dose MTX (1 g/m2 except POG 9006/9405/9406),
IDMP-intermediate dose MP (1 g/m2), HDMTX – High dose MTX (5 g/m2), VM26 – teniposide, VP16 – etoposide, ddMTX – divided dose MTX, HDAC-high dose cytosine arabinoside
BID – twice daily, TIT intrathecal MTX/AC/hydrocortisone, IT – intrathecal, CCR- continuous complete remission
age adjusted,
craniospinal irradiation (CSXRT) for CNS3,
amended from TIT,
cranial irradiation (CXRT) for WBC>50,000
ALinC 14 (1986-1991)
POG 8602 evaluated four different schedules of antimetabolite- based therapy (4-6). Patients with lower risk disease had: age 1 - < 3 or 6 - < 11 years and white blood cell (WBC) < 10 × 103/μL, or age 3 - < 6 years and a WBC < 100 × 103/μL. Patients with higher risk disease had: age 1 - < 3 or 6 - < 11 years and WBC ≥ 10 × 103/μL, age 3 - < 6 years and WBC ≥ 100 × 103/μL, or age ≥ 11 years. Patients with central nervous system disease (CNS3) at diagnosis (blasts on cytospin of the cerebrospinal fluid with WBC ≥ 5 cells/μL), or liver and/or spleen extending below the umbilicus, or with pre-B ALL (cytoplasmic immunoglobulin positive) or with Philadelphia chromosome [t(9;22)] positive blasts were considered higher risk disease, regardless of age and WBC. Patients with lower risk disease were randomized to one of the four post-induction regimens: (A) intermediate dose methotrexate (IDMTX) 1 g/m2, every 3 weeks × 6; (B) IDMTX every 3 weeks × 6 and L-asparaginase (Asp; Merck) 25,000 IU/ m2 intramuscular (IM) weekly × 24; (C) IDMTX and cytosine arabinoside (AC) 1 g/m2, every 3 weeks × 6; or (D) IDMTX/AC every 12 weeks × 6. Patients with higher risk disease by age and WBC or by liver/spleen measurement were randomized to regimens B, C, or D. Patients with pre-B ALL were randomized to regimen B or C. Patients who had t(9;22) or CNS3 were non-randomly assigned to regimen C. All patients received CNS prophylaxis with triple intrathecal therapy (TIT) including methotrexate, cytosine arabinoside, and hydrocortisone. Patients with CNS3 at diagnosis received craniospinal irradiation.
AlinC 15 (1991-1994)
ALinC 15 evaluated three schedules of increased intensity methotrexate/mercaptopurine therapy for patients with lower risk disease (POG 9005)(7). Patients with higher risk disease received increased intensity methotrexate/mercaptopurine with or without the addition of epipodophyllotoxins, anthracyclines, and cytosine arabinoside (POG 9006)(8). Patients were risk classified based on age and WBC in the same manner as the POG 8602. Patients with CNS3, t(9;22), t(1:19) or testicular disease were classified as higher risk disease, regardless of age and WBC. Patients with higher risk disease based on age and WBC, no CNS3 disease, and a DNA index (flow cytometric measurement of the DNA of the leukemic blast compared to a normal cell) of > 1.16 were risk adjusted into the lower risk group and treated on the POG 9005. Patients enrolled on the POG 9005 were randomized into three regimens: (A) IDMTX (1g/m2) and intravenous intermediate dose mercaptopurine (IDMP) 1 g/m2 every 2 weeks × 12; (B) oral MTX (30 mg/m2 every 6 hours × 6) and IDMP every 2 weeks × 12; or (C) IDMTX every 2 weeks × 12. Patients enrolled on POG 9006 were randomized into two regimens: (A) IDMTX/IDMP every 2 weeks × 12 or (B) rotating cycles of IDMTX/IDMP, teniposide (VM26)/AC and prednisone/vincristine/daunomycin/Asp/AC (PVDAsp/AC). Patients with t(9;22), t(1;19), or testicular disease were non-randomly assigned to regimen A. Patients with t(9;22) could proceed to transplant at investigator’s choice. POG 9006 was later amended to pilot regimen C, which was identical to regimen B except that the IDMTX was 2.5 g/m2. All patients received CNS prophylaxis with TIT and patients with CNS3 at diagnosis received craniospinal irradiation.
ALinC 16 (1994-1999)
ALinC 16 risk stratified patients into lower risk (POG 9201)(9), standard risk (POG 9405 and 9605)(10-12), and higher risk disease (POG 9406). This series first stratified based on age and WBC by National Cancer Institute (NCI) risk grouping: (1) standard risk - age 1 - 9 and WBC < 50 × 103/μL, or (2) high risk – age ≥ 10 years or WBC ≥ 50 × 103/μL (13). Patients with NCI standard risk and either (1) uninformative cytogenetics and DNA index > 1.16, or (2) trisomies 4 and 10 were classified as having lower risk disease. Patients with NCI standard risk and (1) uninformative cytogenetics and DNA index ≤ 1.16 (or technically unsatisfactory DNA index), or (2) an abnormal karyotype but lacking trisomies 4 and 10; or NCI high risk and (1) uninformative cytogenetics and DNA index > 1.16, or (2) trisomies 4 and 10 were placed in the standard risk group. Patients with NCI high risk and (1) uninformative cytogenetics and DNA index ≤ 1.16 (or technically unsatisfactory DNA index) or (2) an abnormal karyotype but lacking trisomies 4 and 10; or patients with CNS3, t(1;19), t(4;11), or t(9;22) regardless of NCI risk group were placed in the higher risk group. POG 9201, designed to confirm previous outcomes, was a single regimen study utilizing IDMTX for patients with lower risk disease. POG 9405 randomized standard risk patients to two doses of IDMTX (1 versus 2.5 g/m2) during intensification and to daily versus twice daily MP during continuation. POG 9405 was closed early due to neurotoxicity and replaced by POG 9605; only results from POG 9605 are reported with the ALinC 16 data. POG 9605 randomized patients in a 2×2 factorial design to IM MTX (regimens A/C) versus divided dose (dd) MTX (regimens B/D) (14, 15) and daily (regimens A/B) versus twice daily (regimens C/D) MP. POG 9406 evaluated rotating cycles of relatively non-cross resistant agents and randomized in a 2×2 factorial design to IDMTX, 1 g/m2 (regimens A/B) versus 2.5 g/m2 (regimens C/D) and to VM26/AC (regimens A/C) versus high dose AC (3 g/m2 every 12 hours × 4) (HDAC, regimens B/D). All ALinC 16 patients initially received CNS prophylaxis with TIT. Sixteen percent of patients enrolled on 9406/9605 developed grade 3-4 neurotoxicity (60% consisting of seizures). Subsequently, all patients were switched to intrathecal (IT) MTX alone on 9201/9406/9605. Patients with CNS3 at diagnosis received craniospinal irradiation.
T- cell ALL
POG 8704(16) (1987-1992) randomized patients to +/− Asp (Merck) 25,000 IU/ m2 IM weekly × 20, beginning on day 99 of therapy. The backbone of therapy consisted of rotating combinations including antimetabolites, alkylating agents, anthracyclines, and epipodophyllotoxins. All patients received TIT for CNS prophylaxis. Patients with initial WBC > 50 × 103/μL received cranial irradiation and patients with CNS3 at diagnosis received craniospinal irradiation.
POG 9404(17) (1996-2001) randomized patients in a 2×2 factorial design to +/− high dose MTX (5 g/m2) × 4 doses and to +/− dexrazoxane prior to doxorubicin infusions (18-21). The backbone consisted of V/doxorubicin(Dox)/P/MP every 3 weeks and Asp weekly × 20. All patients received CNS prophylaxis with IT MTX/AC and cranial irradiation. Patients with CNS2 (blasts on cytospin but WBC < 5 cells/μL) or CNS3 at diagnosis received two additional doses of IT therapy.
Infant ALL
All three infant studies (POG 8398, 8493, and 9107) evaluated post-induction rotating cycles of combination chemotherapy. The POG 9407, which opened in 1996, continued as the Children’s Oncology Group Study P9407 in 2001, and is not reported here. POG 8398 cycles included intravenous IVMTX/IVMP, VM26/AC, and D/AC(22, 23). All infants received CNS prophylaxis with TIT; infants with CNS3 received additional doses of IT therapy during induction. POG 8493 cycles included VP16/AC, VP/Cy/AC, and MTX/MP(22, 23). All infants received CNS prophylaxis with TIT; infants with CNS3 received 4 additional doses of IT therapy during induction. POG 9107 cycles included HDAC/D, VP16/AC, IVMTX/IVMP, and VP/Cy/AC. All infants received CNS prophylaxis with TIT; no additional therapy was given to patients with CNS3 disease.
STATISTICAL CONSIDERATIONS
Event-free survival time was defined as the time from diagnosis to first event (induction failure, relapse, death, or second malignant neoplasm) or last contact for those who did not have an event. Overall survival time was defined as time from diagnosis to death or last contact. Event-free survival (EFS) and overall survival (OS) rates were computed by the method of Kaplan-Meier and were compared using the log-rank test(24). Cox proportional hazards regression was used to identify independent prognostic factors for EFS. For patients who achieved complete remission (CR), cumulative incidence rates of isolated CNS or any (isolated plus combined) CNS relapse, therapy-related second malignancies, and remission deaths, were computed and compared using Gray’s method adjusting for competing events(25). Data sets were frozen as of 1/21/2009 for the analyses.
RESULTS
The 10 year EFS rate improved significantly across eras for patients with B-precursor ALL enrolled on ALinC14 (1986-1991), ALinC15 (1991-1994), and ALinC16 (1992-1999): 66.7 ± 1.2%, 68.1 ± 1.4%, and 73.2 ± 2.1%, respectively (p < 0.0001; Fig 1A). The 10 year OS rates for the three eras were 78.8 ± 1.0%, 82.8 ± 1.1%, and 85.3 ± 1.7%, respectively (p < 0.0001; Fig 1B). Similar improvements were seen for patients with T-cell ALL on POG 8704 (1987-1992) and POG 9404 (1996-2001): 10 year EFS 49.1 ± 3.1% versus 72.2 ± 4.7%, respectively (p < 0.0001; Fig 2A); 10 year OS 55.3 ± 3.1% versus 78.8 ± 4.4%, respectively (p < 0.0001; Fig 2B). EFS rates at 10 years for infants enrolled on POG 8398, 8493, and 9107, were of 17.7± 7.2%, 22.4 ± 5.5%, and 31.9 ± 8.3%, respectively. This difference did not however reach statistical significance. Detailed outcomes are given below.
Figure 1.
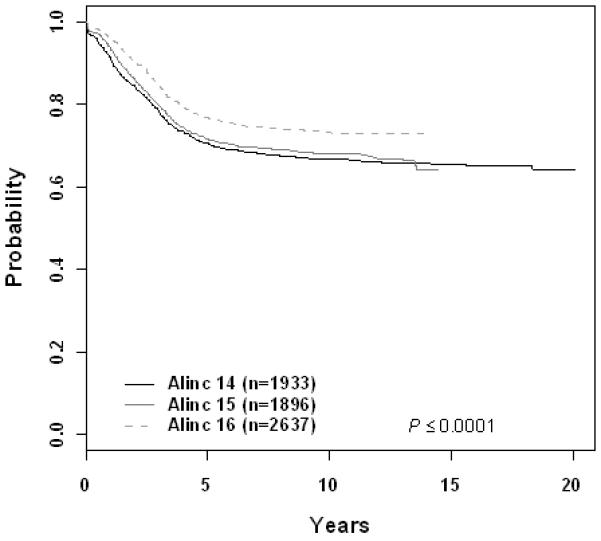
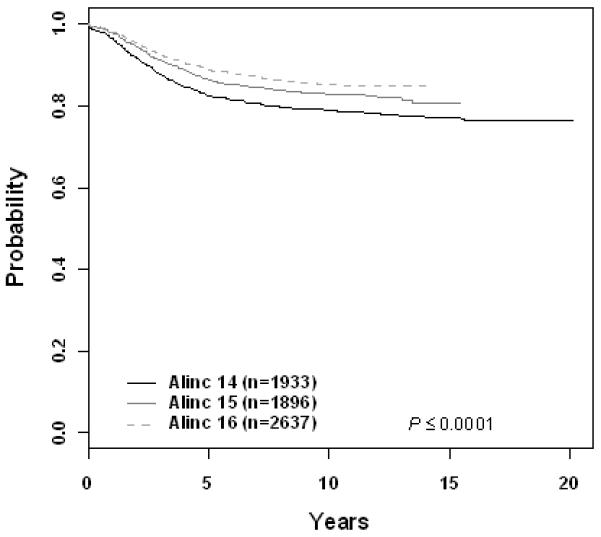
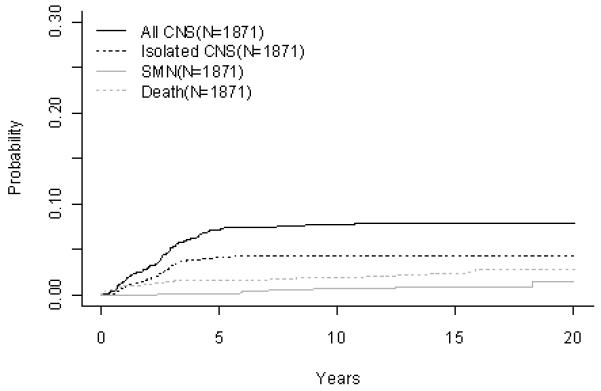
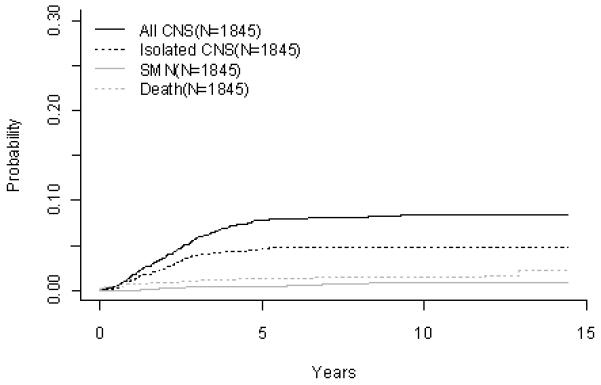
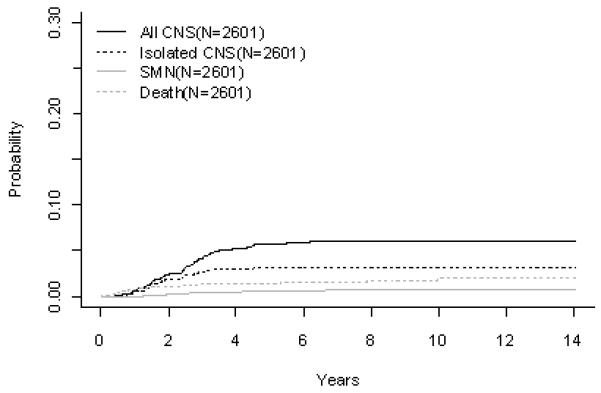
B-Precursor ALL (A) Event-Free Survival by Era, (B) Overall Survival by Era, (C) ALinC 14: Cumulative Incidence Rates of all CNS relapse, isolated CNS relapse, SMN, and death, (D) ALinC 15: Cumulative Incidence Rates of all CNS relapse, isolated CNS relapse, SMN, and death, (E) ALinC 16: Cumulative Incidence Rates of all CNS relapse, isolated CNS relapse, SMN, and death
Figure 2.
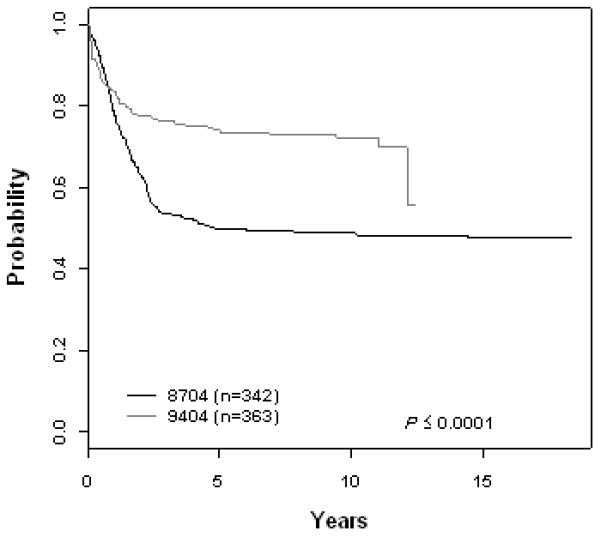
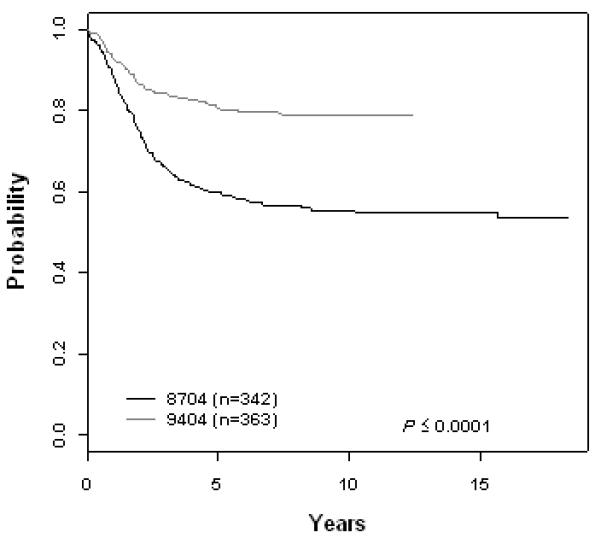
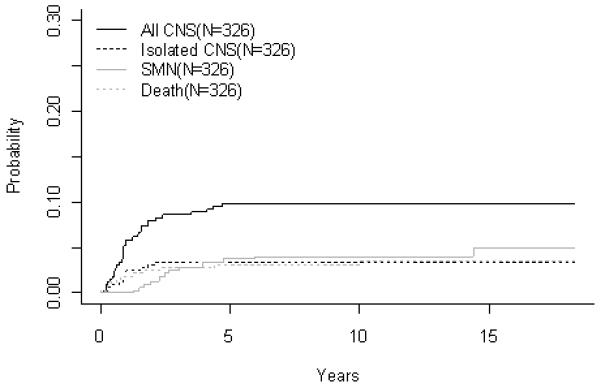
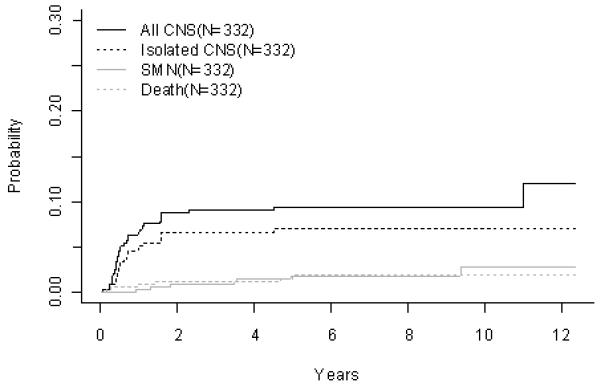
T-Cell ALL (A) Event-Free Survival by Study, (B) Overall Survival by Study, (C) POG 8704: Cumulative Incidence Rates of all CNS relapse, isolated CNS relapse, SMN, and death, (D) POG 9404: Cumulative Incidence Rates of all CNS relapse, isolated CNS relapse, SMN, and death
Protocol Specific Treatment Outcome
B-Precursor ALL
ALinC 14
For the 1933 evaluable patients enrolled on ALinC14 (1986-1991), POG 8602, the 10 year EFS and OS were 66.7 ± 1.2% and 78.8 ± 1.0%, respectively (Fig 1A, 1B). Table 2A gives EFS and OS for ALinc14. Table 2B summarizes the outcomes by randomized regimens on POG 8602. Patients with lower risk disease receiving IDMTX (regimen A) had an EFS of 76.3 ± 3.1% and did not have better outcomes with the addition of Asp or AC. Patients with higher risk disease had an EFS of 58% with both of the IDMTX/AC regimens. Patients with pre-B ALL treated with IDMTX/AC at 3 week intervals (regimen C) had an improved outcome compared to those treated with IDMTX/Asp (regimen B) EFS of 70.3 ± 2.9% versus 63.2 ± 3.6% respectively (p=0.0246). Table 2C gives a summary of response and first events overall and by NCI risk group. The NCI standard risk patients had a CR rate of 98.2%, while the higher risk patients had a CR rate of 93.4% on this series. Induction failure and induction death rates for the standard risk patients were 0.52% and 0.81%, respectively. Corresponding rates for the higher risk patients were 4.5% and 1.9%, respectively. Table 2D gives the cumulative incidence rates both overall and by study. The 10 year cumulative incidence rates for isolated CNS and any CNS relapses on ALinC 14 were 4.3 ± 0.5% and 7.7 ± 0.6%, respectively (Fig 1C). Cumulative incidence of secondary malignancies at 10 years was 0.6 ± 0.2%, and the incidence rate for remission deaths was 1.9 ± 0.3%.
Table 2A.
B-precursor ALL: Outcomes by Presenting Features
| Factors | No. of patients ** |
Event-free survival ± SE (%) | Overall survival ± SE (%) | ||||||
|---|---|---|---|---|---|---|---|---|---|
| Year 5 | Year 10 | Year 15 | p-value | Year 5 | Year 10 | Year 15 | p-value | ||
| Era | |||||||||
| ALinC14 | 1933 | 70.5 ± 1.1 | 66.7 ± 1.2 | 65.4 ± 1.7 | < 0.0001 | 82.3 ± 0.9 | 78.8 ± 1.0 | 77.1 ± 1.5 | < 0.0001 |
| ALinC15 | 1896 | 71.6 ± 1.1 | 68.1 ± 1.4 | 86.3 ± 0.8 | 82.8 ± 1.1 | 80.5 ± 35.5 | |||
| ALinC16 | 2637 | 76.9 ± 0.8 | 73.2 ± 2.1 | 88.6 ± 0.6 | 85.3 ± 1.7 | ||||
| NCI Risk | |||||||||
| Standard | 4468 | 79.2 ± 0.6 | 75.9 ± 0.9 | 74.1 ± 1.9 | < 0.0001 | 91.0 ± 0.4 | 88.3+ 0.7 | 86.8 ± 1.4 | < 0.0001 |
| High | 2052 | 61.3 ± 1.1 | 56.6 ± 1.7 | 55.3 ± 3.5 | 75.7 ± 1.0 | 70.3 ± 1.5 | 67.4 ± 3.2 | ||
| Gender | |||||||||
| Male | 3587 | 69.5 ± 0.8 | 65.2 ± 1.2 | 63.5 ± 2.4 | < 0.0001 | 84.7 ± 0.6 | 80.9 ± 0.9 | 79.0 ± 2.0 | < 0.0001 |
| Female | 2937 | 78.5 ± 0.8 | 75.6 ± 1.2 | 74.0 ± 2.3 | 87.9 ± 0.6 | 84.9 ± 0.9 | 83.1 ± 2.0 | ||
| Age at diagnosis | |||||||||
| 1-9 yrs | 5255 | 76.9 ± 0.6 | 73.5 ± 0.9 | 71.9 ± 1.8 | < 0.0001 | 89.3 ± 0.4 | 86.5 ± 0.7 | 85.1 ± 1.4 | < 0.0001 |
| ≥10 yrs | 1269 | 59.8 ± 1.4 | 54.7 ± 2.2 | 52.8 ± 4.9 | 73.1 ± 1.3 | 66.3 ± 2.1 | 62.1 ± 4.5 | ||
| Race | |||||||||
| White | 4691 | 75.3 ± 0.6 | 71.6 ± 0.9 | 69.7 ± 1.9 | < 0.0001 | 87.7 ± 0.5 | 84.3 ± 0.7 | 82.3 ± 1.5 | < 0.0001 |
| Black | 584 | 67.1 ± 2.0 | 63.7 ± 3.0 | 63.7 ± 6.9 | 77.1 ± 1.8 | 73.7 ± 2.7 | 72.7 ± 6.4 | ||
| Hispanic | 839 | 67.2 ± 1.7 | 63.5 ± 2.9 | 63.5 ± 7.2 | 82.2 ± 1.4 | 76.7 ± 2.5 | 75.7 ± 7.1 | ||
| Other | 410 | 75.7 ± 2.2 | 71.8 ± 3.3 | 70.0 ± 5.9 | 89.4 ± 1.6 | 88.0 ± 2.4 | 87.1 ± 4.3 | ||
| WBC×103/μl | |||||||||
| <10 | 3561 | 79.4 ± 0.7 | 75.7 ± 1.0 | 73.8 ± 2.1 | < 0.0001 | 90.2 ± 0.5 | 87.2 ± 0.8 | 85.3 ± 1.7 | < 0.0001 |
| 10-50 | 1947 | 70.7 ± 1.1 | 67.2 ± 1.6 | 65.5 ± 3.2 | 84.9 ± 0.8 | 80.6 ± 1.3 | 79.0 ± 2.8 | ||
| 50-100 | 571 | 65.2 ± 2.0 | 60.7 ± 3.0 | 60.1 ± 5.5 | 80.7 ± 1.7 | 77.2 ± 2.5 | 75.2 ± 4.8 | ||
| ≥100 | 441 | 49.7 ± 2.4 | 46.2 ± 3.7 | 45.3 ± 9.0 | 66.4 ± 2.3 | 62.4 ± 3.3 | 60.0 ± 7.7 | ||
| CNS status | |||||||||
| CNS negative | 6322 | 73.9 ± 0.6 | 70.3 ± 0.8 | 68.7 ± 1.7 | < 0.0001 | 86.5 ± 0.4 | 83.2 ± 0.7 | 81.4 ± 1.4 | < 0.0001 |
| CNS positive | 141 | 56.5 ± 4.2 | 52.2 ± 6.0 | 50.7 ± 9.5 | 69.3 ± 3.9 | 60.3 ± 5.9 | 55.1 ± 9.2 | ||
| DNA index | |||||||||
| 1.16-1.60 | 1538 | 83.5 ± 1.0 | 80.7 ± 1.5 | 79.4 ± 3.5 | < 0.0001 | 94.7 ± 0.6 | 92.2 ± 1.0 | 90.5 ± 2.5 | < 0.0001 |
| < 1.16 | 4383 | 69.5 ± 0.7 | 65.7 ± 1.1 | 63.9 ± 2.2 | 83.0 ± 0.6 | 79.3 ± 0.9 | 77.3 ± 1.9 | ||
| Other | 41 | 74.2 ± 7.1 | 68.7 ± 14.5 | 87.1 ± 5.4 | 81.7 ± 12.4 | ||||
| Trisomy 4 & 10 | |||||||||
| Present | 1100 | 86.2 ± 1.1 | 83.1 ± 1.6 | 82.4 ± 3.9 | < 0.0001 | 95.9 ± 0.6 | 94.0 ± 1.0 | 91.8 ± 2.7 | < 0.0001 |
| Absent | 4256 | 70.2 ± 0.7 | 66.3 ± 1.1 | 64.5 ± 2.2 | 83.5 ± 0.6 | 79.9 ± 0.9 | 78.0 ± 1.9 | ||
| TEL-AML1 | |||||||||
| Present | 244 | 86.2 ± 2.3 | 80.7 ± 8.6 | < 0.0001 | 96.2 ± 1.3 | 93.8 ± 4.9 | < 0.0001 | ||
| Absent | 682 | 72.1 ± 1.8 | 68.8 ± 5.7 | 84.5 ± 1.4 | 81.0 ± 4.8 | ||||
| t(9;22) | |||||||||
| Present | 128 | 24.9 ± 3.9 | 19.4 ± 4.7 | 17.0 ± 7.0 | < 0.0001 | 34.8 ± 4.3 | 32.7 ± 5.5 | 31.0 ± 9.7 | < 0.0001 |
| Absent | 5228 | 74.7 ± 0.6 | 71.0 ± 0.9 | 69.4 ± 2.0 | 87.3 ± 0.5 | 84.0 ± 0.7 | 82.1 ± 1.6 | ||
| t(1;19) | |||||||||
| Present | 259 | 74.5 ± 2.8 | 71.4 ± 4.6 | 71.4 ± 12.1 | 0.891 | 83.3 ± 2.4 | 80.9 ± 3.8 | 80.9 ± 10.2 | 0.377 |
| Absent | 5097 | 73.4 ± 0.6 | 69.7 ± 0.9 | 68.0 ± 2.0 | 86.2 ± 0.5 | 82.9 ± 0.8 | 80.9 ± 1.6 | ||
| t(4;11) | |||||||||
| Present | 67 | 47.8 ± 6.1 | 46.2 ± 11.3 | 46.2 ± 24.0 | < 0.0001 | 65.7 ± 5.8 | 64.1 ± 10.7 | 64.1 ± 19.2 | < 0.0001 |
| Absent | 6457 | 73.8 ± 0.6 | 70.1 ± 0.8 | 68.5 ± 1.7 | 86.4 ± 0.4 | 82.9 ± 0.7 | 81.0 ± 1.4 | ||
The total number of patients is 6524. Of these 58 patients that were on the ALinC17 pilot (run as part of the ALinc16 series) were excluded from the outcome analyses by series (total pts 6466). All 6524 pts are included in the analyses by presenting features. Some presenting features were missing for subsets of patients, and hence totals for each of them do not add up to 6524 pts.
Table 2B.
B-precursor ALL: Randomized Regimen Comparisons
| Regimen | No. of patients |
Event-free survival ± SE (%) | |||
|---|---|---|---|---|---|
| Year 5 | Year 10 | Year 15 | p-value | ||
| 8602 (lower risk) | |||||
| Early Pre-B | |||||
| A (Upfront IDM) | 228 | 77.8 ± 2.8 | 76.3 ± 3.1 | 74.0 ± 4.4 | 0.53 |
| B (Upfront IDM & ASP) | 295 | 79.6 ± 2.4 | 74.6 ± 2.8 | 71.7 ± 4.1 | |
| A (Upfront IDM) | 228 | 77.8 ± 2.8 | 76.3 ± 3.1 | 74.0 ± 4.4 | 0.25 |
| C (Upfront IDM AC) | 399 | 82.1 ± 1.9 | 79.2 ± 2.3 | 78.8 ± 3.2 | |
| C (Upfront IDM AC) | 399 | 82.1 ± 1.9 | 79.2 ± 2.3 | 78.8 ± 3.2 | 0.94 |
| D (IDM AC) | 117 | 84.4 ± 3.4 | 79.8 ± 4.0 | 78.3 ± 5.7 | |
| Pre-B | |||||
| B (Upfront IDM & ASP) | 205 | 65.2 ± 3.4 | 63.2 ± 3.6 | 59.6 ± 5.4 | 0.0246 |
| C (Upfront IDM AC) | 308 | 74.0 ± 2.5 | 70.3 ± 2.9 | 69.9 ± 4.2 | |
| 8602 (higher risk) | |||||
| C (Upfront IDM ARAC) | 354 | 64.8 ± 2.6 | 58.8 ± 3.0 | 58.0 ± 4.3 | 0.79 |
| D (IDM ARAC) | 96 | 61.3 ± 5.1 | 57.9 ± 5.6 | 57.9 ± 7.8 | |
| 9005 (lower risk) | |||||
| A (ID MTX, ID 6MP) | 330 | 80.2 ± 2.2 | 77.5 ± 2.7 | 0.0014 | |
| B (PO MTX, ID 6MP) | 336 | 71.4 ± 2.6 | 66.3 ± 3.1 | ||
| A (ID MTX, ID 6MP) | 311 | 78.3 ± 2.4 | 75.6 ± 3.2 | 0.30 | |
| C (ID MTX) | 307 | 81.2 ± 2.3 | 78.4 ± 3.1 | ||
| 9006 (higher risk) | |||||
| A (Intensive) | 266 | 60.4 ± 3.0 | 56.5 ± 4.0 | 0.24 | |
| B (Alternating) | 271 | 63.6 ± 3.0 | 60.0 ± 3.7 | ||
| 9201 (lower risk) | |||||
| Regimen A | 649 | 88.0 ± 1.3 | 85.7 ± 2.7 | ||
| 9605 (Average Risk) | |||||
| IMMTX | 526 | 76.9 ± 1.9 | 72.4 ± 7.8 | 0.11 | |
| ddMTX | 537 | 80.2 ± 1.8 | 74.5 ± 6.6 | ||
| 9605 (Average Risk) | |||||
| 6MP | 532 | 76.8 ± 1.9 | 71.5 ± 7.1 | 0.16 | |
| dd 6MP | 531 | 80.4 ± 1.8 | 76.5 ± 7.1 | ||
| 9605 (Average Risk) | |||||
| A (IM MTX/daily MP) | 266 | 71.1 ± 2.8 | 67.2 ± 3.1 | N/A1 | |
| B (dd MTX/daily MP) | 266 | 82.4 ± 2.4 | 75.9 ± 4.3 | ||
| C (IM MTX/twice daily MP) | 260 | 82.8 ± 2.4 | 77.8 ± 3 | ||
| D (dd MTX/twice daily MP) | 271 | 78 ± 2.6 | 75.3 ± 2.8 | ||
| 9406 (Higher Risk) | |||||
| IDMTX | 483 | 66.9 ± 2.2 | 61.2 ± 4.9 | 0.33 | |
| Higher dose IDMTX | 424 | 68.7 ± 2.3 | 66.2 ± 5.4 | ||
| 9406 (Higher Risk) | |||||
| No HDAC | 391 | 70.4 ± 2.4 | 66.3 ± 5.6 | 0.41 | |
| HDAC | 395 | 73 ± 2.3 | 67.5 ± 5.7 | ||
powered to answer a 2×2 factorial design, not powered to answer a 4 arm study
Table 2C.
B-precursor ALL: Response and Event Summary by Era
| B-lineage by Series | ||||
|---|---|---|---|---|
| Alinc 14 | Alinc 15 | Alinc 16 | Total | |
| All patients | 1276 | 1292 | 1963 | 4531 |
| First Event | ||||
| No Event | ||||
| Induction Failure | 33 | 26 | 18 | 77 |
| Induction Death | 22 | 13 | 14 | 49 |
| Relapse | 545 | 522 | 580 | 1647 |
| Isolated Marrow | 285 | 274 | 297 | 856 |
| Isolated CNS | 80 | 89 | 82 | 251 |
| Other | 180 | 159 | 201 | 540 |
| Second Malignancy | 15 | 15 | 19 | 49 |
| Remission Death | 42 | 28 | 43 | 113 |
| Response | 1871 | 1845 | 2601 | 6317 |
| Complete Remission | ||||
| Induction Failure/Death | 49 | 34 | 31 | 114 |
| Other | 13 | 17 | 5 | 35 |
| Total | 1933 | 1896 | 2637 | 6466 |
| NCI Standard Risk | 1003 | 992 | 1376 | 3371 |
| First Event | ||||
| No Event | ||||
| Induction Failure | 7 | 7 | 4 | 18 |
| Induction Death | 11 | 7 | 5 | 23 |
| Relapse | 299 | 316 | 325 | 940 |
| Isolated Marrow | 148 | 166 | 156 | 470 |
| Isolated CNS | 43 | 49 | 47 | 139 |
| Other | 108 | 101 | 122 | 331 |
| Second Malignancy | 10 | 9 | 10 | 29 |
| Remission Death | 27 | 12 | 13 | 52 |
| Response | 1333 | 1320 | 1722 | 4375 |
| Complete Remission | ||||
| Induction Failure/Death | 18 | 13 | 9 | 40 |
| Other | 6 | 10 | 2 | 18 |
| Total | 1357 | 1343 | 1733 | 4433 |
| NCI High Risk | 273 | 300 | 587 | 1160 |
| First Event | ||||
| No Event | ||||
| Induction Failure | 26 | 19 | 14 | 59 |
| Induction Death | 11 | 6 | 9 | 26 |
| Relapse | 246 | 206 | 255 | 707 |
| Isolated Marrow | 137 | 108 | 141 | 386 |
| Isolated CNS | 37 | 40 | 35 | 112 |
| Other | 72 | 58 | 79 | 209 |
| Second Malignancy | 5 | 6 | 9 | 20 |
| Remission Death | 15 | 16 | 30 | 61 |
| Response | 538 | 525 | 879 | 1942 |
| Complete Remission | ||||
| Induction Failure/Death | 31 | 21 | 22 | 74 |
| Other | 7 | 7 | 3 | 17 |
| Total | 576 | 553 | 904 | 2033 |
Table 2D.
B-precursor ALL: Cumulative Incidence Rates
| Patients | Event Type | # of patients |
Cumulative Incidence ± SE (%) | ||
|---|---|---|---|---|---|
| Year 5 | Year 10 | Year 15 | |||
| Alinc 14 | Any CNS Relapse | 1871 | 7.2 ± 0.6 | 7.7 ± 0.6 | 7.8 ± 0.6 |
| Isolated CNS Relapse | 1871 | 4.1 ± 0.5 | 4.3 ± 0.5 | 4.3 ± 0.5 | |
| Second Malignancy | 1871 | 0.2 ± 0.1 | 0.6 ± 0.2 | 0.8 ± 0.2 | |
| Remission Death | 1871 | 1.6 ± 0.3 | 1.9 ± 0.3 | 2.3 ± 0.4 | |
| Alinc 15 | Any CNS Relapse | 1845 | 7.8 ± 0.6 | 8.3 ± 0.6 | |
| Isolated CNS Relapse | 1845 | 4.6 ± 0.5 | 4.8 ± 0.5 | ||
| Second Malignancy | 1845 | 0.4 ± 0.2 | 0.8 ± 0.2 | ||
| Remission Death | 1845 | 1.3 ± 0.3 | 1.4 ± 0.3 | ||
| Alinc 16 | Any CNS Relapse | 2601 | 5.6 ± 0.5 | 6.1 ± 0.5 | |
| Isolated CNS Relapse | 2601 | 3.1 ± 0.3 | 3.2 ± 0.3 | ||
| Second Malignancy | 2601 | 0.6 ± 0.2 | 0.8 ± 0.2 | ||
| Remission Death | 2601 | 1.5 ± 0.2 | 2.0 ± 0.4 | ||
| POG 8602 | Any CNS Relapse | 1871 | 7.2 ± 0.6 | 7.7 ± 0.6 | 7.8 ± 0.6 |
| Isolated CNS Relapse | 1871 | 4.1 ± 0.5 | 4.3 ± 0.5 | 4.3 ± 0.5 | |
| Second Malignancy | 1871 | 0.2 ± 0.1 | 0.6 ± 0.2 | 0.8 ± 0.2 | |
| Remission Death | 1871 | 1.6 ± 0.3 | 1.9 ± 0.3 | 2.3 ± 0.4 | |
| POG 9005 | Any CNS Relapse | 1264 | 5.8 ± 0.7 | 6.5 ± 0.7 | |
| Isolated CNS Relapse | 1264 | 3.2 ± 0.5 | 3.5 ± 0.5 | ||
| Second Malignancy | 1264 | 0.4 ± 0.2 | 0.7 ± 0.2 | ||
| Remission Death | 1264 | 0.8 ± 0.3 | 0.8 ± 0.3 | ||
| POG 9006 | Any CNS Relapse | 581 | 12.1 ± 1.4 | 12.3 ± 1.4 | |
| Isolated CNS Relapse | 581 | 7.6 ± 1.1 | 7.6 ± 1.1 | ||
| Second Malignancy | 581 | 0.5 ± 0.3 | 1.2 ± 0.5 | ||
| Remission Death | 581 | 2.2 ± 0.6 | 2.8 ± 0.7 | ||
| POG 9201 | Any CNS Relapse | 650 | 3.7 ± 0.8 | 4.1 ± 0.8 | |
| Isolated CNS Relapse | 650 | 2.2 ± 0.6 | 2.2 ± 0.6 | ||
| Second Malignancy | 650 | 0.3 ± 0.2 | 0.3 ± 0.2 | ||
| Remission Death | 650 | 0.3 ± 0.2 | 0.3 ± 0.2 | ||
| POG 9605 | Any CNS Relapse | 1068 | 6.1 ± 0.7 | 6.8 ± 0.8 | |
| Isolated CNS Relapse | 1068 | 2.9 ± 0.5 | 3.2 ± 0.5 | ||
| Second Malignancy | 1068 | 0.7 ± 0.3 | 0.7 ± 0.3 | ||
| Remission Death | 1068 | 0.7 ± 0.2 | 1.0 ± 0.4 | ||
| POG 9406 | Any CNS Relapse | 883 | 6.5 ± 0.8 | 6.9 ± 0.9 | |
| Isolated CNS Relapse | 883 | 3.9 ± 0.7 | 4.0 ± 0.7 | ||
| Second Malignancy | 883 | 0.8 ± 0.3 | 1.2 ± 0.4 | ||
| Remission Death | 883 | 3.3 ± 0.6 | 4.4 ± 0.9 | ||
ALinC 15
EFS and OS at 10 years for the 1896 patients on ALinC15 (1991-1994), POG 9005/9006, were 68.1 ± 1.4% and 82.8 ± 1.1%, respectively (Fig 1A, 1B). EFS and OS for ALinC15 are summarized in Table 2A. Outcomes by randomized regimens are given in Table 2B. Patients with lower risk disease (POG 9005) had a better outcome with IDMTX/IDMP (regimen A) versus lower dose oral MTX/IDMP (regimen B), with an EFS of 77.5 ± 2.7% versus 66.3 ± 3.1% (p=0.0014), respectively. However, the addition of IDMP to IDMTX (regimen A) did not improve outcomes over IDMTX alone (regimen C). Acute neurotoxicity occurred in 7.8% of patients enrolled on the 9005, with 82% of events consisting of seizures. Other events included paresthesias, paresis, ataxia, aphasia, dysarthria, debilitating headaches, severe arachnoiditis, and choreoathetosis(26). The incidence of neurotoxicity was higher on regimens A and C (8.3% and 11.2%, respectively) than on regimen B (3.7%), p < 0.001. Magnetic resonance imaging (MRI) or computed tomography (CT) evidence of leukoencephalopathy was more commonly present in symptomatic patients on regimens A and C (75% and 77%, respectively) than on regimen B (15.4%), p< 0.001. Patients with higher risk disease (POG 9006) had an EFS of 57.1 ± 2.1% and a similar outcome whether they received IDMTX/IDMP or rotating agents. Table 2C gives a summary of response and first events overall and by NCI risk group for ALinC15. The NCI standard risk patients had a CR rate of 98.3%, while the higher risk patients had a CR rate of 94.9% on this series. Induction failure and induction death rates for the standard risk patients were 0.52% and 0.52%, respectively. Corresponding rates for the higher risk patients were 3.4% and 1.1%, respectively. The cumulative incidence rates on ALinC 15 for isolated CNS and any CNS relapses were 4.8 ± 0.5% and 8.3 ± 0.6%, respectively (Fig 1D, Table 2D). Cumulative incidence of secondary malignancies at 10 years was 0.8 ± 0.2%, and the incidence rate for remission deaths was 1.4 ± 0.3%. Cumulative incidence rates for secondary malignancies at 10 years were 0.7 ± 0.2% and 1.2 ± 0.5% on POG 9005 and 9006, respectively. Remission death rates on the two studies were 0.8 ± 0.3% and 2.8 ± 0.7%, respectively.
ALinC 16
For the 2637 evaluable patients enrolled on ALinC16 (1992-1999), POG 9201/9406/9605, the EFS and OS at 10 years were 73.2 ± 2.1% and 85.3 ± 1.7%, respectively (Fig 1A, 1B). Table 2A summarizes EFS and OS for ALinC16. Patients with lower risk disease and favorable prognostic indicators (DNA index > 1.16 or trisomies 4 and 10) had an EFS of 85.7 ± 2.7% (Table 2B) with IDMTX based therapy alone (POG 9201). Patients with standard risk disease (NCI standard risk with DNA index ≤ 1.16 or lacking trisomies 4 and 10; or NCI higher risk with DNA index > 1.16 or trisomies 4 and 10) had an EFS of 73.4 ± 1.8% (POG 9605). There was a significant interaction between the two randomizations on that study, resulting in insufficient power to determine the superior regimen. Patients with higher risk disease (POG 9406) had EFS of 63.5 ± 1.7% and did not have improved outcomes with the use of HDAC or higher dose MTX. Table 2C gives a summary of response and first events overall and by NCI risk for ALinC16. The NCI standard risk patients had a CR rate of 99.0%, while the higher risk patients had a CR rate of 97.2% on this series. Induction failure and induction death rates for the standard risk patients were 0.23% and 0.29%, respectively. Corresponding rates for the higher risk patients were 1.5% and 1.0%, respectively. Cumulative 10 year incidence rates on ALinC16 for isolated CNS and any CNS relapses were 3.2 ± 0.3% and 6.1 ± 0.5%, respectively (Fig 1E, Table 2D). Overall incidence of secondary malignancies and remission deaths were 0.8 ± 0.2% and 2.0 ± 0.4%, respectively. Incidence of secondary malignancies at ten years was 0.3 ± 0.2%, 0.7 ± 0.3%, and 1.2 ± 0.4%, respectively on POG 9201, 9605 and 9406. Remission death rates were 0.3 ± 0.2%, 1.0 ± 0.4%, and 4.4 ± 0.9%, respectively on the three studies.
T- cell ALL
POG 8704
For 342 evaluable patients enrolled on POG 8704 (1987-1992), the 10 year EFS and OS were 49.1 ± 3.1% and 55.3 ± 3.1%, respectively (Fig 2A, 2B, Table 3A). Patients had an improved outcome with the addition of weekly asparaginase, with 10 year EFS rates of 61.8 ± 4.3% versus 42.7 ± 4.6% (p=0.0012) (Table 3B). Table 3C gives a summary of response and first events for this study. The CR rate at the end of induction was 95.3%. Induction failure and induction death rates were 1.5% and 2.6%, respectively. Overall cumulative incidence rates at 10 years for isolated CNS and any CNS relapses were 3.4 ± 1.0% and 9.8 ± 1.7%, respectively (Fig 2C, Table 3D). Overall rate for secondary malignancies at 10 years was 4.0 ± 1.1%. Secondary malignancy rates at 10 years were 6.3 ± 1.9% and 1.9 ± 1.1% for patients receiving or not receiving weekly asparaginase (p=0.11). There were a total of 14 secondary malignancies (10 acute myeloid leukemia (AML), 1 myelodysplastic syndrome (MDS), 1 Acute Lymphoid Leukemia, 1 angiocentric lymphoma, and 1 primitive neuroectodermal tumor). Overall 10 year remission death rate was 3.1 ± 1.0%.
Table 3A.
T-cell ALL: Outcomes by Presenting Features
| Factors | No. of patients |
Event-free survival ± SE (%) | Overall survival ± SE (%) | ||||||
|---|---|---|---|---|---|---|---|---|---|
| Year 5 | Year 10 | Year 15 | p-value | Year 5 | Year 10 | Year 15 | p-value | ||
| Study | |||||||||
| 8704 | 342 | 49.7 ± 2.7 | 49.1 ± 3.1 | 47.5 ± 5.9 | < 0.0001 | 59.8 ± 2.7 | 55.3 ± 3.1 | 54.9 ± 5.0 | < 0.0001 |
| 9404 | 363 | 74.0 ± 2.4 | 72.2 ± 4.7 | 80.8 ± 2.2 | 78.8 ± 4.4 | ||||
| NCI Risk | |||||||||
| Standard | 176 | 71.5 ± 3.5 | 69.7 ± 4.8 | 69.7 ± 10.6 | 0.0028 | 80.0 ± 3.1 | 75.0 ± 4.5 | 75.0 ± 10.4 | 0.0050 |
| High | 529 | 59.0 ± 2.2 | 58.2 ± 3.3 | 54.4 ± 6.0 | 67.5 ± 2.1 | 64.6 ± 3.2 | 64.1 ± 5.9 | ||
| Gender | |||||||||
| Male | 530 | 58.4 ± 2.2 | 57.5 ± 3.3 | 53.6 ± 6.5 | 0.0002 | 68.4 ± 2.1 | 64.4 ± 3.1 | 63.9 ± 6.5 | 0.0055 |
| Female | 175 | 73.6 ± 3.4 | 71.8 ± 4.9 | 71.8 ± 8.8 | 77.5 ± 3.2 | 75.7 ± 4.7 | 75.7 ± 8.4 | ||
| Age at diagnosis | |||||||||
| 1-9 yrs | 412 | 64.2 ± 2.4 | 63.1 ± 3.3 | 59.6 ± 6.2 | 0.1005 | 73.8 ± 2.2 | 70.0 ± 3.1 | 69.5 ± 6.1 | 0.0253 |
| ≥10 yrs | 293 | 59.3 ± 3.0 | 58.0 ± 5.2 | 56.9 ± 10.0 | 66.1 ± 2.9 | 63.4 ± 5.0 | 63.4 ± 9.9 | ||
| Race | |||||||||
| White | 48 | 9 62.7 ± 2.2 | 62.1 ± 3.1 | 58.8 ± 5.7 | 0.3594 | 72.0 ± 2.1 | 68.9 ± 2.9 | 68.5 ± 5.6 | 0.2000 |
| Black | 119 | 58.7 ± 4.8 | 57.5 ± 8.4 | 57.5 ± 15.3 | 63.7 ± 4.7 | 61.8 ± 8.1 | 61.8 ± 15.6 | ||
| Hispanic | 61 | 67.2 ± 6.2 | 67.2 ± 11.1 | 67.2 ± 38.5 | 73.6 ± 5.9 | 71.1 ± 10.2 | 71.1 ± 27.0 | ||
| Other | 36 | 58.3 ± 8.2 | 48.6 ± 20.1 | 69.4 ± 7.7 | 55.8 ± 15.2 | ||||
| WBC×103/μl | |||||||||
| <50 | 299 | 69.1 ± 2.8 | 68.0 ± 4.2 | 67.2 ± 9.1 | 0.0011 | 76.4 ± 2.5 | 72.2 ± 4.0 | 72.2 ± 8.7 | 0.004 |
| 50-100 | 126 | 61.6 ± 4.5 | 61.6 ± 5.9 | 53.4 ± 12.2 | 72.8 ± 4.1 | 70.2 ± 5.5 | 70.2 ± 11.6 | ||
| ≥100 | 280 | 54.9 ± 3.0 | 53.4 ± 4.5 | 51.5 ± 7.3 | 63.4 ± 3.0 | 60.4 ± 4.0 | 59.5 ± 7.6 | ||
| CNS status | |||||||||
| CNS negative | 639 | 61.8 ± 2.0 | 60.6 ± 2.9 | 58.2 ± 5.7 | 0.5555 | 70.9 ± 1.9 | 67.2 ± 2.8 | 66.8 ± 5.6 | 0.8611 |
| CNS positive | 66 | 65.2 ± 5.9 | 65.2 ± 8.0 | 60.1 ± 13.4 | 68.2 ± 5.8 | 66.6 ± 8.0 | 66.6 ± 13.6 | ||
Table 3B.
T-Cell ALL: Randomized Regimen Comparisons
| Regimen | No. of patients | Event-free survival ± SE (%) | |||
|---|---|---|---|---|---|
| Year 5 | Year 10 | Year 15 | p-value | ||
| 8704 | |||||
| No Asp | 157 | 42.7 ± 4.0 | 42.7 ± 4.6 | 40.7 ± 7.4 | 0.0012 |
| Asp | 160 | 63.1 ± 3.8 | 61.8 ± 4.3 | 60.2 ± 6.6 | |
| 9404 (HDMTX) | |||||
| No HDMTX | 151 | 67.5 ± 3.9 | 65.8 ± 7.3 | 0.029 | |
| HDMTX | 148 | 80.2 ± 3.4 | 78.0 ± 6.0 | ||
| 9404 (Dexrazoxane) | |||||
| No Dexrazoxane | 176 | 74.4 ± 3.4 | 73.0 ± 6.4 | 0.85 | |
| Dexrazoxane | 187 | 73.6 ± 3.4 | 71.3 ± 7.0 | ||
Table 3C.
T-Cell ALL: Response and Event Summary by Study
| T-Cell by Study | Total | ||
|---|---|---|---|
| 8704 | 9404 | ||
| First Event | 165 | 262 | 428 |
| No Event | |||
| Induction Failure | 5 | 27 | 32 |
| Induction Death | 9 | 3 | 12 |
| Relapse | 138 | 57 | 195 |
| Isolated Marrow | 72 | 13 | 85 |
| Isolated CNS | 11 | 23 | 34 |
| Other | 55 | 21 | 76 |
| Second Malignancy | 14 | 8 | 22 |
| Remission Death | 11 | 6 | 17 |
| Response | 326 | 332 | 658 |
| Complete Remission | |||
| Induction Failure/Death | 14 | 30 | 44 |
| Other | 2 | 1 | 3 |
| Total | 342 | 363 | 705 |
Table 3D.
T-Cell ALL: Cumulative Incidence Rates
| Study | Event Type | # of patients |
Cumulative Incidence ± SE (%) | P-value | ||
|---|---|---|---|---|---|---|
| Year 5 | Year 10 | Year 15 | ||||
| 8704 | Any CNS Relapse | 326 | 8.9 ± 1.6 | 9.8 ± 1.7 | 9.8 ± 1.7 | |
| Isolated CNS Relapse | 326 | 3.4 ± 1.0 | 3.4 ± 1.0 | 3.4 ± 1.0 | ||
| Second Malignancy | 326 | 3.4 ± 1.0 | 4 ± 1.1 | 4.9 ± 1.4 | ||
| Remission Death | 326 | 2.8 ± 0.9 | 3.1 ± 1.0 | 3.5 ± 1.0 | ||
| 9404 | Any CNS Relapse | 332 | 9.4 ± 1.6 | 9.4 ± 1.6 | ||
| Isolated CNS Relapse | 332 | 7.0 ± 1.4 | 7.0 ± 1.4 | |||
| Second Malignancy | 332 | 1.8 ± 0.7 | 2.8 ± 1.2 | |||
| Remission Death | 332 | 1.9 ± 0.8 | 1.9 ± 0.8 | |||
| 8704 | ||||||
| No ASP | Second Malignancy | 156 | 1.9 ± 1.1 | 1.9 ± 1.1 | 3.9 ± 2.2 | 0.11 |
| ASP | 159 | 5.7 ± 1.8 | 6.3 ± 1.9 | 6.3 ± 1.9 | ||
| 9404 (HDMTX) | ||||||
| No HDMTX | Second Malignancy | 136 | 2.2 ± 1.3 | 4.1 ± 2.3 | 0.81 | |
| HDMTX | 138 | 2.3 ± 1.3 | 2.3 ± 1.3 | |||
| 9404 (Dexrazoxane) | ||||||
| No Dexrazoxane | Second Malignancy | 159 | 1.3± 0.9 | 1.3 ± 0.9 | 0.15 | |
| Dexrazoxane | 173 | 2.3 ± 1.2 | 4.2 ± 2.2 | |||
POG 9404
For 363 evaluable patients enrolled on POG 9404 (1996-2001), the 10 year EFS and OS were 72.2 ± 4.7% and 78.8 ± 4.4%, respectively (Fig 2A, 2B, Table 3A). Patients had an improved outcome with the addition of HDMTX with a 10 year EFS of 78.0 ± 6.0% versus 65.8 ± 7.3% (p=0.029; Table 3B). The addition of dexrazoxane had no impact on EFS. Table 3C gives a summary of response and first events for this study. The CR rate at the end of induction was 91.5%. Induction failure and induction death rates were 7.4% and 0.83%, respectively. The 10 year cumulative incidence rates for isolated CNS and any CNS relapses were 7.0 ± 1.4% and 9.4 ± 1.6%, respectively (Fig 2D, Table 3D). Secondary malignancies developed in 2.8 ± 1.2%, and remission deaths occurred in 1.9 ± 0.8% of patients. There were a total of 8 secondary malignancies (3 AML, 1 MDS, 2 non-Hodgkin lymphoma, 1 right cranial tumor, and 1 medulloblastoma). The 10 year cumulative incidence of secondary malignancies were 1.3 ± 0.9% and 4.2 ± 2.2% on the No Dexrazoxane vs Dexrazoxane regimens (p=0.15). Secondary malignancy rates on the No HDMTX vs HDMTX regimens were 4.1 ± 2.3% and 2.3 ± 1.3% (p=0.81), respectively.
Infant ALL
For the 164 evaluable infants on POG 8398 (1984-1990), POG 8493 (1984-1990), and POG 9107 (1991-1993), the overall 10 year EFS and OS rates were 24.1 ± 4.0% and 33.7 ± 4.4%, respectively (Fig 3A). The CR rates (Table 4B) at the end of induction on the three studies were 93.9%, 89.3%, and 89.4%, respectively. Induction failure and induction death rates on 8398 were 6.1% and 0%. Study 8493 had induction failure and induction death rates of 2.4% and 7.1%, respectively. On study 9107, these rates were 2.1% and 6.4%. The overall cumulative incidence rates for isolated CNS and any CNS relapses were 3.4 ± 1.5% and 14.3 ± 2.9%, respectively (Fig 3B, Table 4C). Although outcomes improved progressively over the three studies (EFS 17.7 ± 7.2%, 22.4 ± 5.5%, 31.9 ± 8.3%; Table 4A) this did not reach statistical significance (p=0.66). There were no secondary malignancies seen on either POG 8398 or 8493. Secondary malignancies developed in 3.3 ± 3.4% of patients enrolled on POG 9107. Overall remission death rate at 10 years was 8.2 ± 2.3%.
Figure 3.
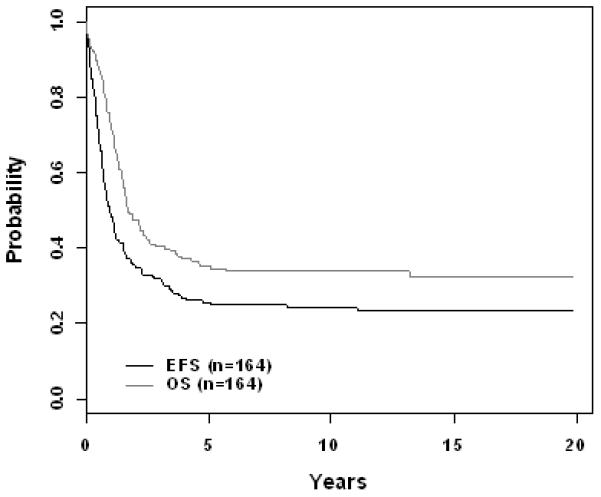
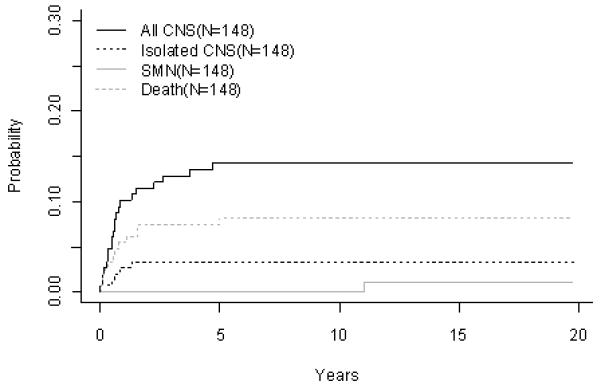
Infant ALL (A) EFS and Overall Survival, (B) Cumulative Incidence Rates of all CNS relapse, isolated CNS relapse, SMN, and death
Table 4B.
Infant ALL: Response and Event Summary by Study
| Infants by Study | Total | |||
|---|---|---|---|---|
| 8398 | 8493 | 9107 | ||
| First Event | 6 | 19 | 14 | 39 |
| No Event | ||||
| Induction Failure | 2 | 2 | 1 | 5 |
| Induction Death | 0 | 6 | 3 | 9 |
| Relapse | 23 | 51 | 24 | 98 |
| Isolated Marrow | 13 | 35 | 17 | 65 |
| Isolated CNS | 0 | 3 | 2 | 5 |
| Other | 10 | 13 | 5 | 28 |
| Second Malignancy | 0 | 0 | 1 | 1 |
| Remission Death | 2 | 6 | 4 | 12 |
| Response | 31 | 75 | 42 | 148 |
| Complete Remission | ||||
| Induction Failure/Death | 2 | 7 | 4 | 13 |
| Other | 0 | 2 | 1 | 3 |
| Total | 33 | 84 | 47 | 164 |
Table 4C.
Infant ALL: Cumulative Incidence Rates
| Study | Event Type | # of patients |
Cumulative Incidence ± SE (%) | ||
|---|---|---|---|---|---|
| Year 5 | Year 10 | Year 15 | |||
| Overall | Any CNS Relapse | 148 | 14.3 ± 2.9 | 14.3 ± 2.9 | 14.3 ± 2.9 |
| Isolated CNS Relapse | 148 | 3.4 ± 1.5 | 3.4 ± 1.5 | 3.4 ± 1.5 | |
| Second Malignancy | 148 | 0 ± 0 | 0 ± 0 | 1.1 ± 1.1 | |
| Remission Death | 148 | 7.4 ± 2.2 | 8.2 ± 2.3 | 8.2 ± 2.3 | |
| 8398 | Any CNS Relapse | 31 | 16.7 ± 7.2 | ||
| Isolated CNS Relapse | 31 | 0 ± 0 | |||
| Second Malignancy | 31 | 0 ± 0 | |||
| Death | 31 | 6.5 ± 4.6 | |||
| 8493 | Any CNS Relapse | 75 | 14.7 ± 4.1 | 14.7 ± 4.1 | 14.7 ± 4.1 |
| Isolated CNS Relapse | 75 | 4.0 ± 2.3 | 4.0 ± 2.3 | 4.0 ± 2.3 | |
| Second Malignancy | 75 | 0 ± 0 | 0 ± 0 | 0 ± 0 | |
| Death | 75 | 6.7 ± 2.9 | 8.1 ± 3.2 | 8.1 ± 3.2 | |
| 9107 | Any CNS Relapse | 42 | 11.9 ± 5.1 | 11.9 ± 5.1 | |
| Isolated CNS Relapse | 42 | 4.8 ± 3.3 | 4.8 ± 3.3 | ||
| Second Malignancy | 42 | 0 ± 0 | 3.3 ± 3.4 | ||
| Death | 42 | 9.5 ± 4.6 | 9.5 ± 4.6 | ||
Table 4A.
Infant ALL: Outcomes by Presenting Features
| Factors | No. of patients |
Event-free survival ± SE (%) | Overall survival ± SE (%) | ||||||
|---|---|---|---|---|---|---|---|---|---|
| Year 5 | Year 10 | Year 15 | p-value | Year 5 | Year 10 | Year 15 | p-value | ||
| Study | |||||||||
| 8398 | 33 | 17.7 ± 7.2 | 17.7 ± 7.2 | 0.658 | 36.4 ± 8.8 | 36.4 ± 9.2 | 36.4 ± 16.8 | 0.558 | |
| 8493 | 84 | 25.0 ± 4.8 | 22.4 ± 5.5 | 22.4 ± 7.4 | 31.6 ± 5.2 | 30.3 ± 6.0 | 28 ± 7.9 | ||
| 9107 | 47 | 31.9 ± 7.0 | 31.9 ± 8.3 | 40.2 ± 7.3 | 38.0 ± 9.0 | ||||
| Cell lineage | |||||||||
| B | 159 | 25.7 ± 3.6 | 24.3 ± 4.1 | 23.3 ± 7.7 | 0.657 | 35.5 ± 3.9 | 34.2 ± 4.5 | 32.7 ± 7.8 | 0.434 |
| T | 5 | 20.0 ± 17.9 | 20.0 ± 17.9 | 20.0 ± 17.9 | 20.0 ± 17.9 | ||||
| Gender | |||||||||
| Male | 79 | 26.5 ± 5.1 | 25.2 ± 5.8 | 25.2 ± 12.6 | 0.263 | 40.5 ± 5.6 | 37.9 ± 6.2 | 37.9 ± 10.6 | 0.151 |
| Female | 85 | 24.7 ± 4.9 | 23.2 ± 5.4 | 21.3 ± 9.4 | 30.0 ± 5.2 | 30.0 ± 6.3 | 26.2 ± 11.3 | ||
| Race | |||||||||
| White | 117 | 26.4 ± 4.3 | 24.4 ± 4.7 | 22.9 ± 9.0 | 0.532 | 34.0 ± 4.5 | 32.1 ± 5.0 | 30.3 ± 8.4 | 0.857 |
| Black | 20 | 30.0 ± 10.3 | 30.0 ± 10.3 | 30.0 ± 10.3 | 35.0 ± 10.7 | 35.0 ± 10.7 | 35.0 ± 20.0 | ||
| Hispanic | 20 | 25.0 ± 9.7 | 25.0 ± 15.3 | 25.0 ± 22.0 | 40.0 ± 11.0 | 40.0 ± 21.9 | 40.0 ± 31.0 | ||
| Other | 7 | 0 ± 0 | 42.9 ± 22.9 | 42.9 ± 22.9 | |||||
| WBC×103/μl | |||||||||
| <50 | 61 | 47.3 ± 6.7 | 43.4 ± 7.9 | 40.7 ± 15.7 | <0.0001 | 60.5 ± 6.5 | 56.9 ± 7.6 | 53.1 ± 12.9 | < 0.0001 |
| 50-100 | 29 | 13.8 ± 6.4 | 13.8 ± 6.4 | 13.8 ± 12.8 | 20.7 ± 7.5 | 20.7 ± 9.2 | 20.7 ± 18.4 | ||
| ≥100 | 73 | 12.3 ± 3.9 | 12.3 ± 4.4 | 12.3 ± 8.2 | 19.8 ± 4.8 | 19.8 ± 5.4 | 19.8 ± 10.3 | ||
| CNS status | |||||||||
| CNS negative | 112 | 27.6 ± 4.4 | 25.6 ± 4.9 | 24.1 ± 8.6 | 0.855 | 38.9 ± 4.8 | 37.0 ± 5.5 | 34.8 ± 8.9 | 0.409 |
| CNS positive | 37 | 27.0 ± 7.7 | 27.0 ± 8.7 | 27.0 ± 23.1 | 29.7 ± 7.9 | 29.7 ± 9.4 | 29.7 ± 24.9 | ||
| t(4;11) | |||||||||
| Present | 52 | 15.4 ± 5.4 | 15.4 ± 5.8 | 15.4 ± 14.2 | 0.017 | 25.0 ± 6.3 | 22.9 ± 7.1 | 22.9 ± 14.2 | 0.024 |
| Absent | 112 | 30.2 ± 4.5 | 28.2 ± 5.1 | 26.8 ± 9.4 | 39.7 ± 4.8 | 38.8 ± 5.5 | 36.8 ± 9.3 | ||
Treatment Results According to Presenting Features
Univariate and multivariate Cox regression analyses were conducted by presenting features for B-precursor, T-cell, and Infant ALL. Factors considered include, NCI risk, gender, age at diagnosis, race, WBC at diagnosis, CNS status, DNA index, presence of trisomies 4 and 10, TEL-AML1, t(9;22), t(1;19), and t(4;11) translocations. All data (except for TEL-AML1 status) were available for most of the patients. TEL-AML1 status was known only for 926 patients on the ALinC16 series of studies for B-precursor ALL.
B-precursor ALL
Univariate analyses are summarized in Table 2A for B-precursor ALL. Multivariate analyses (Table 5) included NCI risk, gender, age, race, WBC, CNS status, DI, presence of translocations t(9;22), t(1;19), t(4;11), and trisomies 4 and 10. A total of 4959 patients were included in the analysis. Since TELAML1 status was missing for most of the patients, it was excluded from the multivariate analyses. Males and patients >10 years of age had worse outcomes (HR: 1.5 and 1.64, respectively). Hispanics and blacks had significantly lower EFS compared to whites (HR: 1.39 and 1.29, respectively). Patients with WBC < 10 × 103/μL have significantly better outcomes compared to those with higher values; those with WBC>100 × 103/μL had the worst outcomes. Having CNS disease, or the t(9;22) translocation was associated with poor outcomes (HR: 1.34 and 3.73, respectively). Patients with DI ≤ 1.16 had worse outcomes compared those with 1.16 < DI <1.60. Presence of trisomies 4 and 10 (HR:0.74) and t(1;19) (HR:0.71) were associated with good prognosis. Presence of t(4;11) did not reach statistical significance (HR: 1.37).
T-cell ALL
Univariate analyses are summarized in Table 3A for T-cell ALL. All 705 patients were part of the multivariate Cox regression analyses which included NCI risk, gender, age, race, WBC, and CNS status as prognostic factors (Table 5). Gender was a significant predictor of EFS (HR: 1.744, p=0.0005); males had worse outcomes. No other factors were predictive in the multivariate model.
Infant ALL
Univariate analyses are summarized in Table 4A for Infant ALL. Multivariate analyses included lineage (B-precursor vs T), gender, race, WBC, CNS status, and presence of t(4;11) translocation in the model (Table 5). A total of 148 patients had complete data and were included in the analysis. Patients with 50<WBC<100 × 103/μL (HR: 2.132, p=0.0093) and WBC≥100 × 103/μL (HR: 2.45, p=0.0003) had worse outcomes compared to WBC<50 × 103/μL. Presence of the t(4;11) translocation tended to predict poorer outcomes (HR: 1.53, p=0.056).
DISCUSSION
B- Precursor ALL
ALinC 14
All patients received antimetabolite based therapy which was less effective for patients with higher risk disease. No regimen was superior in either risk group, although it should be noted that patients with higher risk disease were not randomized into regimen A (IDMTX alone). In subgroup analysis, patients with pre-B ALL had an improved outcome with every 3 week IDMTX/AC versus every 3 week IDMTX and weekly asparaginase. Outcomes in the IDMTX/Asp group did not correlate with number of doses of asparaginase received.
ALinC 15
POG 9005 intensified therapy by compression of MTX intensification cycles to every 2 weeks (from every 3 weeks on the 8602). In addition IDMP was added to the courses of either IDMTX or PO MTX during intensification. IDMTX/IDMP was superior to PO MTX/IDMP(7). However, these results showed no improvement over those obtained on the POG 8602 with IDMTX every 3 weeks without IDMP. In addition, results with IDMTX alone (regimen C) were similar to results of IDMTX/IVMP (regimen A). These data indicated that IDMP did not add benefit to IDMTX. The incidence of acute neurotoxicity was increased on regimens A and C of this trial that included IDMTX every 2 weeks (8.3% and 11.2%, respectively) compared to PO MTX/IDMP, 3.7% (p < 0.001). The addition of IDMP to IDMTX did not increase the incidence of acute neurotoxicity over IDMTX alone(26). Neurotoxicity on the POG 9005 was higher than the 2.6% reported on the POG 8602 where IDMTX was administered every 3 weeks(5). Further analyses of the neurotoxicity (mostly seizures) suggested that this was due to a combination of: a. an increased frequency and cumulative dose of IDMTX, b. an increased methotrexate:leucovorin ratio and c. the timing of leucovorin in relation to the intrathecal treatments . There was no evidence implicating an increased risk of neurotoxicity with the use of TIT.
Early results of POG 9006 suggested an improved outcome for higher risk patients treated with rotating cycles of agents, resulting in early trial closure. However, longer follow-up showed no differences in EFS, although toxicity was increased with the rotating cycles of agents (8). This may indicate that agents chosen to test the Goldie-Coldman hypothesis were either not equally effective or were cross resistant. Additionally, the more intensive every 2 week IDMTX/IDMP regimen, like on the POG 9005, provided no improvement in outcome compared to higher risk patients treated on POG 8602.
ALinC 16
POG 9201, utilizing regimen A of POG 8602 confirmed our earlier favorable results for very low risk patients treated with IDMTX based therapy(9, 27-29). The POG 9405 was closed early due to excessive grade 2-4 neurotoxicity (Common toxicity Criteria 2.0) (19% of patients, n=57). More than half of these events were seizures. Other events included cerebellar and motor deficits, cognitive dysfunction, headaches, and significant fatigue. Neither the efficacy nor toxicity of the two MTX schedules could be fully evaluated (10). POG 9605 replaced this study and returned to the intensification regimen A of POG 8602(14, 15). Excessive neurotoxicity was again seen, and the study was amended to replace TIT with IT MTX. Further analysis of neurotoxicity, however, suggested the cause was more complex (see discussion of ALinC 15 above). There was no evidence implicating an increased risk of neurotoxicity with the use of TIT. Although there were no significant differences in outcomes within the MTX and MP study questions, when reviewed by regimen significant differences were evident, with the IM MTX/twice daily MP and dd MTX/daily MP arms demonstrating improved survivals. This suggested that the manner in which these antimetabolites were given influenced outcomes. However, because this trial was designed as a 2×2 factorial, it was not powered to compare the four arms(11, 12).
Higher risk patients, POG 9406, received rotating cycles of non-cross resistant agents based on the early results of POG 9006. Patients were randomized between two doses of IDMTX based on results suggesting that higher steady state MTX levels would improve outcomes and HDAC/Asp versus VM26/AC in an attempt to improve outcomes without increasing the risk of secondary malignancies associated with epipodophyllotoxins. Neither of these strategies improved outcomes.
ALinC 14-16
The incidence of isolated CNS relapse in patients enrolled on ALinC 14-16 was 3.2 to 4.8% at 10 years, with prophylactic age adjusted IT therapy for all patients and irradiation for patients with CNS3 disease at diagnosis. Despite more aggressive therapy, the incidence of isolated CNS relapse was increased in higher versus lower risk patients, 5.8 ± 0.5% versus 3.2 ± 0.3%, respectively, emphasizing the more resistant nature of the leukemic clone in higher risk patients and suggesting that either the chemotherapeutic agents or their dosing regimens did not provide adequate CNS penetration. A decrease in isolated CNS relapse rate was seen on the POG 9406 with the use of high dose antimetabolite therapy versus intermediate dose antimetabolite therapy utilized on the POG 9006. Other agents with increased CNS penetrance, such as dexamethasone, were not used in these studies, but may play an important role in higher risk disease. Secondary malignancies remained about 1% across all studies, despite the use of epipodophyllotoxins in higher risk patients. Despite increasing intensity across the ALinC 14-16, the percent of patients who failed initial therapy but achieved long term survival remained constant at approximately 50%. This is similar to findings of the Children’s Cancer Group, where survival after relapse was not different between earlier and later trials conducted between 1988 and 2002(30).
T-cell ALL
POG 8704
The backbone of rotating agents for this protocol was chosen based on previous combinations that were shown to be effective against T- cell ALL and non-Hodgkin lymphoma(18, 31-33). The addition of asparaginase improved outcome, consistent with outcomes seen on the Dana-Farber Cancer Institute (DFCI) series, where consolidation included both additional doxorubicin and asparaginase(34, 35). Although the rate of secondary malignancies was increased in patients with T-cell ALL receiving asparaginase, this did not reach statistical significance. However, it should be noted that this was a subgroup analysis, and when all patients enrolled on the POG 8704, T-cell ALL and lymphoblastic lymphoma(16), were included in the analysis the use of asparaginase was associated with a significantly increased rate of secondary malignancies. This is consistent with other studies where epipodophyllotoxins were combined with asparaginase(36). Because epipodophyllotoxins are highly bound to plasma proteins, an asparaginase induced decrease in protein synthesis may result in an increase in the unbound epipodophyllotoxin fraction in the plasma and an increased risk of secondary malignancies(37).
POG 9404
The backbone of POG 9404 was based on the Dana-Farber Cancer Institute (DFCI) 87-01, which lacked epipodophyllotoxins but contained anthracyclines that resulted in late cardiac toxicity. The HDMTX regimens had improved outcomes, due to decreased induction failures and CNS relapse rates, and resulted in early closure of the No HDMTX regimens(17). The addition of dexrazoxane did not have an adverse impact on the 10 year EFS. However, late effects of dexrazoxane on cardiac function are still to be determined. Secondary malignancies occurred in 2.8 ± 1.2% of patients, and were not associated with the use of HDMTX or dexrazoxane.
POG 8704/9404
The incidence of isolated CNS relapse in patients enrolled on POG 8704 and on POG 9404 was 3.4% and 7.0%, respectively, at 10 years. All patients received prophylactic age adjusted IT therapy and all CNS3 and higher risk patients on 8704, as well as all patients enrolled on POG 9404, received CNS irradiation. Despite the universal application of CNS irradiation on POG 9404, CNS relapse rates did not decrease on this study. This may be a reflection of the limited use of prophylactic IT therapy on the POG 9404 versus 8704, where patients received fewer doses of IT, 10 versus 17, respectively. Overall secondary malignancies in T-cell ALL (2.8 to 4%) remained higher than that for patients with B-precursor ALL. Only 25% of relapsed T-ALL patients achieved long-term survival, significantly lower than similar patients with B-precursor disease.
Infant ALL
Throughout this period results were poor. Although there is a suggestion of improving outcomes, this did not reach statistical significance. The incidence of isolated CNS relapse in patients on POG 8398/8493/9107 was 3.4 ± 1.5% at 10 years, despite using no CNS irradiation due to the certainly of a poor neurocognitive outcome. There was one secondary malignancy at year 12 among the 148 patients in remission on these studies.
Prognostic Indicators
Prognostic indicators identified on the POG studies are similar to those found by other investigators. Significantly, however, gender remained a prognostic indicator on both the B-precursor and T-cell ALL studies. On each of the POG studies, male and female patients were treated with the same duration of therapy. Gender has also been shown to be a prognostic indicator by others, who have chosen to treat males for a year longer than females(38-41). However, it is unclear whether longer duration of therapy or early intensification of therapy actually improves outcomes for males.
CONCLUSION
Over this series of studies we investigated the use of antimetabolite based and rotating agent therapy for the treatment of ALL. The use of IDMTX (1 g/m2) every three weeks improved outcomes for patients with B-precursor ALL. However, with the exception of HDMTX for the treatment of T-cell ALL, further intensification strategies were unsuccessful, suggesting that we have maximized our ability to eradicate drug resistant clones with antimetabolite based therapy. Additionally, the use of rotating agents had limited impact on higher risk disease. Although this may indicate that the Goldie-Coldman hypothesis is incorrect, it is also possible that the choice or schedule of the agents was not optimal, as other studies utilizing rotating agents have improved outcomes(39, 42, 43). The POG series has demonstrated that patients with lower risk B-precursor ALL can be successfully treated with antimetabolite based therapy, and future studies will need to balance further improvements in outcome against the toxicities associated with therapy. Patients with higher risk B-precursor ALL require therapy directed at early identification(44-48) and treatment of the resistant clone, and may include agents not explored on this series, such as dexamethasone or alkylators. A key strategy to improving the outcome of very high risk patients will be to identify recurrent genetic lesions present in patient subgroups and develop molecularly targeted therapies directed at these lesions, as has been so effective in Ph+ ALL. Patients with T-cell ALL and infant ALL will require novel agents(49, 50), as there is limited ability to further intensify therapy.
Supplementary Material
Table 5.
Multivariate Analyses
| Patients | N | Factor | p-value | Hazard Ratio |
|---|---|---|---|---|
| Infant ALL | 148 | LINEAGE: T vs. B | 0.2284 | 2.162 |
| GENDER: M vs. F | 0.4931 | 0.868 | ||
| RACE: Black vs. White | 0.3654 | 0.759 | ||
| RACE: Hispanic vs. White | 0.9852 | 1.006 | ||
| RACE: Other vs. White | 0.6489 | 1.229 | ||
| WBC: 50-100 vs. <50 | 0.0093 | 2.132 | ||
| WBC: ≥100 vs. <50 | 0.0003 | 2.448 | ||
| CNS status: Pos vs. Neg | 0.8113 | 1.062 | ||
| MLL: Present vs. Absent | 0.0564 | 1.527 | ||
| Non-Infant B-precursor ALL | 4959 | NCI Standard vs. High risk | 0.7534 | 0.960 |
| GENDER: M vs. F | <.0001 | 1.498 | ||
| AGE: >10 vs. 1-9 | <.0001 | 1.644 | ||
| RACE: Black vs. White | 0.0026 | 1.287 | ||
| RACE: Hispanic vs. White | <.0001 | 1.386 | ||
| RACE: Other vs. White | 0.9544 | 0.993 | ||
| WBC: 10-50 vs. <10 | <.0001 | 1.425 | ||
| WBC: 50-100 vs. <10 | <.0001 | 1.630 | ||
| WBC: ≥100 vs. <10 | <.0001 | 2.456 | ||
| CNS status: Pos vs. Neg | 0.0382 | 1.342 | ||
| DI: <=1.16 vs. 1.16-1.60 | 0.0002 | 1.415 | ||
| DI: Other vs. 1.16-1.60 | 0.3406 | 1.413 | ||
| t(9;22): Present vs. Absent | <.0001 | 3.734 | ||
| t(1;19): Present vs. Absent | 0.0079 | 0.710 | ||
| t(4;11): Present vs. Absent | 0.0884 | 1.367 | ||
| TRISOMY4/10: Present vs. Absent | 0.0049 | 0.740 | ||
| Non-Infant T-cell ALL | 705 | NCI Standard vs. NCI High | 0.6604 | 0.894 |
| GENDER: M vs. F | 0.0005 | 1.744 | ||
| AGE: >10 vs. 1-9 | 0.1782 | 1.226 | ||
| RACE: Black vs. White | 0.1472 | 1.264 | ||
| RACE: Hispanic vs. White | 0.8702 | 0.962 | ||
| RACE: Other vs. White | 0.2570 | 1.327 | ||
| WBC: 50-100 vs. <50 | 0.5622 | 1.141 | ||
| WBC: ≥100 vs. <50 | 0.0649 | 1.437 | ||
| CNS status: Pos vs. Neg | 0.3244 | 0.809 |
Acknowledgments
Supported by NIH. Research is supported by POG Grants CA 30969 and CA 29139, as well as the Chair’s Grant U10 CA98543 and the Statistics and Data Center Grant U10 CA98413 of the Children’s Oncology Group from the National Cancer Institute, National Institutes of Health, Bethesda, MD, USA.
GRANT WEBSITE STATEMENT: A complete listing of grant support for research conducted by CCG and POG before initiation of the COG grant in 2003 is available online at: http://www.childrensoncoogygroup.org/admin/grantinfo.htm SPH is the Ergen Family Chair in Pediatric Cancer.
Footnotes
CONFLICT OF INTEREST NW has been on the advisory board for both EUSA and Sanofi-Aventis Pharmaceuticals and received compensation of each meeting attended (one each).
The opinions and assertions contained herein are the private views of the author(s) and are not to be construed as the official policy or position of the U.S. Government, the Department of Defense, or the Department of the Air Force.
REFERENCES
- 1.Fast Stats: An interactive tool for access to SEER cancer statistics. Surveillance Research Program, National Cancer Institute; [Accessed on 8-25-2009]. http://seer.cancer.gov/faststats. [Google Scholar]
- 2.Pulte D, Gondos A, Brenner H. Trends in 5- and 10-year Survival After Diagnosis with Childhood Hematologic Malignancies in the United States, 1990-2004. J Natl Cancer Inst. 2008 Sep 17;100(18):1301–1309. doi: 10.1093/jnci/djn276. 2008. [DOI] [PubMed] [Google Scholar]
- 3.Hunger S, Devidas M, Camitta B, Gaynon P, Winick N, Reaman G, et al. Improved Survival For Children With Acute Lymphoblastic Leukemia (ALL) From 1990–2005: A Report From The Childrens Oncology Group (COG) Wiley-Liss, Inc; Berlin, Germany: 2008. p. 31. SIOP 3-6 Oct. [DOI] [PMC free article] [PubMed] [Google Scholar]
- 4.Harris MB, Shuster JJ, Pullen DJ, Borowitz MJ, Carroll AJ, Behm FG, et al. Consolidation therapy with antimetabolite-based therapy in standard-risk acute lymphocytic leukemia of childhood: a Pediatric Oncology Group Study. J Clin Oncol. 1998;16(8):2840–2847. doi: 10.1200/JCO.1998.16.8.2840. [DOI] [PubMed] [Google Scholar]
- 5.Harris MB, Shuster JJ, Pullen J, Borowitz MJ, Carroll AJ, Behm FG, et al. Treatment of children with early pre-B and pre-B acute lymphocytic leukemia with antimetabolite-based intensification regimens: a Pediatric Oncology Group Study. Leukemia. 2000 Sep;14(9):1570–1576. doi: 10.1038/sj.leu.2401886. [DOI] [PubMed] [Google Scholar]
- 6.Land VJ, Shuster JJ, Crist WM, Ravindranath Y, Harris MB, Krance RA, et al. Comparison of two schedules of intermediate-dose methotrexate and cytarabine consolidation therapy for childhood B-precursor cell acute lymphoblastic leukemia: a Pediatric Oncology Group study. J Clin Oncol. 1994 Sep 1;12(9):1939–1945. doi: 10.1200/JCO.1994.12.9.1939. 1994. [DOI] [PubMed] [Google Scholar]
- 7.Mahoney DH, Shuster J, Nitschke R, Lauer SJ, Winick N, Steuber CP, et al. Intermediate-dose intravenous methotrexate with intravenous mercaptopurine is superior to repetitive low-dose oral methotrexate with intravenous mercaptopurine for children with lower-risk B-lineage acute lymphoblastic leukemia: a Pediatric Oncology Group phase III trial. J Clin Oncol. 1998;16(1):246–254. doi: 10.1200/JCO.1998.16.1.246. [DOI] [PubMed] [Google Scholar]
- 8.Lauer SJ, Shuster JJ, Mahoney DH, Jr., Winick N, Toledano S, Munoz L, et al. A comparison of early intensive methotrexate/mercaptopurine with early intensive alternating combination chemotherapy for high-risk B-precursor acute lymphoblastic leukemia: a Pediatric Oncology Group phase III randomized trial. Leukemia. 2001 Jul;15(7):1038–1045. doi: 10.1038/sj.leu.2402132. [DOI] [PubMed] [Google Scholar]
- 9.Chauvenet AR, Martin PL, Devidas M, Linda SB, Bell BA, Kurtzberg J, et al. Antimetabolite therapy for lesser-risk B-lineage acute lymphoblastic leukemia of childhood: a report from Children’s Oncology Group Study P9201. Blood. 2007;110(4):1105–1111. doi: 10.1182/blood-2006-12-061689. [DOI] [PMC free article] [PubMed] [Google Scholar]
- 10.Rodes S, Bell BA, Abish SB, Pullen J, Chauvenet A, Kurtzberg J, et al. A Report of the Event-Free Survival (EFS) and Neurotoxicity for Children with Newly Diagnosed Standard Risk Acute Lymphoblastic Leukemia (ALL) on Pediatric Oncology Group (POG) Protocol 9405. ASH Annual Meeting Abstracts. 2005 Nov 16;106(11):882. 2005. [Google Scholar]
- 11.Bell BA, Abish SB, Chauvenet A, Kurtzberg J, Pullen J, Devidas M, et al. A Report of the Event Free Survival (EFS) for Children with Newly Diagnosed Standard Risk Acute Lymphoblastic Leukemia (ALL) Treated on Pediatric Oncology Group (POG) Protocol 9605. ASH Annual Meeting Abstracts. 2005 Nov 16;106(11):875. 2005. [Google Scholar]
- 12.Carson TY, Bell BA, Erdmann G, Bostrom B, Camitta BM, Devidas M. Possible Advantage of Twice-Daily 6-Mercaptopurine Dosing in Children with Acute Lymphoblastic Leukemia (ALL) ASH Annual Meeting Abstracts. 2007 Nov 16;110(11):851. 2007. [Google Scholar]
- 13.Smith M, Arthur D, Camitta B, Carroll A, Crist W, Gaynon P, et al. Uniform approach to risk classification and treatment assignment for children with acute lymphoblastic leukemia. J Clin Oncol. 1996 Jan 1;14(1):18–24. doi: 10.1200/JCO.1996.14.1.18. 1996. [DOI] [PubMed] [Google Scholar]
- 14.Winick N, Shuster JJ, Bowman WP, Borowitz M, Farrow A, Jacaruso D, et al. Intensive oral methotrexate protects against lymphoid marrow relapse in childhood B-precursor acute lymphoblastic leukemia. J Clin Oncol. 1996 Oct 1;14(10):2803–2811. doi: 10.1200/JCO.1996.14.10.2803. 1996. [DOI] [PubMed] [Google Scholar]
- 15.Winick NJ, McKenna RW, Shuster JJ, Schneider NR, Borowitz MJ, Bowman WP, et al. Secondary acute myeloid leukemia in children with acute lymphoblastic leukemia treated with etoposide. J Clin Oncol. 1993 Feb 1;11(2):209–217. doi: 10.1200/JCO.1993.11.2.209. 1993. [DOI] [PubMed] [Google Scholar]
- 16.Amylon MD, Shuster J, Pullen J, Berard C, Link MP, Wharam M, et al. Intensive high-dose asparaginase consolidation improves survival for pediatric patients with T cell acute lymphoblastic leukemia and advanced stage lymphoblastic lymphoma: a Pediatric Oncology Group study. Leukemia. 1999;13(3):335–342. doi: 10.1038/sj.leu.2401310. [DOI] [PubMed] [Google Scholar]
- 17.Asselin B, Shuster J, Amylon M, Halperin E, Hutchinson R, Lipshultz S, et al. Improved Event-Free Survival (EFS) with High Dose Methotrexate (HDM) in T-Cell Lymphoblastic Leukemia (T-ALL) and Advanced Lymphoblastic Lymphoma (T-NHL): a Pediatric Oncology Group (POG) Study. J Clin Oncol (Meeting Abstracts) 2001;20:1464. [Google Scholar]
- 18.Clavell LA, Gelber RD, Cohen HJ, Hitchcock-Bryan S, Cassady JR, Tarbell NJ, et al. Four-agent induction and intensive asparaginase therapy for treatment of childhood acute lymphoblastic leukemia. N Engl J Med. 1986 Sep 11;315(11):657–663. doi: 10.1056/NEJM198609113151101. [DOI] [PubMed] [Google Scholar]
- 19.Silverman LB, Declerck L, Gelber RD, Dalton VK, Asselin BL, Barr RD, et al. Results of Dana-Farber Cancer Institute Consortium protocols for children with newly diagnosed acute lymphoblastic leukemia (1981-1995) Leukemia. 2000 Dec;14(12):2247–2256. doi: 10.1038/sj.leu.2401980. [DOI] [PubMed] [Google Scholar]
- 20.Reiter A, Schrappe M, Ludwig WD, Hiddemann W, Sauter S, Henze G, et al. Chemotherapy in 998 unselected childhood acute lymphoblastic leukemia patients. Results and conclusions of the multicenter trial ALL-BFM 86. Blood. 1994;84(9):3122–3133. [PubMed] [Google Scholar]
- 21.Jones RL. Utility of dexrazoxane for the reduction of anthracycline-induced cardiotoxicity. Expert Review of Cardiovascular Therapy. 2008;6(10):1311–1317. doi: 10.1586/14779072.6.10.1311. [DOI] [PubMed] [Google Scholar]
- 22.Lauer SJ, Camitta BM, Leventhal BG, Mahoney D, Shuster JJ, Kiefer G, et al. Intensive alternating drug pairs after remission induction for treatment of infants with acute lymphoblastic leukemia: A Pediatric Oncology Group Pilot Study. J Pediatr Hematol Oncol. 1998;20(3):229–233. doi: 10.1097/00043426-199805000-00008. [DOI] [PubMed] [Google Scholar]
- 23.Frankel LS, Ochs J, Shuster JJ, Dubowy R, Bowman WP, Hockenberry-Eaton M, et al. Therapeutic trial for infant acute lymphoblastic leukemia: the Pediatric Oncology Group experience (POG 8493) J Pediatr Hematol Oncol. 1997 Jan-Feb;19(1):35–42. doi: 10.1097/00043426-199701000-00005. [DOI] [PubMed] [Google Scholar]
- 24.Kaplan E, Meier P. Nonparametric estimation from incomplete observations. J Am Stat Assoc. 1958;53:457–481. [Google Scholar]
- 25.Gray R. A class of K-sample tests for comparing the cumulative incidence of a competing risk. The Annals of Statistics. 1988:1141–1154. [Google Scholar]
- 26.Mahoney DH, Jr., Shuster JJ, Nitschke R, Lauer SJ, Steuber CP, Winick N, et al. Acute neurotoxicity in children with B-precursor acute lymphoid leukemia: an association with intermediate-dose intravenous methotrexate and intrathecal triple therapy--a Pediatric Oncology Group study. J Clin Oncol. 1998 May 1;16(5):1712–1722. doi: 10.1200/JCO.1998.16.5.1712. 1998. [DOI] [PubMed] [Google Scholar]
- 27.Harris MB, Shuster JJ, Carroll A, Look AT, Borowitz MJ, Crist WM, et al. Trisomy of leukemic cell chromosomes 4 and 10 identifies children with B-progenitor cell acute lymphoblastic leukemia with a very low risk of treatment failure: a Pediatric Oncology Group study. Blood. 1992 Jun 15;79(12):3316–3324. 1992. [PubMed] [Google Scholar]
- 28.Schrappe M, Reiter A, Zimmermann M, Harbott J, Ludwig W-D, Henze G, et al. Long-term results of four consecutive trials in childhood ALL performed by the ALL-BFM study group from 1981 to 1995. Leukemia. 2000;14(12):2205–2222. doi: 10.1038/sj.leu.2401973. [DOI] [PubMed] [Google Scholar]
- 29.Hann I, Vora A, Harrison G, Harrison C, Eden O, Hill F, et al. Determinants of outcome after intensified therapy of childhood lymphoblastic leukaemia: results from Medical Research Council United Kingdom acute lymphoblastic leukaemia XI protocol. British Journal of Haematology. 2001;113(1):103–114. doi: 10.1046/j.1365-2141.2001.02668.x. [DOI] [PubMed] [Google Scholar]
- 30.Nguyen K, Devidas M, Cheng SC, La M, Raetz EA, Carroll WL, et al. Factors influencing survival after relapse from acute lymphoblastic leukemia: a Children’s Oncology Group study. Leukemia. 2008;22(12):2142–2150. doi: 10.1038/leu.2008.251. [DOI] [PMC free article] [PubMed] [Google Scholar]
- 31.Lauer SJ, Pinkel D, Buchanan GR, Sartain P, Cornet JM, Krance R, et al. Cytosine arabinoside/cyclophosphamide pulses during continuation therapy for childhood acute lymphoblastic leukemia. Potential selective effect in T-cell leukemia. Cancer. 1987;60(10):2366–2371. doi: 10.1002/1097-0142(19871115)60:10<2366::aid-cncr2820601003>3.0.co;2-u. [DOI] [PubMed] [Google Scholar]
- 32.Steuber CP, Levy GJ, Nix WL, Shepherd DA, Starling KA, Fernbach DJ. Use of L-asparaginase and cytosine arabinoside for refractory acute lymphocytic leukemia with particular reference to T-cell leukemia. Med Pediatr Oncol. 1978;5(1):33–38. doi: 10.1002/mpo.2950050105. [DOI] [PubMed] [Google Scholar]
- 33.Dahl GV, Rivera G, Pui CH, Mirro J, Jr., Ochs J, Kalwinsky DK, et al. A novel treatment of childhood lymphoblastic non-Hodgkin’s lymphoma: early and intermittent use of teniposide plus cytarabine. Blood. 1985 Nov 1;66(5):1110–1114. 1985. [PubMed] [Google Scholar]
- 34.Goldberg JM, Silverman LB, Levy DE, Dalton VK, Gelber RD, Lehmann L, et al. Childhood T-Cell Acute Lymphoblastic Leukemia: The Dana-Farber Cancer Institute Acute Lymphoblastic Leukemia Consortium Experience. J Clin Oncol. 2003 Oct 1;21(19):3616–3622. doi: 10.1200/JCO.2003.10.116. 2003. [DOI] [PubMed] [Google Scholar]
- 35.Moghrabi A, Levy DE, Asselin B, Barr R, Clavell L, Hurwitz C, et al. Results of the Dana-Farber Cancer Institute ALL Consortium Protocol 95-01 for children with acute lymphoblastic leukemia. Blood. 2007 Feb 1;109(3):896–904. doi: 10.1182/blood-2006-06-027714. 2007. [DOI] [PMC free article] [PubMed] [Google Scholar]
- 36.Pui CH, Relling MV, Behm FG, Hancock ML, Boyett JM, Raimondi SC, et al. L-asparaginase may potentiate the leukemogenic effect of the epipodophyllotoxins. Leukemia. 1995;9(10):1680–1684. [PubMed] [Google Scholar]
- 37.Felix CA. Secondary leukemias induced by topoisomerase-targeted drugs. Biochimica et biophysica acta. 1998;1400(1-3):233–255. doi: 10.1016/s0167-4781(98)00139-0. [DOI] [PubMed] [Google Scholar]
- 38.Hutchinson RJ, Gaynon PS, Sather H, Bertolone SJ, Cooper HA, Tannous R, et al. Intensification of Therapy for Children With Lower-Risk Acute Lymphoblastic Leukemia: Long-Term Follow-Up of Patients Treated on Children’s Cancer Group Trial 1881. J Clin Oncol. 2003 May 1;21(9):1790–1797. doi: 10.1200/JCO.2003.03.009. 2003. [DOI] [PubMed] [Google Scholar]
- 39.Nachman JB, Sather HN, Sensel MG, Trigg ME, Cherlow JM, Lukens JN, et al. Augmented post-induction therapy for children with high-risk acute lymphoblastic leukemia and a slow response to initial therapy. N Engl J Med. 1998;338(23):1663–1671. doi: 10.1056/NEJM199806043382304. [DOI] [PubMed] [Google Scholar]
- 40.Lange BJ, Bostrom BC, Cherlow JM, Sensel MG, La MKL, Rackoff W, et al. Double-delayed intensification improves event-free survival for children with intermediate-risk acute lymphoblastic leukemia: a report from the Children’s Cancer Group. Blood. 2002 Feb 1;99(3):825–833. doi: 10.1182/blood.v99.3.825. 2002. [DOI] [PubMed] [Google Scholar]
- 41.Gaynon PS, Trigg ME, Heerema NA, Sensel MG, Sather HN, Hammond GD, et al. Children’s Cancer Group trials in childhood acute lymphoblastic leukemia: 1983–1995. 12. Vol. 14. Nature Publishing Group; Leukemia: 2000. pp. 2223–2233. [DOI] [PubMed] [Google Scholar]
- 42.Bostrom BC, Sensel MR, Sather HN, Gaynon PS, La MK, Johnston K, et al. Dexamethasone versus prednisone and daily oral versus weekly intravenous mercaptopurine for patients with standard-risk acute lymphoblastic leukemia: a report from the Children’s Cancer Group. Blood. 2003;101(10):3809–3817. doi: 10.1182/blood-2002-08-2454. [DOI] [PubMed] [Google Scholar]
- 43.Seibel NL, Steinherz PG, Sather HN, Nachman JB, Delaat C, Ettinger LJ, et al. Early postinduction intensification therapy improves survival for children and adolescents with high-risk acute lymphoblastic leukemia: a report from the Children’s Oncology Group. Blood. 2008;111(5):2548–2555. doi: 10.1182/blood-2007-02-070342. [DOI] [PMC free article] [PubMed] [Google Scholar]
- 44.Mullighan CG, Downing JR. Genome-wide profiling of genetic alterations in acute lymphoblastic leukemia: recent insights and future directions. Leukemia. 2009;23(7):1209–18. doi: 10.1038/leu.2009.18. [DOI] [PubMed] [Google Scholar]
- 45.de Haas V, Dee R, Cheroutre G, van den Berg H, van der Schoot CE. Gene expression profile of slowly responding subclones might represent different profiles already at diagnosis and might be used for prediction of outcome. Leukemia. 2008;23(4):816–819. doi: 10.1038/leu.2008.315. [DOI] [PubMed] [Google Scholar]
- 46.Ratei R, Basso G, Dworzak M, Gaipa G, Veltroni M, Rhein P, et al. Monitoring treatment response of childhood precursor B-cell acute lymphoblastic leukemia in the AIEOP-BFM-ALL 2000 protocol with multiparameter flow cytometry: predictive impact of early blast reduction on the remission status after induction. Leukemia. 2008;23(3):528–534. doi: 10.1038/leu.2008.324. [DOI] [PubMed] [Google Scholar]
- 47.Flohr T, Schrauder A, Cazzaniga G, Panzer-Grumayer R, van der Velden V, Fischer S, et al. Minimal residual disease-directed risk stratification using real-time quantitative PCR analysis of immunoglobulin and T-cell receptor gene rearrangements in the international multicenter trial AIEOP-BFM ALL 2000 for childhood acute lymphoblastic leukemia. Leukemia. 2008;22(4):771–782. doi: 10.1038/leu.2008.5. [DOI] [PubMed] [Google Scholar]
- 48.Andersson A, Ritz C, Lindgren D, Eden P, Lassen C, Heldrup J, et al. Microarray-based classification of a consecutive series of 121 childhood acute leukemias: prediction of leukemic and genetic subtype as well as of minimal residual disease status. Leukemia. 2007;21(6):1198–1203. doi: 10.1038/sj.leu.2404688. [DOI] [PubMed] [Google Scholar]
- 49.Real PJ, Ferrando AA. NOTCH inhibition and glucocorticoid therapy in T-cell acute lymphoblastic leukemia. Leukemia. 2009;23(8):1374–7. doi: 10.1038/leu.2009.75. [DOI] [PMC free article] [PubMed] [Google Scholar]
- 50.Larson Gedman A, Chen Q, Kugel Desmoulin S, Ge Y, LaFiura K, Haska CL, et al. The impact of NOTCH1, FBW7 and PTEN mutations on prognosis and downstream signaling in pediatric T-cell acute lymphoblastic leukemia: a report from the Children’s Oncology Group. Leukemia. 2009;23:1417–1425. doi: 10.1038/leu.2009.64. [DOI] [PMC free article] [PubMed] [Google Scholar]
Associated Data
This section collects any data citations, data availability statements, or supplementary materials included in this article.