

Abstract
We used tract tracing to reveal the connections of the auditory brainstem in the Tokay gecko (Gekko gecko). The auditory nerve has two divisions, a rostroventrally directed projection of mid- to high best-frequency fibers to the nucleus angularis (NA) and a more dorsal and caudal projection of low to middle best-frequency fibers that bifurcate to project to both the NA and the nucleus magnocellularis (NM). The projection to NM formed large somatic terminals and bouton terminals. NM projected bilaterally to the second-order nucleus laminaris (NL), such that the ipsilateral projection innervated the dorsal NL neuropil, whereas the contralateral projection crossed the midline and innervated the ventral dendrites of NL neurons. Neurons in NL were generally bitufted, with dorsoventrally oriented dendrites. NL projected to the contralateral torus semicircularis and to the contralateral ventral superior olive (SOv). NA projected to ipsilateral dorsal superior olive (SOd), sent a major projection to the contralateral SOv, and projected to torus semicircularis. The SOd projected to the contralateral SOv, which projected back to the ipsilateral NM, NL, and NA. These results suggest homologous patterns of auditory connections in lizards and archosaurs but also different processing of low- and high-frequency information in the brainstem.
INDEXING TERMS: auditory nerve, ITD, cochlear nuclei, superior olive, reptile, lizard, tract tracing, Tokay gecko
Tympanate ears evolved independently at least five times in the ancestors of modern tetrapods, creating multiple parallel developments in processing of airborne sound (Clack, 1997; Clack and Allin, 2004). A main feature of the tympanate ear of amphibians and reptilians (lepidosaurs and archosaurs) is that their large, open Eustachian tubes or interaural canals connect the two middle ears, so that the inner surface of the tympanic membrane is accessible to sound (Christensen-Dalsgaard and Manley, 2005; Christensen-Dalsgaard, 2011). This acoustical coupling can generate highly directional responses at the tympanum (most pronounced in the lizards; Christensen-Dalsgaard and Manley, 2005, 2008), which raises the question of whether there are differences in the organization of the auditory circuits in species with open Eustachian tubes and coupled, directional ears and those with closed Eustachian tubes, such as mammals.
Among the Reptilia, birds (archosaurs) are the most intensively studied group, and their well-developed auditory systems are models for studies of sound localization and communication (for reviews see Carr, 1993; Burger and Rubel, 2008; Grothe et al., 2010). In birds, the auditory nerve enters the brain and divides in two, with the ascending branch largely terminating in the nucleus angularis (NA) and the descending branch in the nucleus magnocellularis (NM). The nucleus magnocellularis projects bilaterally to the nucleus laminaris (NL), which in turn projects to the superior olive, to the lemniscal nuclei, and to the central nucleus of the auditory midbrain. The NA projects to the superior olive, to the lemniscal nuclei, and to the central nucleus of the auditory midbrain. The parallel ascending projections of NA and NL may or may not overlap with one another (Carr, 1992; Carr and Code, 2000). In mammals, the connections of the central auditory system follow a similar ascending trajectory to lemniscal and midbrain nuclei (for reviews see Rouiller, 1997; Cant and Benson, 2003; Grothe et al., 2005). Both avian and mammalian ascending auditory pathways are characterized by monaural projections from the first-order nuclei to the superior olivary nuclei and the nuclei of the lateral lemniscus and by binaural projections from the NL (birds) and the olivary nuclei (mammals; for review see Cant and Benson, 2003).
Lizards (lepidosaurs) differ from birds and mammals in a number of ways. First, their inner ear has two tonotopically distinct populations of hair cells, one sensitive to high frequencies (above 1.5 kHz), and one sensitive to lower frequencies (below 1.5 kHz; Szpir et al., 1990; Manley, 2000, 2002; Christensen-Dalsgaard et al., 2011). The auditory nerve fibers that contact low-frequency hair cells project to three of the four divisions of the first-order nuclei, a medial and lateral NM and a lateral angularis, whereas the auditory nerve fibers that innervate high-frequency hair cells project only to the medial angularis (Miller, 1985; Szpir et al., 1990). Second, only some lizards have been reported to posses a distinct NL (ten Donkelaar et al., 1987). Our recent results suggest that these conflicting reports may result from variation in the development of NM and NL, and that NL may be found in all lizards (Yan et al., 2010). In geckos, NL is located below NM and is characterized by a bitufted neuronal architecture (ten Donkelaar et al., 1987; Yan et al., 2010). It is also well defined in turtles (Miller and Kasahara, 1979; Belekhova et al., 2008). The third major difference between archosaurs and other reptiles is that the lizard and turtle superior olivary complex (SOC) includes a dorsal superior olive (SOd) and an additional ventral superior olive (SOv; Foster and Hall, 1978; ten Donkelaar, 1998; Belekhova et al., 2008; Yan et al., 2010).
The similarities among amniote auditory systems may reflect their common ancestry, and the differences among birds, mammals, and reptiles may reflect both independent phylogenetic development and behavioral adaptations. One important factor may be the evolution of complex vocal communication systems and a sophisticated capability to discriminate frequency as well as increased temporal resolution (Fuzessery, 1988; Ryan et al., 1992; Köppl et al., 2000; Mello et al., 2004; Brittan-Powell et al., 2010). Sound source localization is another adaptation with specific biophysical and neuronal network requirements (Grothe et al., 2005) and may be different in reptiles with coupled ears. Our previous study showed that the gecko auditory nerve fibers were sensitive to both interaural time differences and interaural level differences (Christensen-Dalsgaard et al., 2011). We hypothesized that most neurons in the auditory pathway would be directional, because the directionality is generated by the acoustically coupled eardrums. In this study, we therefore investigated the organization of the auditory brainstem in Gekko gecko, by combining physiological recording and neural tract tracing, to focus on the projections of the auditory nerve, cochlear nuclei, and SOC. We report that there are few differences between geckos and birds in the organization of the auditory circuits, despite the presence of coupled ears.
MATERIALS AND METHODS
Animal preparation
Adult Tokay geckos (Gekko gecko) of both sexes were used in the present study. All animal care and anesthesia followed the procedures approved by the University of Maryland College Park Animal Care And Use Committee. Geckos were preanesthetized in a mixture of isoflurane and room air in a small chamber for about 10 minutes. Afterward, a small plastic tube, connected to a vaporizer and oxygen cylinder, was inserted loosely into the trachea to maintain anesthesia. The isoflurane was vaporized and mixed with oxygen at the vaporizer, with levels adjusted to 3% during the operation to expose the brainstem, then decreased to 0.5–1% during physiological recordings. Animals were allowed to recover from anesthesia and survived for 1–4 days before euthanasia. For perfusion, animals were anesthetized in a mixture of isoflurane and room air in a small chamber, followed by i.m. injection of euthasol at a dose of 7 mg/kg. When deeply anesthetized (no response to toe pinch, depressed respiration), geckos were perfused transcardially with 0.9% saline, followed by 4% paraformaldehyde in 0.1 M phosphate buffer (PB) for 1 hour.
As the first step, we made a brain atlas of auditory nuclei in the brainstem and midbrain of geckos. After postfixation in 4% paraformaldehyde and cryoprotection in 30% sucrose, the brains were sectioned in the coronal plane on a freezing microtome at 40 μm thickness, and the sections were collected in order in PB. Sections were mounted on gelatin-coated glass slides and air dried overnight. Slides were then stained with cresyl violet and fast blue and dehydrated through an ascending series of ethanols, cleared in xylenes, and coverslipped with Permount.
Physiological recording
Geckos were placed in a sound-attenuating chamber for all measurements and maintained at about 25°C, using a heating blanket with feedback control. Dorsal or ventral surgical approaches were used to expose the eighth nerve, brainstem, or midbrain. If necessary, small paper probes were inserted between the brainstem and the internal wall of skull, deflecting the medulla slightly and exposing the proximal part of the right vestibular-cochlear nerve (VIII), or between the midbrain and cerebellum to expose the caudal part of the torus semicircularis. After surgery, the head was held in a constant position by gluing a stainless-steel head post to the pre-frontal bone. Closed, custom-made sound systems were placed at the entrance of both ear canals, containing commercial miniature earphones and miniature microphones (Knowles EM3068). After the sound systems were sealed into the ear canal using Gold Velvet II ear impression material, the sound systems were calibrated individually from 100 Hz to 5 kHz with a step of 100 Hz. Acoustic stimuli were digitally generated by custom-written software driving a signal-processing system (Tucker Davis Technology). Stimuli were generated separately for the two ears by using a TDT AP2 signal processing board. Both channels were then fed to the earphones via D/A converters (TDT DD1), anti-aliasing filters (TDT FT6), and attenuators (TDT PA4). Measures of best frequency were derived by measuring changes in spike rate in response to changing frequency (isolevel response curves). Stimuli for measures of best frequency and average binaural intensity (abi) were tone pips of 100 msec duration (including 5 msec linear ramps), presented at a rate of 5/second. Stimulus levels were set between 20 and 80 dB SPL. Tungsten electrodes (20 MOhm; FHC Inc.) were used for these recordings.
Tract tracing and rapid Golgi
When physiological recordings were complete, the tungsten microelectrode was replaced by a tracer-filled glass pipette, through which recordings of auditory responses could be made prior to iontophoresis of neural tract tracers. Three different tracers were used, neurobiotin (NB; Molecular Probes, Eugene, OR), cholera toxin (CTX; List Biological Laboratories, Campbell, CA), and fluorescein isothiocyanate-conjugated dextran-amines (FITC-DA; 3,000 MW; Molecular Probes). Tracers were iontophoresed using alternating positive current of 1–2.5 μA for 10–20 minutes, i.e., 7 seconds on, 7 off. The craniotomy was sealed with a small gelfoam plug, followed by tissue glue (Vetbond; 3M). Geckos recovered for 0.5–4 days in their home cages before they were euthanized and perfused as described above. The brains were postfixed in the fixative overnight at 4°C and cryoprotected in 30% sucrose in 0.1 M PB at 4°C until they sank. The brains were sectioned at 40 μm, usually in the coronal plane.
For tract tracing with CTX, immunohistochemical procedures were used to visualize the labeled terminals and fibers. Free-floating sections (40 μm) were preincubated for 1 hour in a blocking solution consisting of 10% normal goat serum and 0.3% Triton X-100 in 0.1 M PBS (pH 7.4). Subsequently, sections were incubated with goat anticholeragenoid antibody (List Biological Laboratories), diluted 1:10,000 overnight at 4°C. After multiple washes in PBS, sections were incubated for 1 hour in biotinylated secondary antiserum diluted 1:1,500. They were incubated in avidin-biotin complex (ABC; Vector Laboratories, Burlingame, CA) following PBS rinses and then stained with SG chromogen (Vector Laboratories). Sections were mounted on gelatin-coated glass slides and air dried overnight. After being lightly counterstained with neutral red, slides were dehydrated through an ascending series of ethanols, cleared in xylenes, and coverslipped with Permount. Similar steps were taken to visualize Neurobiotin. Sections were cut at 40 μm, then washed in PBS and incubated in the ABC (Vector Laboratories), followed by the SG chromogen.
A modified Golgi-Cox technique was used on three geckos (Ramón-Moliner, 1970; Glaser and Van der Loos, 1981). Animals were anesthetized with ketamine (20 mg/kg; Ketaject; Phoenix Pharmaceuticals, St. Joseph, MO), followed by a lethal dose of pentobarbital (20 mg/kg i.m.; Abbott Laboratories). Brains were removed and placed in Golgi fixative containing potassium dichromate, mercuric chloride, and potassium chromate (Rapid Golgi Kit; FD NeuroTechnologies, Ellicott City, MD), then sectioned in the transverse plane.
Data analysis
Injection site locations were determined by combining observations on the spread of label, recording depth, and physical location. The presence of densely labeled neurons and neuropil was used to confirm the injection sites. Fortunately, most auditory structures, except the SOd, were located near either the dorsal or the ventral surface of the brain, assisting in localization. Support for injection sites being confined to a particular structure was that both small and large injections yielded qualitatively similar anterograde and retrograde results.
Labeled neurons, axons, and terminals and the contours of each nuclear group were photographed and drawn using computer software (Neurolucida; Microbrightfield, Colchester, VT) connected to a microscope (Olympus BX60). Sections with fluorescent label were photographed with a Zeiss 710 confocal microscope. Labeled terminals were measured by manually selecting and circling the targeted region in ImageJ (NIH open source), which calculated their area. Stained axons were partially reconstructed to identify tracts, and all labeled neurons and terminals were counted manually using the Neurolucida system (Table 1). Labeled terminals were divided into five categories, e.g., 1–10 terminals per nucleus represented with +, 11–100 with ++, 101–500 with +++, 501–2,000 with ++++, and more than 2,000 with +++++, in Table 2. Microphotographs were cropped, and their brightness and contrast were adjusted in Adobe Photoshop.
TABLE 1.
Neurons Labeled After Tracer Injection to a Specific Auditory Nucleus1
| Case No. | Inject site | cNM | cNL | iNA | cNA | iSOd | cSOd | iSOv | cSOv |
|---|---|---|---|---|---|---|---|---|---|
| 107 | NM/NL | 3 | 32 (7) | ||||||
| 157 | NM/NL | 305 | 15 | 2 | 176 (104) | ||||
| 108 | NA | 2 | 89 (9) | ||||||
| 149 | NA | 14 | 1 | 5 | |||||
| 163 | SOd | 199 | 16 | 67 (43) | |||||
| 165 | SOd | 7 | |||||||
| 159 | SOd | ||||||||
| 166 | SOv | 5 | |||||||
| 167 | SOv | 13 | 7 | ||||||
| 71 | TS | 2 | 14 | 1 | 6 | 31 | |||
| 78 | TS | 9 | 28 (7) | 3 (1) | |||||
| 80 | TS | 12 | 12 | 57 | 422 (20) | 133 | |||
| 137 | TS | 6 | 4 | 152 | |||||
| 156 | TS | 23 | 1 | 4 | 41 | 4 |
Numbers in parentheses indicate labeled neurons located between SO and SOv. Differences in the number of labeled neurons may reflect differences in the size of the injection site.
TABLE 2.
Terminals Labeled After Tracer Injection Into a Specific Auditory Nucleus1
| Case No. | Injection site | iNL | cNL | iNA | cNA | iSOd | iSOv | cSOd | cSOv |
|---|---|---|---|---|---|---|---|---|---|
| 39 | NM | + | ++ | ||||||
| 107 | NM/NL | ++ | ++ | ++ | + | + | |||
| 157 | NM/NL | +++ | ++ | +++ | |||||
| 108 | NA | + | + | ||||||
| 149 | NA | ++ | + | + | + | ||||
| 163 | SOd | +++ | |||||||
| 165 | SOd | ++ | ++ | ||||||
| 159 | SOd | ++ | ++ | ||||||
| 71 | TS | + | |||||||
| 78 | TS | ++ | ++ | ||||||
| 80 | TS | + | ++++ | ++ | ++ | ||||
| 137 | TS | ||||||||
| 156 | TS |
+, 1–10; ++, 11–100; +++, 101–500; ++++, 501–2,000; +++++, >2,000. Differences in the number of labeled terminals may reflect differences in the size of the injection site. Terminals were manually counted in Neurolucida software.
RESULTS
General description of auditory nerve and brainstem nuclei
Nissl staining (present study) and immunohistochemical labeling (Yan et al., 2010) were used to define the auditory nuclei and to describe the neuronal types in each nucleus. In Nissl-stained material, two nuclear complexes were identified in the medulla, a first-order cochlear nucleus complex and a superior olivary complex. The cochlear nucleus complex was located in the dorsal medulla, at the level of the auditory nerve entry (Fig. 1A). It contained three nuclei, the first-order NM (Fig. 1A,B) and the NA (Fig. 1D), and a second-order NL (Fig. 1B) beneath the anterior NM (Fig. 1A). Two superior olivary nuclei were located ventral to NL; the SOd proper was located midway between NL and the ventral surface of the brainstem, whereas the SOv formed a rostrocaudally directed cell column on the ventral surface of the brainstem (Fig. 1C).
Figure 1.

Drawings (left) and photomicrographs (right) of a series of transverse sections from caudal to rostral, stained with cresyl violet and luxol fast blue. For all drawings and photomicrographs, the left side shows medial, right side lateral, top dorsal, and bottom ventral orientations. The photomicrographs in the right panel were trimmed according to the frames in the left panel. The black outlines show auditory nuclei (solid in drawings and dashed in photomicrographs). A: Location of caudal nucleus magnocellularis (NM) and auditory nerve. B: Location of rostral NM, nucleus laminaris (NL), dorsal superior olive (SOd) and superior olive ventralis (SOv). C: Location of nucleus angularis (NA). D: Matching photomicrograph showing Nissl-stained neurons in NM, and the dorsolateral and ventromedial neuropil stained by fast blue. The auditory nerve is seen on the dorsal brainstem. E: NM and NL neurons, showing that these nuclei adjoin laterally F: Cellular architecture of SOd and SOv. G: Dorsomedial NA with two fast blue-labeled efferent fiber bundles oriented ventrally. Scale bars = 500 μm in A–C; 100 μm in D,F,G; 50 μm in E. [Color figure can be viewed in the online issue, which is available at wileyonlinelibrary.com.]
Auditory nerve
The eighth nerve has anterior and posterior branches, the anterior branch being largely vestibular and the posterior branch largely auditory (Barbas-Henry and Lohman, 1988; Szpir et al., 1990; Yan et al., 2010). To identify the central projections of the auditory nerve, small neurobiotin injections were made into physiologically identified portions of the auditory nerve of 10 geckos. We also made larger injections of cholera toxin and dextran into the nerve in three geckos (see below). In the neurobiotin-labeled material, the auditory portion of the posterior branch entered the brainstem, after which point the nerve root bifurcated into ascending and descending branches that both traveled medially across the dorsal surface of the brainstem. The ascending branch projected largely to NA and the descending branch to NM (Fig. 2A; six cases with best frequencies at the injection site of 300–600 Hz). A separate, more ventral portion of the auditory nerve appeared not to bifurcate, but to project exclusively to NA (Fig. 2A; three cases with best frequencies at the injection site of 1,400, 1,500, and 2,500 Hz; two cases labeled only NA).
Figure 2.

Schematic drawing and photomicrographs showing projections of the auditory nerve to NM and NA. A: Horizontal drawing of the gecko brainstem with lower frequency fibers (black) that entered the brainstem and bifurcated to terminate in NM and NA, whereas higher best-frequency fibers (red) projected to medial NA. The gray outline shows a more ventral section at the level of the nerve root, and the black outline is at the level of the first-order nuclei. B: Confocal image stack of a transverse section showing fibers labeled by FITC-DA injected into auditory nerve, which terminated in the dorsolateral NM neuropil. C: Terminals in NM labeled by injection of CTX to the auditory nerve. D: Terminals in NA labeled by injection of CTX to the auditory nerve. E: Labeled auditory nerve fibers in NM but not NL. F: Relatively large terminal endings in NM. G: Small bouton terminals in NA. Scale bars = 200 μm in B; 50 μm in C–E; 10 μm in F,G. [Color figure can be viewed in the online issue, which is available at wileyonlinelibrary.com.]
Tonotopic organization of auditory nerve fiber terminals did not appear precise, although reconstructions of intracellularly labeled fibers may be needed to resolve this question. There was some tonotopy within NA, in which injections into low best-frequency (300–500 Hz) regions of the auditory nerve labeled caudodorsal regions, whereas the large injection into the 2,500-Hz best-frequency region of the nerve labeled both rostroventral and all of the most rostral regions of NA. In NM, low best-frequency injections (400, 500, 1,100 Hz) led to label throughout NM but no label in rostral NA. There were some indications of tonotopic organization in rostral regions of NM, where the 400- and 500-Hz injections labeled terminals in lateral NM and the 1,100-Hz label was more medial.
We hypothesize that, as has been shown by intracellular labeling in the alligator lizard (Szpir et al., 1990), the projection to the medial and rostral NA originates from high best-frequency hair cells. This is supported by bimodal measures of auditory nerve fiber diameters labeled with neurobiotin after small injections into high and low best-frequency regions of the nerve. The average diameter of fibers that projected to NM was 2.65 ± 0.69 μm, with a range of 1.8–4.7 μm (n = 86, six geckos). In contrast, the average diameter of fibers that projected only to NA was 1.32 ± 0.42 μm, with a range of 0.7–2.1 μm (based on 82 fibers from six lizards). These means are statistically different (Student’s t-test; P < 0.0001). When we combine all measurements of fiber diameter, however, our data have a unimodal distribution, like that observed in Tokay gecko auditory nerve by Miller (1985).
In transverse sections, the auditory nerve extended into NM, with its preterminal branches splayed out like fingers on a hand, filling the dorsal neuropil (Fig. 2B). After large CTX and FITC-dextran injections into the auditory nerve, terminals in NA (Fig. 2C) were denser than those in NM (Fig. 2D), whereas no labeling was observed in NL (Fig. 2E). Not only did terminal density vary between NM and NA but so did terminal morphology. As reported by Szpir et al. (1990), the terminals of lizard cochlear nerve fibers fell into two separate classes. Gecko auditory nerve terminals formed one class of small, simple endings and a second class of large, relatively complex endings. The small endings were bouton-like, were often preceded by a short string of en passant swellings having various sizes and shapes (Fig. 2), and were found in both NA and NM. The areas of these individual terminal swellings were measured, and, in NA, auditory nerve terminals had a mean area of 3.16 ± 1.69 μm2 (n = 71, four geckos; Fig. 2G1–3). Large endings were found only in NM and formed swellings characterized by lobules and filopodia. Although these endings were large, they were not fenestrated (fenestrations characterize the endbulb terminals in birds and mammals; for review see Ryugo and Parks, 2003). The large endings were distinct from the boutons and were tightly associated with NM cell bodies (Fig. 2F). After Szpir et al. (1990), we refer to such endings as “end-bulbs” because of their resemblance to the endbulbs of Held in primary auditory fibers of birds and mammals. In NM, the mean area of the terminals was 13.73 ± 15.24 μm2 (n = 37, three geckos; Fig. 2F1–3), including both boutons and endbulbs. It should be noted that even simple bouton terminals in NM were larger than boutons in NA and were also often associated with cell bodies (NM terminal area range 2.9–79 μm2 vs. NA range of 0.3–9.4 μm2).
Cochlear nucleus complex
Nucleus magnocellularis
NM neurons were large, with round or ellipsoid cell bodies, and were characterized by ventrally directed axons, rugose cell bodies, and short dendrites in both Golgi-stained material and cells retrogradely labeled with NB (Fig. 3A,B; see also Fig. 2F2). The large injections of CTX and FITC-DA into the auditory nerve described above were compared with the Nissl-stained material to delineate the first-order nuclei. Dye injections into the auditory portions of the nerve labeled terminals throughout the neuropil of NM (compare Fig. 1B,E with Fig. 2B,C). Comparisons with Nissl-stained material revealed that the region containing these terminals overlapped with both the cell body region of NM and the neuropil above the NM cell bodies (Fig. 1D; see also Fig. 2B,C). In cross-section, NM changed from a small area of neuropil most caudally to a mediolaterally directed band of neurons rostrally (Fig. 3A,C–E). NM neurons had an axon that generally descended below NM before bifurcating into ipsilateral and contralateral branches.
Figure 3.

Organization and cellular architecture of NM, after injection of NB in the contralateral NL. A: Outline drawings of NM in transverse sections at 100-μm intervals from caudal (left) to rostral. B: Drawing of labeled neurons with large, round, rugose cell bodies and ventrally orientated NM axons. C: Profile of caudal NM with most neurons labeled at the dorsolateral region. D: Neurons in middle NM. E: Neurons in rostral NM; note their altered dorsomedial-ventrolateral orientation. F: High-power photomicrograph showing labeled neurons in NM with round or ellipsoid form. Scale bars = 200 μm in A; 10 μm in B; 50 μm in C–E; 15 μm in F. [Color figure can be viewed in the online issue, which is available at wileyonlinelibrary.com.]
Nucleus laminaris
NL was located beneath rostral NM and spanned a relatively short rostrocaudal range. NL neurons were bitufted in form, with dorsoventrally directed dendrites and spindle-shaped somata (Fig. 4D). Generally, NL neurons formed a compact layer of cells, about one cell layer thick medially and two cell layers laterally. Projections from the ipsilateral NM crossed the dorsal midline and innervated the ventral portion of the contralateral NL, shown by injections in NM (Fig. 4A,D, injection site). The contralateral NM axons were thick (mean 3.02 ± 0.79 μm, n = 16, two geckos) and traversed the dorsal portion of the median longitudinal fasciculus in a pathway that was at first intermixed with ascending lemniscal axons from NL. The ipsilateral NM also projected to the ipsilateral NL and formed a terminal field in the dorsal NL. One small injection in NM yielded a few terminals in ipsilateral NL (Fig. 4B). A large neurobiotin injection into NM overlapped slightly with NL, producing a small number of labeled neurons in medial NL. This injection also labeled neurons in the contralateral NM (Fig. 4E). All neurobiotin injections in NM led to labeled terminals in the ventral neuropil of the contralateral NL (Table 2, Fig. 4E, outlined with dots). NL projected to the contralateral torus semicircularis (unpublished data). A midbrain injection in the fiber bundle leading to the NL recipient region of the torus semicircularis (TS) labeled only bitufted neurons in NL (Fig. 4C). Other small injections of neurobiotin into the NL recipient zone of the torus showed that the NL projection is largely contralateral (Table 1, unpublished data).
Figure 4.

Connections and cellular architecture of NL labeled by injection of NB to NM/NL. A: Drawing to show an injection site in NM (gray box) and NM axons that terminated in contralateral ventral NL. An enlarged view of the rectangular frame surrounding the contralateral NL shows a single well-labeled axon, which formed terminal boutons on the ventral dendrites of NL neurons. B: Terminals in NL were labeled with a small injection of NB in the ipsilateral NM. C: Bitufted neurons labeled after a small injection of NB into the fiber tract entering the torus semicircularis. D: NB injection site in NM and NL revealed round cell bodies in NM and bitufted cells in NL. E: The contralateral side of the same case as in D, showing retrogradely labeled neurons in NM and fibers in ventral NL. Scale bars = 50 μm in A,B,E; 20 μm in C,D. [Color figure can be viewed in the online issue, which is available at wileyonlinelibrary.com.]
Nucleus angularis
NA was larger than NM and was located rostral to NM. In transverse sections, NA had an elliptical profile (Fig. 1C,G) with neuronal cell bodies forming a shell like a glomerulus, surrounding neuropil composed at least in part of NA dendrites and auditory nerve axons and terminals. The open portion of the glomerulus faces laterally, toward the entry of the auditory nerve (Fig. 5A–F). A dense auditory nerve terminal field, following a large injection of CTX into the auditory nerve, labeled fibers that traveled dorsally in the brainstem, immediately below the fourth ventricle, and then descended to fill the NA neuropil (Fig. 5A).
Figure 5.

Neuronal architecture in NA following injections to different sites, all transverse sections. A: Labeled auditory nerve terminals reveal the glomerular organization of NA, after injection of CTX into auditory nerve. B: Retrogradely labeled NA neurons after injection of FITC-DA into contralateral torus semicircularis. C: Retrogradely labeled NA neurons after NB injection into the ipsilateral SOd. Inset: NA neurons. D: Retrogradely labeled NA neurons after NB injection into contralateral SOd. Inset shows NA neurons. E: Retrogradely labeled NA neurons after injection of NB into the contralateral SOv. F: Schematic drawing to show labeled neuronal distribution: neurons projecting to TS marked by circles, neurons projecting to SOd marked with asterisks, and neurons projecting to contralateral SOv with triangles. Scale bars = 200 μm in A,B; 50 μm in C–E; 500 μm in F; 20 μm in inset C; 10 μm in inset D. [Color figure can be viewed in the online issue, which is available at wileyonlinelibrary.com.]
NA projected to the torus semicircularis and extensively to the ipsilateral SOd and also sent a major projection to the contralateral SOv. These projections were delineated by injections into NA, SOd, SOv, and the torus semicircularis (Table 1). Neurons in NA were labeled retrogradely after injection of both FITC-DA and NB into the contralateral torus semicircularis (Fig. 5B, and unpublished data). Injections of NB into the SOd resulted in predominantly ipsilateral labeling of NA (Fig. 5C) and a few neurons in contralateral NA (Fig. 5D, Table 1), whereas tracer injected into SOv labeled exclusively neurons in contralateral NA (Fig. 5E, Table 1). The projection from NA to SOv was characterized by thick axons (mean 3.05 ± 1.01 μm, n = 14) that crossed the midline diagonally and ventral to the MLF. Axons stained by luxol fast blue (Fig. 1G) and NB tracer (Fig. 5C) projected downward through two separate paths that were divided by a bundle of anterior-posterior fibers. Axons that originated from the dorsal part of NA ran down medially (Fig. 1G), whereas those from ventral part ran laterally (Figs. 1G, 5C). Consistently, neurons in these two regions of NA were preferentially labeled after injections of either FTTC or NB into the torus semicircularis (n = three geckos, cases 71, 80, 156) or the SOC (n = 3, cases 163, 166, 167; Fig. 5F).
Superior olivary complex
The superior olivary nuclei were located in the ventral hindbrain and consisted of two dorsoventrally separated nuclei, a dorsal principal SOd and a ventral SOv (Fig. 1C). Both form rostrocaudally directed cell columns (Yan et al., 2010).
Dorsal superior olive
The dorsal superior olive is a cytoarchitectonically distinct region at the level of the cochlear nucleus, presenting a round profile in transverse sections. It contained a heterogenous population of cells (Fig. 1B,F) and was located in the ventral brainstem, below the vestibular nuclei, and above the SOv. Injections of NB into NM/NL revealed fibers that passed through the medial part of the ipsilateral SOd and projected to SOv, in addition to retrogradely labeling a few neurons in the ipsilateral SOd (Fig. 6A). Small NB injections in NA labeled fibers and neurons in the ipsilateral SOd (Fig. 6B,C, Table 1). Finally, the ipsilateral SOd projected to the SOv, because a small NB injection into the ipsilateral SOv labeled a few neurons in SOd (Fig. 6D). Note that the SOv injections were made with a ventral surgical approach, to avoid passing through SOd.
Figure 6.

Organization of SOd and SOv. A: Injection of NB into contralateral NM/NL revealed retrogradely labeled neurons, fibers, and terminals in the ipsilateral SOd and SOv. B: Fibers labeled after an injection into ipsilateral NA. C: Neurons labeled in SOd after an injection in ipsilateral NA. D: SOd neurons labeled after an NB injection into ipsilateral SOv. Scale bars = 100 μm in A; 50 μm in B–D. [Color figure can be viewed in the online issue, which is available at wileyonlinelibrary.com.]
Ventral superior olive
The SOv, containing a heterogeneous neuronal population, was located at the bottom of the brainstem (Fig. 1B,F) and was longer than the SOd in the anterior-posterior direction. Caudally, the SOv anastomosed with SOd, and rostrally it terminated at the caudal origin of the nuclei of the lateral lemniscus. NB injections into SOd produced labeled neurons and fibers in SOv (Fig. 7A). Some neurons located above the caudal SOv were also stained and were considered to be either part of the most caudal SOv or a bridge between SOd and SOv (Fig. 7A). The SOv received primarily contralateral inputs from NL, NA, and SOd (Table 2), and appeared to project back to all ipsilateral auditory brainstem structures (Table 1). The projection from NA to SOv was characterized by the thick axons described above, which projected to the contralateral SOv (Fig. 7D, Table 1), whereas terminal labeling was observed in SOv following tracer injections into NL and SOd (Table 2). Many retrogradely labeled neurons were observed in the ipsilateral SOv after NB injections into NM (Fig. 7B), NL (Fig. 7C), and NA (Table 1).
Figure 7.

Profile and structures of SOv and its relationship to SOd. A: Injection of NB in SOd labeled neurons in the ipsilateral SOv and neurons in the region between SOd and SOv. B: Neurons labeled in SOv after an injection of NB into the contralateral NM. C: Neurons labeled after NB injection into contralateral NL. D: Thick axons labeled after an NB injection in NA projected to the contralateral SOv. Scale bars = 100 μm in A,D; 50 μm in B,C. [Color figure can be viewed in the online issue, which is available at wileyonlinelibrary.com.]
Summary of interconnections
Our description of the connections of the auditory nerve, cochlear nuclei, and SOC is based on the results of tract tracing experiments. NA received input from the ascending branch of the auditory nerve and innervated mainly the ipsilateral SOd, the contralateral SOv, and the contralateral torus semicircularis (Fig. 8A, and unpublished data). NM received inputs from the caudal, descending branch of the auditory nerve and projected to the dorsal neuropil of the ipsilateral NL and across the midline to the ventral neuropil of the contralateral NL. Lemniscal axons from NA and NL projected contralaterally to the SOd, SOv, and auditory midbrain though a fiber bundle ventral to contralateral SOv (Fig. 8B). The SOv projected back to the ipsilateral first-order nuclei and NL.
Figure 8.
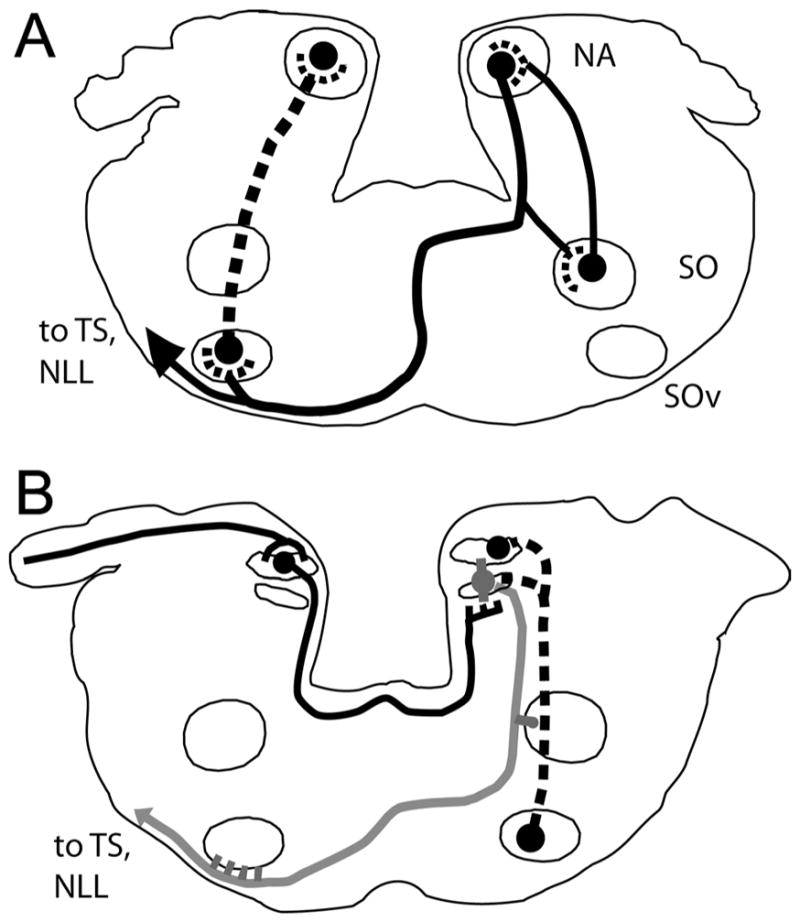
Summary of the connections of the cochlear nuclei and superior olive complex. A: NA innervated mainly the ipsilateral lateral portion of SOd, the contralateral SOv, and the contralateral torus semicircularis. SOd and SOv both projected back to the ipsilateral first-order nuclei. B: NM projected to the dorsal neuropil of the ipsilateral NL and across the midline to the ventral neuropil of the contralateral NL, whereas NL projected to the ipsilateral SOd and to the auditory midbrain, through a fiber bundle that descended to run ventral to the contralateral SOv (gray line). SOv projected back to the ipsilateral NM and NL (dashed line).
DISCUSSION
Lizard ears are highly directional, with the middle ears connected through the mouth cavity (Christensen-Dalsgaard and Manley, 2005, 2008). The consequence of this coupling is that auditory nerve responses are sensitive to both interaural time and interaural level differences (Christensen-Dalsgaard et al., 2011). Thus all neurons in the central auditory system should show directional responses, with the possible exception of very low best-frequency (below 300 Hz) responses. We have examined the physiological and anatomical consequences of this directional system in the gecko.
Our tract-tracing studies reveal parallel low and high best-frequency channels in the central auditory system. These channels are created by the differential projections of the unique high best-frequency region of lepidosaur basilar papilla (Manley, 2002), which terminates in the high best-frequency region of medial NA. Despite the emergence of these parallel channels, there are otherwise few differences between geckos and birds in the organization of the auditory brainstem circuits, suggesting homology of the brainstem nuclei.
Projections of the auditory nerve
Lizard inner ears are highly specialized, with sensitive high-frequency hearing originating from a specialized region of the papilla (Manley, 2002). Szpir et al. (1990) used intracellular labeling of auditory nerve fibers in the alligator lizard to show that the high-frequency region of the papilla has a unique central projection to the medial part of NA. Our data, and those of Barbas-Henry and Lohman (1988), support this finding; geckos and monitor lizards have patterns of auditory nerve fiber projections similar to those of alligator lizards, with distinct projections of low and high best-frequency fibers to NM and NA. Furthermore, in monitor lizards, physiological studies have shown a high-frequency bias in NA (Manley, 1976). Although a unique high best-frequency pathway characterizes lepidosaurs, there is evidence that the highest frequencies may also only project to NA in birds (Konishi, 1970; Köppl, 2001).
Gecko auditory nerve fibers, labeled after small dye injections into low to middle best-frequency regions of the nerve, projected to NM and to caudal and lateral regions of NA, whereas the auditory nerve fibers that innervate high-frequency hair cells appear to project only to medial and rostral NA. Our current data are also consistent with the results of our immunohistochemical study, which revealed that a ventral-rostral bundle of auditory nerve fibers entered the brain and projected to medial NA, whereas the rest of the auditory nerve bifurcated to project caudally to the NM and rostrally to more lateral regions of NA in geckos (Yan et al., 2010).
The projections to medial NA were marked by smaller diameter auditory nerve axons, consistent with the differences between Szpir et al.’s “tectorial and nontectorial fibers,” here termed “low- and high-frequency fibers,” respectively. In the alligator lizard, fiber diameters averaged 4.4 μm for low-frequency and 2.7 μm for high-frequency fibers (Szpir et al., 1990). Nevertheless, our measures of auditory nerve fiber diameters revealed a normal distribution, as had previously been shown for a number of lizards, including Gecko gecko (Miller, 1985). Thus, although nerve distributions were unimodal, our ability to differentiate between two populations revealed a consistent difference in diameter between inputs to NM and NA.
Auditory nerve terminals in NM are larger than those in NA, as is also the case in the alligator lizard, in which the fibers terminating in medial NM can form large, axosomatic endings, which resemble mammalian and avian endbulbs of Held (Ramon y Cajal, 1908; Parks and Rubel, 1978; Szpir et al., 1990, 1995; Carr and Boudreau, 1991). Szpir et al. (1990) used the presence of large axosomatic terminals in NM to support the hypothesis that the division into a small bouton terminal pathway for encoding loudness and a larger terminal pathway for encoding temporal information predates the sauropsid synapsid split and that these projections are therefore homologous in mammals and Reptilia (for review see Ryugo and Parks, 2003). Given the differences in the organization of the first-order nuclei in these groups, however, it is also possible that the dichotomy could result from selection for temporal precision in both groups, because large somatic terminals characterize temporal coding pathways in other systems, such as the electrosensory system (Carr and Friedman, 1999).
Organization of the first-order nuclei
In many lizards, four nuclear populations receive primary auditory inputs: a medial and lateral nucleus magnocellularis and a medial and lateral angularis (Miller, 1975). Alligator lizards have a distinct medial NM, lateral NM, medial NA and lateral NA, with medial NM containing a homogeneous population of neurons called “lesser ovoid cells,” whereas the lateral NM contained greater ovoid and small cells (Szpir et al., 1995). We observed similar large, oval neurons in gecko NM, but could not differentiate between medial and lateral divisions. In geckos, the ovoid cells in NM receive perisomatic auditory nerve endings, some of which resemble the end-bulb synapses in the avian NM and the mammalian AVCN. Although these terminals are not as large and well developed as those observed in birds, they were complex in form, large, and associated with cell bodies (Jhaveri and Morest, 1982; Carr and Boudreau, 1991; Yan et al., 2010; O’Neil et al., 2011). Furthermore, both Golgi and retrograde labeling of NM ovoid neurons revealed large neurons with rugose cell bodies and short dendrites, much like NM neurons in birds (Jhaveri and Morest, 1982; Carr and Boudreau, 1993). These similarities suggest the lizard NM is homologous to the NM of birds, crocodilians, and turtles (Szpir et al., 1990; Carr and Code, 2000; Grothe et al., 2005; Belekhova et al., 2008; Carr et al., 2009).
Immunohistochemical techiques revealed a clear NL in Gekko gecko, although it had not been previously observed in this species (Miller, 1975; Yan et al., 2010). NL was identified on the basis of its location below NM, bitufted neuronal architecture, pattern of connections with NM, and similarity to NL in Varanus exanthematicus (Glatt, 1975a,b; ten Donkelaar et al., 1987; Barbas-Henry and Lohman, 1988). In geckos, NL is a curved structure below NM, composed of a compact layer of bitufted or spindle-shaped neurons with dorsoventrally directed dendrites and merging laterally into NM (Yan et al., 2010). Gecko NL received projections from both ipsilateral and contralateral NM, revealing a connection pattern similar to that found in birds, in which NL forms a circuit for computing interaural time difference (Young and Rubel, 1983; Carr and Konishi, 1990; Krützfeldt et al., 2010a; see discussion below).
There were some differences between the avian and the gecko patterns. In a case with an injection of NB in NM that overlapped slightly with NL, fibers from the contralateral NM passed through the contralateral NL on their way to the ipsilateral NL, unlike the avian pattern, in which NM projected to the contralateral NL in a distinct fiber bundle on the medial edge of ipsilateral NL (Young and Rubel, 1983; Carr and Konishi, 1990; Cramer et al., 2004; Krützfeldt et al., 2010a). In the gecko, NM and NL axons appeared to be intermixed, until the NL axons descended ventrally toward SOd and the torus semicircularis, whereas NM axons traveled above and around the medial longitudinal fasciculus, suggesting a closer connection between NM and NL. These data are consistent with the hypothesis that NM and NL derived from the same primordium and separated in later evolutionary events (Glatt, 1975a,b; Cramer et al., 2000; Kubke et al., 2002; Yan et al., 2010).
Organization of the olivary nuclei
Unlike the case in birds, two olivary nuclei have been described for lizards and turtles, a principal or dorsal nucleus of the superior olive and a smaller, ventral superior olive (Ariens-Kappers et al., 1936; Foster and Hall, 1978; ten Donkelaar et al., 1987; ten Donkelaar, 1998; Belekhova et al., 2008; Yan et al., 2010). Both the SOd and the SOv receive projections from the first-order nuclei and project to the torus in those lizards examined (Ariens-Kappers et al., 1936; Foster and Hall, 1978; ten Donkelaar et al., 1987; ten Donkelaar, 1998). A similar organization exists in the tortoise Testudo horsfieldi and the turtle Emys orbicularis (Miller, 1980; Belekhova et al., 1985; Kunzle, 1986; ten Donkelaar, 1998; Belekhova et al., 2008).
We have described a single lemniscal nucleus in the gecko, consistent with results from Iguana iguana and the pond turtle (Foster and Hall, 1978, Belekhova et al., 1985, 2008; Yan et al., 2010). By comparison, three nuclei are recognized in birds, dorsal, intermediate, and ventral (Arends and Zeigler, 1986; Wild et al., 2001, 2009), of which the ventral nucleus projects back to the first-order nuclei (Wild et al., 2009). We hypothesized that the avian ventral nucleus of the lateral lemniscus is homologous to the SOv of lizards and turtles, because, in geckos, the nucleus of the lateral lemniscus occupies a similar location rostral to, and almost continuous with, the SOv (Takahashi and Konishi, 1988a; Belekhova et al., 2008; Yan et al., 2010). Here we show that the SOv projects back to all ipsilateral first-order nuclei, in a pattern similar to the projection of ventral nucleus of the lateral lemniscus in the zebra finch (Wild et al., 2010).
Processing directional information in the first-order nuclei
In birds and alligators, binaural auditory brainstem circuits compute the interaural time and level difference cues used in sound localization (for reviews, see Konishi 2003; Grothe et al., 2005; Burger and Rubel, 2008). We have shown here that the circuits used for computing interaural time differences in birds and alligators are anatomically similar to those of geckos, although the functional role of the gecko circuit is unknown, because there are two major peripheral differences between lepidosaurs and archosaurs. First, lizard ears are highly directional (Christensen-Dalsgaard and Manley, 2005, 2008, Christensen-Dalsgaard et al., 2011), and, second, most lizard inner ears are highly specialized, with sensitive high-frequency hearing in a specialized region of the papilla and with distinct projections into a unique and well-developed region of NA (Szpir et al., 1990; Manley, 2002). These lepidosaur adaptations should exert a noticeable effect on the first-order auditory nuclei. Specifically, there should be no requirement for computing interaural time and level differences and no separation of time and intensity cues, because the gecko nerve responses reflect the interaction of ipsi- and contralateral inputs on the motion of the eardrum and therefore simultaneously encode the interaural time difference (ITD) and the interaural level difference (ILD) by changes in firing rate (Christensen-Dalsgaard and Manley, 2005; Christensen-Dalsgaard et al., 2011). This raises the questions of what the function of the NM-NL circuit could be in lepidosaurs and what the ancestral condition could have been.
Although we do not yet know how the NM-NL circuit functions in geckos, NM and NL were similarly organized in birds, crocodilians, and geckos. The gecko NM was somewhat smaller and less well developed than in birds, and NM’s target, NL, was also smaller, but both gecko and avian NL had bitufted neurons with segregated ipsi-and contralateral inputs from NM (Young and Rubel, 1986; MacLeod et al., 2006; for reviews see Grothe et al., 2005; Carr et al., 2009). Nevertheless, the directional nature of the auditory nerve responses raises the question of whether the lizard circuits work in the same way as their avian counterparts, with excitatory inputs from both ears synapsing upon coincidence detectors (Christensen-Dalsgaard et al., 2011; for reviews see Schnupp and Carr, 2009; MacLeod and Carr, 2011), or whether the contralateral inputs would be inhibitory.
Given these similarities, it is likely that NL appeared in the shared ancestor of the archosaurs and lepidosaurs. Christensen-Dalsgaard and Carr (2008) have argued that these ancestors might also have had pressure gradient receiver ears (i.e., a tympanum open to the buccal cavity), and thus the NL function in lizards may be closer to the ancestral condition. What was NL’s function in ancestral reptiles? Even if these ancestors had coupled ears, binaural comparisons would still have been necessary, because any monaural directional response is ambiguous with respect to level and location, and it is possible that these comparisons take place in NL.
High and low best-frequency pathways
It is likely that the lepidosaur and archosaur ancestors, before developing a tympanum, were able to hear airborne sounds by mechanisms similar to bone conduction in humans. Sound would vibrate the skull, and the vibrations would stimulate the sensory cells in the inner ear. This pathway would be characterized by relatively low overall sensitivity, mostly to frequencies below 400–500 Hz. The emergence of a tympanum, in addition to making the ear more sensitive, would have extended its frequency range to higher frequencies. The existence of a low (ancestral)- and a high-frequency (novel) pathway in the lizards may reflect this evolutionary history. The low-frequency pathway would, from the earliest tetrapod ancestor, have been characterized by phase locking, lending itself to processing of time parameters. In contrast, the novel high-frequency pathway, analyzing the tympanic input, would require processing of ILD, because phase locking at the frequencies at which the eardrum is most directional is almost nonexistent (Christensen-Dalsgaard and Carr, 2008).
Because gecko ears are directional, neurons in the first-order nuclei should show directional responses, with the possible exception of very low frequencies (Vossen et al., 2010). How these directional responses are processed at higher levels remains unknown. Binaural comparisons are still necessary, however, because any monaural directional response is ambiguous with respect to level and location, and it is possible that these take place in NL for the low frequencies and in NA and SOv for the high frequencies. Binaural comparisons could be by EI (ipsilateral excitatory and contralateral inhibitory) neurons, as hypothesized by Christensen-Dalsgaard and Manley (2005); such neurons would sharpen the directional response, and we have preliminary physiological evidence for contralateral inhibition. However, further neurophysiological studies are necessary to explore the functions of NL, to determine, for instance, whether interaural phase difference sensitivity is improved over that present in the nerve and whether interaural phase difference sensitivity can still be created when internal communication between two ears is reduced by inserting a mold in the mouth (Christensen-Dalsgaard et al., 2011).
NA is very large in geckos, reflecting an increased role for high-frequency sound in lepidosaurs. Although less attention has been paid to NA in birds compared with NM and NL, NA’s connections with the superior olive, the nuclei of the lateral lemniscus, and the inferior colliculus (homologue of torus semicircularis) are well established and resemble those found in the gecko (Takahashi and Konishi, 1988b; Krützfeldt et al., 2010b). In lizards, NA contains variably sized darkly staining cells (Miller, 1975; Szpir et al., 1995), consistent with our immunohistochemical results showing that NA contains a more heterogeneous grouping of cells than NM and NL (Yan et al., 2010) and Szpir et al.’s (1995) findings of duckhead, multipolar, bulb, and agranular cells in alligator lizard NA. These findings are also consistent with observations in birds, in which NA is also heterogeneous (Soares and Carr, 2001).
The gecko NA is connected with the contralateral SOv through a well-developed projection across the midline. Insofar as the SOv projects back to the first-order nuclei, it might provide an inhibitory projection to create EI responses like those proposed by Christensen-Dalsgaard and Manley (2005). The projections of gecko NA are very similar to those observed both in birds and in Iguana iguana (Foster and Hall, 1978; Conlee and Parks, 1986; Takahashi and Konishi, 1988a; Wang and Karten, 2010). In both gecko and iguana, NA projected to the ipsilateral SOd, the contralateral SOv, the NLL, and the torus semicircularis. The similarity of organization in the auditory brainstem of lizards and birds suggests the existence of similar structures in their common ancestor. Clack (2003) suggested, based on fossil evidence, that this common ancestor was atympanate. In that case, the structures would have evolved for the analysis of low-frequency sounds, received via some kind of bone conduction. The evidence for an independent evolution of the tympanum in archosaurs and lepidosaurs is relatively weak, however, and may have to be reinterpreted in light of our findings.
Acknowledgments
Grant sponsor: Chinese Academy of Sciences Bairenjihua; Grant number: KSCX2-YW-R-077 (to Y.T.); Grant sponsor: Danish National Science Foundation; Grant number: 09-065990 (to J.C.-D.); Grant sponsor: Carlsberg Foundation; Grant number: 2009-01-0684 (to J.C.-D.); Grant sponsor: Velux Foundation (DK, to C.E.C.); Grant sponsor: NIH; Grant number: DC00436 (to C.E.C.); Grant number: P30 DC0466 (to the University of Maryland Center for the Evolutionary Biology of Hearing).
We gratefully acknowledge Kai Yan and Wen-ru Liang for assistance with histology.
LITERATURE CITED
- Arends JJ, Zeigler HP. Anatomical identification of an auditory pathway from a nucleus of the lateral lemniscal system to the frontal telencephalon (nucleus basalis) of the pigeon. Brain Res. 1986;398:375–381. doi: 10.1016/0006-8993(86)91499-x. [DOI] [PubMed] [Google Scholar]
- Ariens-Kappers C, Huber G, Crosby E. The comparative anatomy of the nervous system of vertebrates, including man. New York: Macmillan; 1936. [Google Scholar]
- Barbas-Henry HA, Lohman AHM. Primary projections and efferent cells of the VIIIth cranial nerve in the monitor lizard, Varanus exanthematicus. Brain Res. 1988;398:375–381. doi: 10.1002/cne.902770206. [DOI] [PubMed] [Google Scholar]
- Belekhova MG, Zharskaja VD, Khachunys AS, Gaidaenko GV, Tumanova NL. Connections of the mesencephalic, thalamic and telencephalic auditory centers in turtles. Some structural bases for audiosomatic interrelations. J Hirnforsch. 1985;26:127–152. [PubMed] [Google Scholar]
- Belekhova M, Chudinova T, Kenigfest N, Krasnoshchekova E. Distribution of metabolic activity (cytochrome oxidase) and immunoreactivity to calcium-binding proteins in the turtle brainstem auditory nuclei. J Evol Biochem Physiol. 2008;44:354–364. [PubMed] [Google Scholar]
- Brittan-Powell EF, Christensen-Dalsgaard J, Tang YZ, Carr CE, Dooling RJ. The auditory brainstem response in two lizard species. J Acoust Soc Am. 2010;128:787–794. doi: 10.1121/1.3458813. [DOI] [PMC free article] [PubMed] [Google Scholar]
- Burger RM, Rubel EW. Encoding of interaural timing for binaural hearing. In: Dallos P, Oertel D, editors. The senses: a comprehensive reference. San Diego: Academic Press; 2008. pp. 613–630. [Google Scholar]
- Cant NB, Benson CG. Parallel auditory pathways: projection patterns of the different neuronal populations in the dorsal and ventral cochlear nuclei. Brain Res Bull. 2003;60:457–474. doi: 10.1016/s0361-9230(03)00050-9. [DOI] [PubMed] [Google Scholar]
- Carr CE. The evolution of the central auditory system in reptiles and birds. In: Webster DB, Fay RR, Popper AN, editors. The evolutionary biology of hearing. New York: Springer-Verlag; 1992. pp. 511–544. [Google Scholar]
- Carr CE. Processing of temporal information in the brain. Annu Rev Neurosci. 1993;16:223–243. doi: 10.1146/annurev.ne.16.030193.001255. [DOI] [PubMed] [Google Scholar]
- Carr CE, Boudreau RE. Central projections of auditory nerve fibers in the barn owl. J Comp Neurol. 1991;314:306–318. doi: 10.1002/cne.903140208. [DOI] [PubMed] [Google Scholar]
- Carr CE, Boudreau RE. Organization of the nucleus magnocellularis and the nucleus laminaris in the barn owl: encoding and measuring interaural time differences. J Comp Neurol. 1993;334:337–355. doi: 10.1002/cne.903340302. [DOI] [PubMed] [Google Scholar]
- Carr CE, Code RA. The central auditory system of reptiles and birds. In: Dooling RJ, Fay RR, Popper AN, editors. Comparative hearing: birds and reptiles. New York: Springer; 2000. pp. 197–248. [Google Scholar]
- Carr CE, Friedman MA. Evolution of time coding systems. Neural Comput. 1999;11:1–20. doi: 10.1162/089976699300016773. [DOI] [PubMed] [Google Scholar]
- Carr CE, Konishi M. A circuit for detection of interaural time differences in the brain stem of the barn owl. J Neurosci. 1990;10:3227–3246. doi: 10.1523/JNEUROSCI.10-10-03227.1990. [DOI] [PMC free article] [PubMed] [Google Scholar]
- Carr CE, Soares D, Smolders J, Simon JZ. Detection of interaural time differences in the alligator. J Neurosci. 2009;29:7978–7990. doi: 10.1523/JNEUROSCI.6154-08.2009. [DOI] [PMC free article] [PubMed] [Google Scholar]
- Christensen-Dalsgaard J. Directional hearing in non-mammalian tetrapods. In: Popper AN, Fay RR, editors. Sound source localization. Springer handbook in auditory research. New York: Springer-Verlag; 2005. pp. 67–123. [Google Scholar]
- Christensen-Dalsgaard J. Vertebrate pressure gradient receivers. Hear Res. 2011;273:37–45. doi: 10.1016/j.heares.2010.08.007. [DOI] [PubMed] [Google Scholar]
- Christensen-Dalsgaard J, Carr CE. Evolution of a sensory novelty: tympanic ears and the associated neural processing. Brain Res Bull. 2008;75:365–370. doi: 10.1016/j.brainresbull.2007.10.044. [DOI] [PMC free article] [PubMed] [Google Scholar]
- Christensen-Dalsgaard J, Manley GA. Directionality of the lizard ear. J Exp Biol. 2005;208:1209–1217. doi: 10.1242/jeb.01511. [DOI] [PubMed] [Google Scholar]
- Christensen-Dalsgaard J, Manley GA. Acoustical coupling of lizard eardrums. J Assoc Res Otolaryngol. 2008;9:407–416. doi: 10.1007/s10162-008-0130-2. [DOI] [PMC free article] [PubMed] [Google Scholar]
- Christensen-Dalsgaard J, Tang YZ, Carr CE. Binaural processing by the gecko auditory periphery. J Neurophysiol. 2011;105:1992–2004. doi: 10.1152/jn.00004.2011. [DOI] [PMC free article] [PubMed] [Google Scholar]
- Clack JA. The evolution of tetrapod ears and the fossil record. Brain Behav Evol. 1997;50:198–212. doi: 10.1159/000113334. [DOI] [PubMed] [Google Scholar]
- Clack J, Allin E. The evolution of single- and multiple-ossicle ears in fishes and tetrapods. In: Manley GA, Popper AN, Fay RR, editors. Evolution of the vertebrate auditory system. New York: Springer; 2004. pp. 128–163. [Google Scholar]
- Conlee JW, Parks TN. Origin of ascending auditory projections to the nucleus mesencephalicus lateralis pars dorsalis in the chicken. Brain Res. 1986;367:96–113. doi: 10.1016/0006-8993(86)91583-0. [DOI] [PubMed] [Google Scholar]
- Cramer KS, Fraser SE, Rubel EW. Embryonic origins of auditory brain-stem nuclei in the chick hindbrain. Dev Biol. 2000;224:138–151. doi: 10.1006/dbio.2000.9779. [DOI] [PubMed] [Google Scholar]
- Cramer KS, Bermingham-McDonogh O, Krull CE, Rubel EW. EphA4 signaling promotes axon segregation in the developing auditory system. Dev Biol. 2004;269:26–35. doi: 10.1016/j.ydbio.2004.01.002. [DOI] [PubMed] [Google Scholar]
- Foster RJ, Hall WJ. The organization of central auditory pathways in a reptile, Iguana iguana. J Comp Neurol. 1978;178:783–832. doi: 10.1002/cne.901780412. [DOI] [PubMed] [Google Scholar]
- Fuzessery ZM. Frequency tuning in the anuran central auditory system. In: Fritzsch B, Ryan MJ, Wilczynski W, Hetherington T, Walkowiak W, editors. The evolution of the amphibian auditory system. New York: Wiley; 1988. pp. 253–273. [Google Scholar]
- Glaser ME, Van der Loos H. Analysis of thick brain sections by obverse-reverse computer microscopy: application of a new, high clarity Golgi-Nissl stain. J Neurosci Methods. 1981;4:117–125. doi: 10.1016/0165-0270(81)90045-5. [DOI] [PubMed] [Google Scholar]
- Glatt AF. Vergleichend morphologische Untersuchungen am akustischen System einiger ausgewählter Reptilien. A: Caiman crocodilus. Rev Suisse Zool. 1975a;82:257–281. [PubMed] [Google Scholar]
- Glatt AF. Vergleichend morphologische Untersuchungen am akustischen System einiger ausgewählter Reptilien. B: Sauria, Testudines. Rev Suisse Zool. 1975b;82:469–494. [PubMed] [Google Scholar]
- Grothe B, Carr CE, Casseday JH, Fritzsch B, Köppl C. The evolution of central pathways and their neural processing patterns. In: Manley GA, Popper AN, Fay RR, editors. Evolution of the vertebrate auditory system. New York: Springer; 2005. pp. 289–359. [Google Scholar]
- Grothe B, Pecka M, McAlpine D. Mechanisms of sound localization in mammals. Physiol Rev. 2010;90:983–1012. doi: 10.1152/physrev.00026.2009. [DOI] [PubMed] [Google Scholar]
- Jhaveri SR, Morest DK. Neuronal architecture in nucleus magnocellularis of the chicken auditory system the function of allowing synapses from several cochlear with observations on nucleus laminaris: a light and electron microscope study. Neuroscience. 1982;7:809–835. doi: 10.1016/0306-4522(82)90045-8. [DOI] [PubMed] [Google Scholar]
- Konishi M. Comparative neurophysiological studies of hearing and vocalizations in songbirds. J Comp Physiol A. 1970;66:257–272. [Google Scholar]
- Konishi M. Coding of auditory space. Annu Rev Neurosci. 2003;26:31–55. doi: 10.1146/annurev.neuro.26.041002.131123. [DOI] [PubMed] [Google Scholar]
- Köppl C. Tonotopic projections of the auditory nerve to the cochlear nucleus angularis in the barn owl. JARO. 2001;2:41–53. doi: 10.1007/s101620010027. [DOI] [PMC free article] [PubMed] [Google Scholar]
- Köppl C, Manley GA, Konishi M. Auditory processing in birds. Curr Opin Neurobiol. 2000;10:474–481. doi: 10.1016/s0959-4388(00)00110-0. [DOI] [PubMed] [Google Scholar]
- Krützfeldt NOE, Logerot P, Kubke MF, Wild JM. Connections of the auditory brainstem in a songbird, Taeniopygia guttata. I. Projections of nucleus angularis and nucleus laminaris to the auditory torus. J Comp Neurol. 2010a;518:2109–2134. doi: 10.1002/cne.22334. [DOI] [PMC free article] [PubMed] [Google Scholar]
- Krützfeldt NOE, Logerot P, Kubke MF, Wild JM. Connections of the auditory brainstem in a songbird, Taeniopygia guttata. II. Projections of nucleus angularis and nucleus laminaris to the superior olive and lateral lemniscal nuclei. J Comp Neurol. 2010b;518:2135–2148. doi: 10.1002/cne.22324. [DOI] [PMC free article] [PubMed] [Google Scholar]
- Kubke MF, Massoglia DP, Carr CE. Developmental changes underlying the formation of the specialized time coding circuits in barn owls (Tyto alba) J Neurosci. 2002;22:7671–7679. doi: 10.1523/JNEUROSCI.22-17-07671.2002. [DOI] [PMC free article] [PubMed] [Google Scholar]
- Kunzle H. Projections from the cochlear nuclear complex to rhombencephalic auditory centers and torus semicircularis in the turtle. Brain Res. 1986;379:307–319. doi: 10.1016/0006-8993(86)90785-7. [DOI] [PubMed] [Google Scholar]
- MacLeod KM, Soares D, CCarr CE. Interaural timing difference circuits in the auditory brainstem of the emu (Dromaius novaehollandiae) J Comp Neurol. 2006;495:185–201. doi: 10.1002/cne.20862. [DOI] [PMC free article] [PubMed] [Google Scholar]
- MacLeod KM, Carr CE. Synaptic mechanisms of coincidence detection. In: Trussell LO, Popper AN, Fay RR, editors. Synaptic mechanisms in the auditory system. New York: Springer; 2011. [Google Scholar]
- Manley GA. Auditory responses from the medulla of the monitor lizard Varanus bengalensis. Brain Res. 1976;102:329–334. doi: 10.1016/0006-8993(76)90887-8. [DOI] [PubMed] [Google Scholar]
- Manley GA. Cochlear mechanisms from a phylogenetic viewpoint. Proc Natl Acad Sci U S A. 2000;97:11736–11743. doi: 10.1073/pnas.97.22.11736. [DOI] [PMC free article] [PubMed] [Google Scholar]
- Manley GA. Evolution of structure and function of the hearing organ of lizards. J Neurobiol. 2002;53:202–211. doi: 10.1002/neu.10115. [DOI] [PubMed] [Google Scholar]
- Mello CV, Velho AF, Pinaud R. Song-induced gene expression: a window on song auditory processing and perception. Ann N Y Acad Sci. 2004;1016:263–281. doi: 10.1196/annals.1298.021. [DOI] [PubMed] [Google Scholar]
- Miller MR. The cochlear nuclei of lizards. J Comp Neurol. 1975;159:375–406. doi: 10.1002/cne.901590306. [DOI] [PubMed] [Google Scholar]
- Miller MR. The cochlear nuclei of snakes. J Comp Neurol. 1980;192:717–736. doi: 10.1002/cne.901920407. [DOI] [PubMed] [Google Scholar]
- Miller MR. Quantitative studies of auditory hair cells and nerves in lizards. J Comp Neurol. 1985;232:1–24. doi: 10.1002/cne.902320102. [DOI] [PubMed] [Google Scholar]
- Miller MR, Kasahara M. The cochlear nuclei of some turtles. J Comp Neurol. 1979;185:221–236. doi: 10.1002/cne.901850202. [DOI] [PubMed] [Google Scholar]
- O’Neil JN, Connelly CJ, Limb CJ, Ryugo DK. Synaptic morphology and influence of auditory experience. Hearing Res. 2011 doi: 10.1016/j.heares.2011.01.019. [DOI] [PMC free article] [PubMed] [Google Scholar]
- Parks TN, Rubel EW. Organization and development of the brain stem auditory nuclei of chicken: primary afferent projections. J Comp Neurol. 1978;180:439–448. doi: 10.1002/cne.901800303. [DOI] [PubMed] [Google Scholar]
- Ramón-Moliner E. The Golgi-Cox technique. In: Nauta WJH, Ebbesson SOE, editors. Contemporary methods in neuroanatomy. New York: Springer; 1970. pp. 32–55. [Google Scholar]
- Ramon y Cajal S. Les ganlions terminaux du nerf acoustique des oiseaux Trab. Inst Cajal Invest Biol. 1908;6:195–225. [Google Scholar]
- Rouiller E. Functional organization of auditory pathways. In: Ehret G, Roman R, editors. The central auditory system. Oxford: Oxford University Press; 1997. pp. 3–96. [Google Scholar]
- Ryan MJ, Perrill SA, Wilczynski W. Auditory tuning and call frequency predict population-based mating preferences in the cricket frog, Acris crepitans. Am Nat. 1992;1370:1370–1383. [Google Scholar]
- Ryugo D, Parks TN. Primary innervation of the avian and mammalian cochlear nucleus. Brain Res Bull. 2003;60:435–456. doi: 10.1016/s0361-9230(03)00049-2. [DOI] [PubMed] [Google Scholar]
- Schnupp JWH, Carr CE. On hearing with more than one ear: lessons from evolution. Nat Neurosci. 2009;12:692–697. doi: 10.1038/nn.2325. [DOI] [PMC free article] [PubMed] [Google Scholar]
- Soares D, Carr CE. The cytoarchitecture of the nucleus angularis of the barn owl (Tyto alba) J Comp Neurol. 2001;429:192–205. doi: 10.1002/1096-9861(20000108)429:2<192::aid-cne2>3.0.co;2-5. [DOI] [PubMed] [Google Scholar]
- Szpir MR, Sento S, Ryugo DK. The central projections of the cochlear nerve fibers in the alligator lizard. J Comp Neurol. 1990;295:530–547. doi: 10.1002/cne.902950403. [DOI] [PubMed] [Google Scholar]
- Szpir MR, Wright DD, Ryugo DR. Neuronal organization of the cochlear nuclei in alligator lizards: a light and electron microscopic investigation. J Comp Neurol. 1995;357:217–241. doi: 10.1002/cne.903570204. [DOI] [PubMed] [Google Scholar]
- Takahashi TT, Konishi M. Projections of nucleus angularis and nucleus laminaris to the lateral lemniscal nuclear complex of the barn owl. J Comp Neurol. 1988a;274:212–238. doi: 10.1002/cne.902740207. [DOI] [PubMed] [Google Scholar]
- Takahashi TT, Konishi M. Projections of the cochlear nuclei and nucleus laminaris to the inferior colliculus of the barn owl. J Comp Neurol. 1988b;274:190–211. doi: 10.1002/cne.902740206. [DOI] [PubMed] [Google Scholar]
- ten Donkelaar H. Reptiles, the central nervous system of vertebrates. Vol. 2. Berlin: Springer; 1998. [Google Scholar]
- ten Donkelaar HJ, Bangma GC, Barbas-Henry HA, de Boer-van Huizen R, Wolters JG. The brain stem in a lizard, Varanus exanthematicus. Adv Anat Embryol Cell Biol. 1987;107:1–168. doi: 10.1007/978-3-642-72763-4. [DOI] [PubMed] [Google Scholar]
- Vossen C, Christensen-Dalsgaard J, van Hemmen JL. Analytical model of internally coupled ears. J Acoust Soc Am. 2010;128:909–918. doi: 10.1121/1.3455853. [DOI] [PubMed] [Google Scholar]
- Wang Y, Karten HJ. Three subdivisions of the auditory midbrain in chicks (Gallus gallus) identified by their afferent and commissural projections. J Comp Neurol. 2010;518:1199–1219. doi: 10.1002/cne.22269. [DOI] [PMC free article] [PubMed] [Google Scholar]
- Wild JM, Kubke MF, Carr CE. Tonotopic and somatotopic representation in the nucleus basalis of the barn owl, Tyto alba. Brain Behav Evol. 2001;57:39–62. doi: 10.1159/000047225. [DOI] [PubMed] [Google Scholar]
- Wild JM, Krützfeldt NOE, Kubke MF. Afferents to the cochlear nuclei and nucleus laminaris from the ventral nucleus of the lateral lemniscus in the zebra finch (Taeniopygia guttata) Hearing Res. 2009;257:1–7. doi: 10.1016/j.heares.2009.07.007. [DOI] [PubMed] [Google Scholar]
- Wild JM, Krützfeldt NOE, Kubke MF. Connections of the auditory brainstem in a songbird, Taeniopygia guttata. III. Projections of the superior olive and lateral lemniscal nuclei. J Comp Neurol. 2010;518:2149–2167. doi: 10.1002/cne.22325. [DOI] [PMC free article] [PubMed] [Google Scholar]
- Yan K, Tang YZ, Carr CE. Calcium-binding protein immunoreactivity characterizes the auditory system of Gekko gecko. J Comp Neurol. 2010;518:3409–3426. doi: 10.1002/cne.22428. [DOI] [PMC free article] [PubMed] [Google Scholar]
- Young SR, Rubel EW. Frequency-specific projections of individual neurons in chick brainstem auditory nuclei. J Neurosci. 1983;3:1373–1378. doi: 10.1523/JNEUROSCI.03-07-01373.1983. [DOI] [PMC free article] [PubMed] [Google Scholar]
- Young SR, Rubel EW. Embryogenesis of arborization pattern and topography of individual axons in n. laminaris of the chick brainstem. J Comp Neurol. 1986;254:425–459. doi: 10.1002/cne.902540402. [DOI] [PubMed] [Google Scholar]