Abstract
Human body energy storage operates as a stock-and-flow system with inflow (food intake) and outflow (energy expenditure). In spite of the ubiquity of stock-and-flow structures, evidence suggests that human beings fail to understand stock accumulation and rates of change, a difficulty called the stock–flow failure. This study examines the influence of health care training and cultural background in overcoming stock–flow failure. A standardized protocol assessed lay people’s and health care professionals’ ability to apply stock-and-flow reasoning to infer the dynamics of weight gain/loss during the holiday season (621 subjects from seven countries). Our results indicate that both types of subjects exhibited systematic errors indicative of use of erroneous heuristics. Stock–flow failure was found across cultures and was not improved by professional health training. The problem of stock–flow failure as a transcultural global issue with education and policy implications is discussed.
Introduction
Regarding body weight, people are decision-makers managing a complex dynamic system: the human body. In addition to motivation, this task requires an understanding of how the human energy and weight regulation system works. In this paper, we report the results of a worldwide study assessing public and health care professionals’ (HCPs) understanding of human weight/energy regulation dynamics.
Conceptual background
Research in control theory and behavioral decision making suggests that effective control of a dynamic system requires two essential cognitive skills: (i) the ability to develop an adequate model of the system and (ii) the ability to run that model-inferring system behavior over time (Brehmer, 1990). For the operator to build an adequate model of a system, two levels of knowledge integration are required. First, structural knowledge establishes what the system variables are. Second, functional knowledge establishes how the variables are related to each other, as well as to the system’s external environment (Abdel-Hamid, 2009, 2012). Understanding and predictive skills, respectively referred to as system building and running, while interdependent, are nonetheless conceptually different (Einhorn and Hogarth, 1987). Research suggests that understanding system’s structure does not guarantee proper prediction of system behavior. Human reasoning appears to be inadequate to infer the behavioral implications of a system’s interactions over time (Sterman, 2002). These cognitive limitations may be a consequence of the “bounded rationality” that constrains human decision-making performance (Simon, 1970). It extends to even simple stock–flow (SF) systems, especially systems with nonlinearities, feedback and/or delays (Forrester, 1979; Senge, 1990; Diehl and Sterman, 1995; Gonzalez and Dutt, 2011). In this project we sought to answer the question: do these cognitive limitations apply to weight management and energy regulation?
Individual’s health management behaviors, such as dietary intake and physical activity, are associated with chronic disease later in life. Global public health issues related to dietary intake and physical inactivity include: obesity, cardiovascular diseases, diabetes, metabolic syndrome and some forms of cancer, among others. In this context, individuals’ predictive judgments are critical to understanding and implementing appropriate prophylactic and/or curative interventions (Hall et al., 2012). Predictive judgment allows individuals to prospectively anticipate resources to commit to a treatment and to retrospectively evaluate the use of allocated resources. In addition, regarding weight management, concordance between expected and obtained outcomes of intervention is associated with patient adherence to treatment and thereby with treatment efficacy (Dalle Grave et al., 2005).
Obesity, as an important and complex disease, stands “among the most misunderstood of human conditions” (Sontag, 1990; Shell, 2002). This applies to lay public, health professionals and academics (Casazza et al., 2013). Previous reports have demonstrated that people misperceive their own weight status and its implications on health (Kuchler, 2003). Misconceptions may be related to misunderstanding the cause of a problem, its consequences, the timeline of its change, or in attributing specific symptoms to the underlying disease identity (Leventhal et al., 1980). Each of these dimensions has implications for people’s reaction when facing a disease threat, and all are relevant to obesity. This study focused primarily on timeline, which refers to disease time course, evolution and treatment, and on disease identity, which refers to symptomatology and associated complications.
The stock-and-flow operator model of human energy regulation
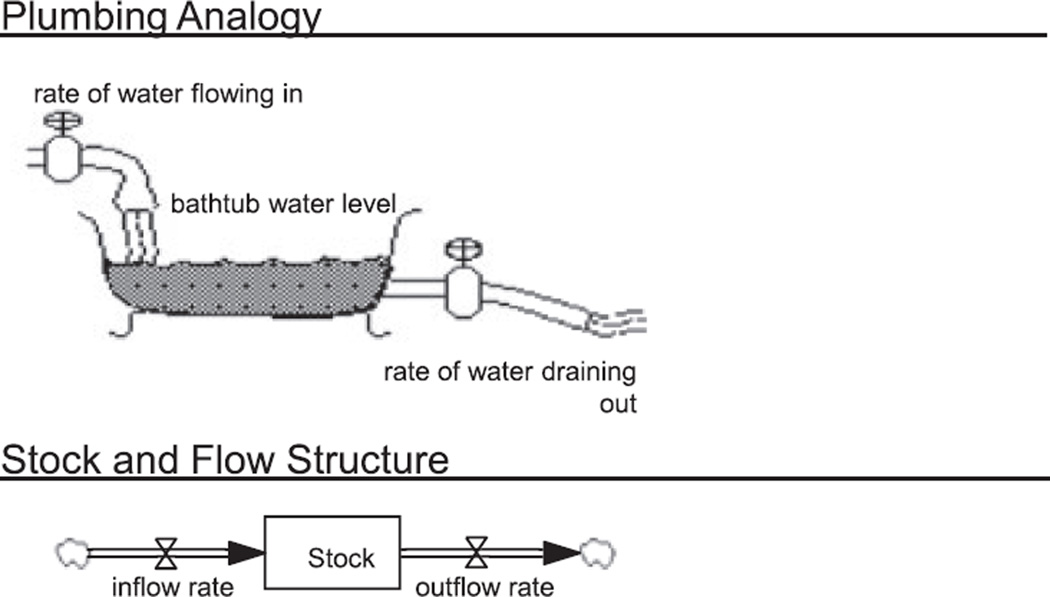
Most people intuitively understand that body weight varies as a function of the difference between energy intake and expenditure. The didactic analogy is the bathtub water level that rises and falls as a function of the rate of water flowing in or draining out (Figure 1) (Booth Sweeney and Sterman, 2000).
Fig. 1.
Stock-and-flow structure of energy regulation
This simple SF structure is by no means unique to human energy regulation; rather, it characterizes many real-life systems and everyday tasks such as managing a checking account or a company’s inventory. It is because of this ubiquity that system dynamicists have long argued that understanding the relationship between stocks and flows is fundamental to understanding and managing a wide range of systems used in human activities (Gonzalez and Wong, 2012).
“Running” the operator’s model
In spite of the importance and ubiquity of stock and flow systems in the real world, research suggests that humans do not infer the dynamics of systems reliably (Booth Sweeney and Sterman, 2000). Indeed many problems, whether individual, organizational or societal, are based on misunderstanding of the basic processes of SF dynamics (Cronin et al., 2009). The “SF failure” seems to be rooted in a “lack of human understanding of accumulation and rate of change” (Gonzalez and Wong, 2012, p. 3). This is often exacerbated by the application of inappropriate heuristics (Cronin et al., 2009). Regarding obesity, if SF failure does apply to human judgment about weight/energy regulation, it could undermine prevention and management efforts.
Study objectives
Traditional holiday season overeating, i.e. during North America’s Thanksgiving and Christmas, is associated with a 25–40 percent increase of caloric intake (Khare and Inman, 2009).
The aim of the present investigation was to conduct a worldwide study to assess public and health professionals’ understanding of stock-and-flow relationships that underlie the dynamics of weight gain/loss, through the case of holiday season overeating. For this purpose, we designed an experimental task to assess the degree to which people misjudge the dynamics of weight change associated with holiday overeating.
Method
Systems-Inspired Global Obesity Study (SIGOS)
Since obesity is recognized as a global health issue (Kelly et al., 2008), this study was conducted worldwide. Our primary research goal was to assess individuals’ understanding of bodyweight dynamics across different populations and cultures. Our secondary research goal was to investigate the extent to which professional health training affects performance. Our third research goal was to address the test proposed by Brunstein et al., who demonstrated that domain experience is not a strong indicator for overcoming SF failure. They concluded that follow-up studies should test results robustness through: (i) wider medical experience of participants; (ii) use of exactly the same method for all groups tested; and (iii) replication of the study in other domains of knowledge (Brunstein et al., 2010, p. 352). SIGOS study was built following Brunstein et al.’s recommendations.
Twenty researchers from health sciences and system dynamics fields, out of the 200 invited by Dr Abdel-Hamid via e-mail, accepted to collaborate. Each of these researchers drew samples from two distinct populations: lay people and health care professionals (HCP) from their local area. A total number of 621 subjects participated.
The experimental task
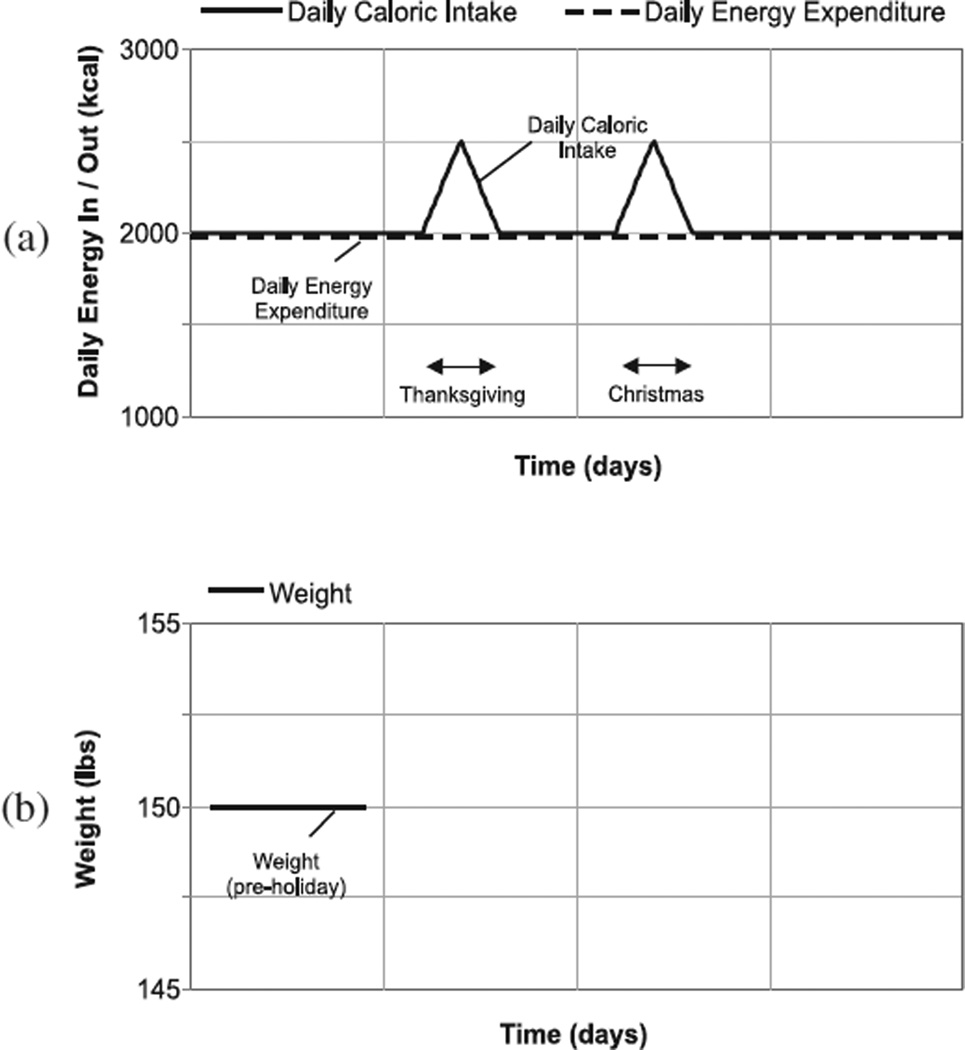
To assess lay persons’ and HCPs’ understanding of SF relationships pertaining to the dynamics of weight gain/loss, we created a typical SF task (Figure 1) that required subjects to determine how body weight (energy stock) varies in response to changes in caloric intake (the inflow) during the holiday season based on an overeating scenario. The exercise sheet (Figure 2a) shows a hypothetical subject at initial steady state of 150 lbs weight and 2000 kcal daily caloric intake and expenditure. The individual’s food intake increases linearly and progressively (by 25 percent), peaking at 2500 kcal/day on Thanksgiving1 and then declines back to 2000 kcal/day. This dietary pattern repeats during Christmas. To simplify the task, energy expenditure is assumed to remain constant throughout at 2000 kcal/day.2 The subjects’ task was to sketch on graph (b) their expectation of how body weight would change over the holiday season. The initial steady-state situation was pre-plotted. The subjects were given 10 minutes to complete the paper-based exercise. Subjects were not paid for participating (nor graded if students).3
Fig. 2.
Standardized exercise sheet. Graph (a) shows the eating behavior of a hypothetical individual during the holiday season. Initially—before the holiday season—assume that she kept her weight steady at 150 lbs, with daily caloric intake (and expenditure) at 2000 kcal. This steady situation changes, however, during the holidays when—like most people—her caloric intake increases by as much as 25 percent. Specifically, assume that her food intake progressively rises—as shown in (a)— peaking at 2500 kcal/day on Thanksgiving Day, and then declines back to 2000 kcal/day. The pattern repeats during Christmas. To simplify things, we’ll assume her energy expenditure remains constant at the 2000 kcal/day level
The solution and its characteristics
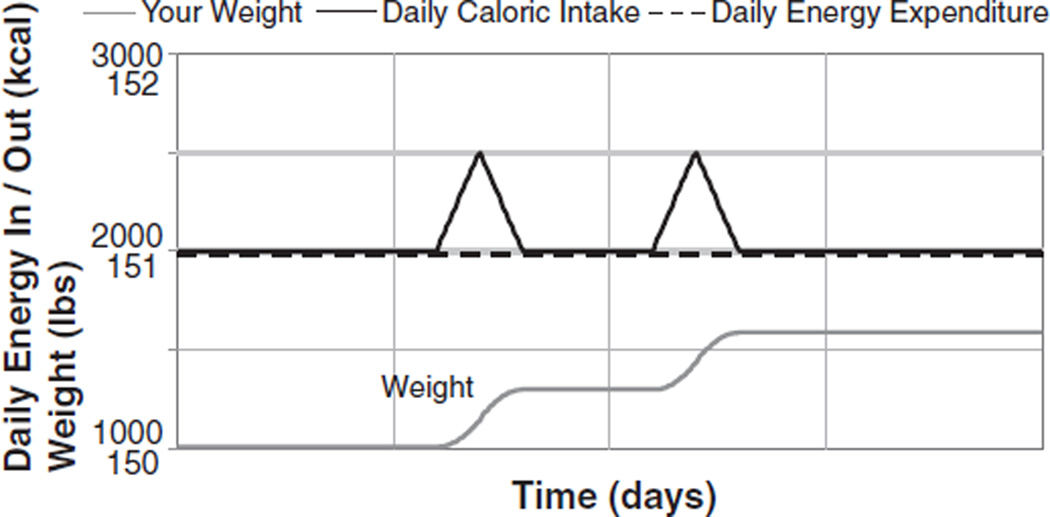
The task was designed to be simple enough to be correctly answered without the use of mathematics. To perform the task with success (Figure 3), subjects needed to apply simple rules governing the replenishment/depletion of a stock as a function of inflows/outflows. Rules that would lead to a correct solution are: (i) whenever the inflow (energy intake or EI) exceeds the outflow (energy expenditure or EE), body weight should rise; and (ii) whenever the inflow is equal to the outflow, body weight should hold steady. Body weight therefore depends on the relative magnitudes of the inflow and outflow; not whether the inflow is increasing or decreasing.
Fig. 3.
The correct solution
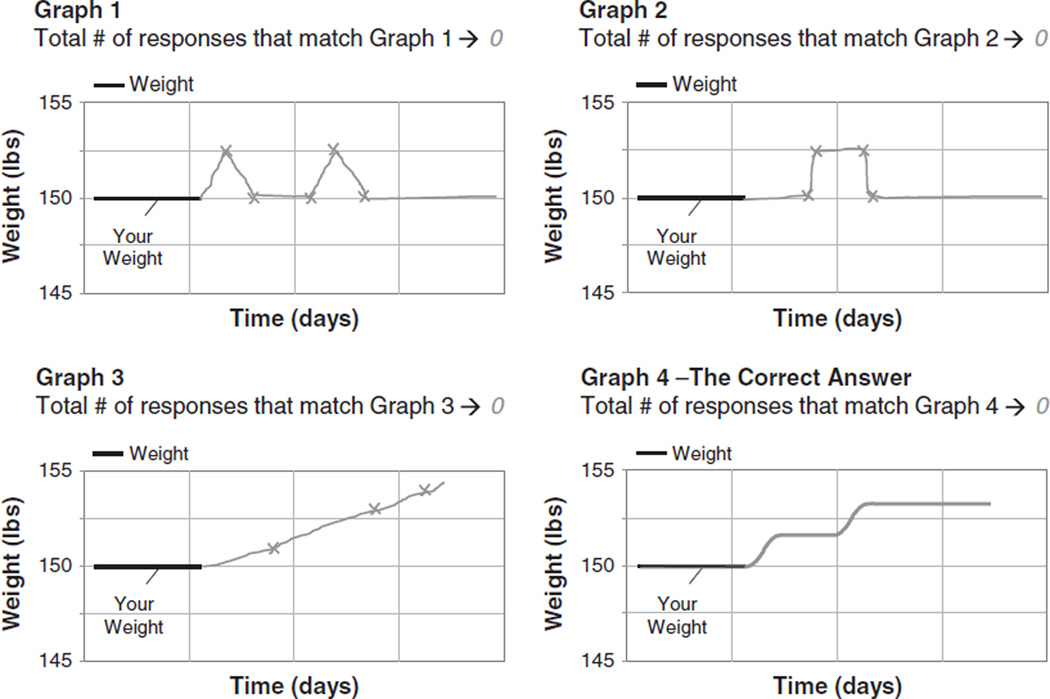
The experimental instrument was pilot tested on student subjects at the Naval Postgraduate School to identify typical responses. In addition, responses on comparable SF tasks published in the literature were catalogued. From these two inputs, a set of four “typical” responses was identified. These four typical sketches, together with two blank panels, were incorporated into a standardized data collection spreadsheet (Figure 4). Each researcher catalogued the number of responses in their sample that matched each of the four typical sketches. The two blank panels were provided so that researchers could record responses that did not fall into the four predefined types.4
Fig. 4.
Standardized data collection template (four “typical” responses)
Subjects
The SIGOS study guidelines specified a minimum sample size of 25 adult subjects and when possible from two distinct groups: lay subjects (mostly undergraduate university student) and health care professionals (Health Care Providers and medical students). Ultimately, 22 samples were drawn from 20 sites in seven countries: U.S.A., Venezuela, Norway, France, China, India and Sri Lanka. Two SIGOS researchers conducted two studies each, one with lay subjects and a second with health care providers; 621 subjects participated in the SIGOS study (71 percent U.S. subjects); 59 percent of the subjects were lay people and 41 percent HCP.
In order to explore our first question of whether experimental task performance varied with demographic characteristics, subjects’ age, sex, weight and height were requested. To protect subjects’ privacy, ID codes were assigned and used instead of names in coding and analysis. Institutional Review Board approval was obtained by each individual investigator as needed.
Results
A chi-square test revealed no significant difference in the distribution of HCP and lay persons between the U.S. and non-U.S. samples (χ2 = 0.047, d.f. = 1, p = 0.83). Demographic comparisons were conducted to assess possible differences between lay and HCP subjects (Tables 1 and 2). There was no significant difference in body mass index (BMI) (t = 0.075, d.f. = 619, p = 0.94) and there was a small but statistically significant difference in ages of 2.9 years (t = 2.932, d.f. = 604.7, p = 0.003). A chi-square test indicated a significantly larger proportion of females amongst HCP versus lay people (χ2 = 15.88, d.f. = 1, p < 0.001). To assess the subjects’ performance on the drawing task, we determined whether participants sketched the correct trajectory of body weight. We graded the qualitative shape as correct if the participant sketched the right trajectory (Figure 5) and incorrect if they drew it differently in any way from the correct shape. Participants were not penalized for quantitatively incorrect drawing patterns.
Table 1.
Subjects’ demographic profiles
| Professional status | Gender | Age | BMI | ||||||||||
|---|---|---|---|---|---|---|---|---|---|---|---|---|---|
| HCP (n = 256) |
Lay (n = 365) |
Male (n = 314) |
Female (n = 307) |
||||||||||
| (n) | % | (n) | % | (n) | % | (n) | % | (n) | μ | (σ) | μ | (σ) | |
| U.S.A. | (442) | 41 | (181) | 59 | (261) | 49 | (218) | 51 | (224) | 30.8 | (11.3) | 24.4 | (4.9) |
| France | (50) | 50 | (25) | 50 | (25) | 50 | (25) | 50 | (25) | 50.0 | (10.3) | 24.3 | (4.1) |
| Norway | (29) | 0 | (0) | 100 | (29) | 59 | (13) | 41 | (12) | 22.1 | (2.01) | 23.2 | (3.2) |
| China | (25) | 0 | (0) | 100 | (25) | 100 | (25) | 0 | (0) | 20.4 | (0.7) | 21.3 | (2.3) |
| Venezuela | (25) | 0 | (0) | 100 | (25) | 28 | (7) | 72 | (18) | 38.3 | (13.5) | 25.0 | (4.6) |
| India | (25) | 100 | (25) | 0 | (0) | 36 | (9) | 64 | (16) | 45.5 | (7.6) | 26.5 | (3.8) |
| Sri Lanka | (25) | 100 | (25) | 0 | (0) | 52 | (13) | 48 | (12) | 36.5 | (8.4) | 23.2 | (2.0) |
Table 2.
HCP versus lay overall
| HCP | Lay | Sig. | |
|---|---|---|---|
| Female | 151 | 156 | |
| Male | 105 | 209 | χ2 = 15.88, d.f. = 1, p < 0.001 |
| Age | 34.3 | 31.4 | t = 2.932, d.f. = 604.7, p = 0.003 |
| BMI | 24.3 | 24.2 | t = 0.075, d.f. = 619, p = 0.94 |
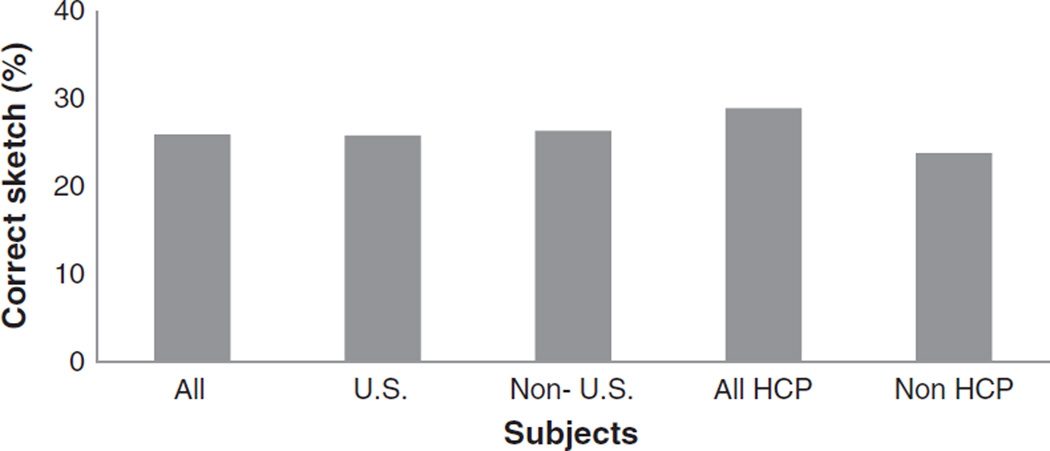
Fig. 5.
Fraction of subjects producing correct sketch
Overall, subjects’ performance was low (Figure 5), with 26 percent of participants producing correct drawings. HCP (29 percent correct) did not perform significantly better (χ2 =2.54,d.f.=1, p = 0.11) than lay subjects (24 percent correct).
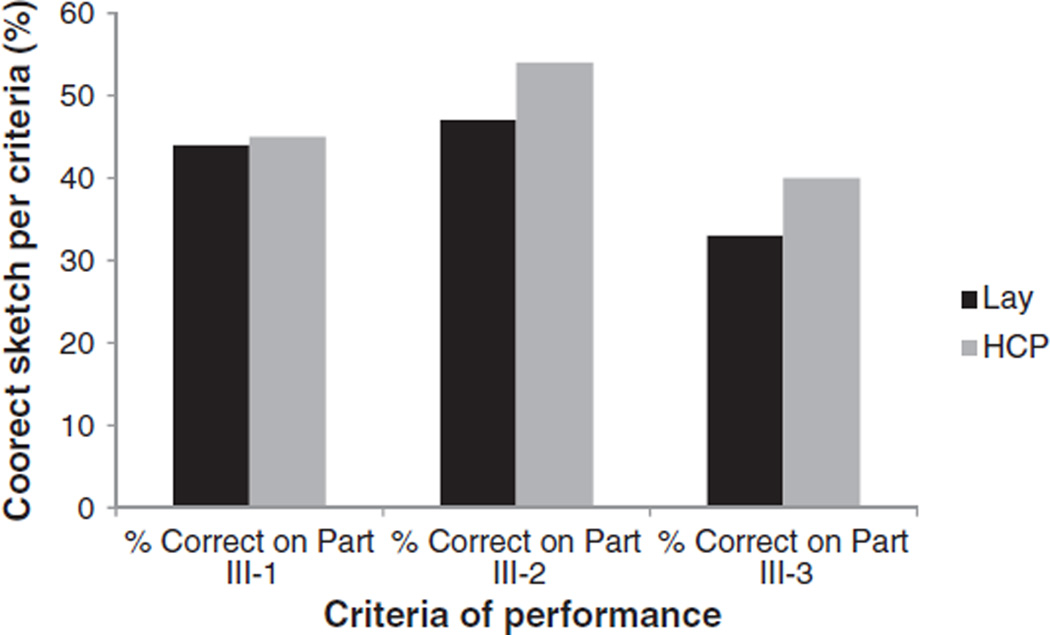
To gain further insight into individuals’ misunderstanding, we created three criteria to evaluate individuals’ drawings (a correct drawing would be correct for all three criteria).
Drawings were scored “1” if correct for each criterion and “0” if incorrect. The majority of subjects drew trajectories that violated one or more of the three criteria (Table 3):
44% correctly drew weight rising when food intake was falling (after peaks 1 and 2);
50% correctly kept weight elevated as energy intake drops between the two peaks;
only 36% placed the peak of final body weight at the right time.
Table 3.
Performance on three qualitative features of correct solution
| Coding of subjects’ graphic sketches | ||||||
|---|---|---|---|---|---|---|
| (1) | (2) | (3) | ||||
| When EI declines after Peak1, but remains > EE weight is Increasing |
Weight remains elevated as EI drops to 2000 between holidays |
Weight remains at its peak after second holiday feast |
||||
| Yes = 1, No = 0 | Yes = 1, No = 0 | Yes = 1, No = 0 | ||||
| Counts | % | Counts | % | Counts | % | |
| All subjects | 275 | 44% | 308 | 50% | 223 | 36% |
| Lay subjects | 161 | 44% | 170 | 47% | 120 | 33% |
| HCP | 114 | 45% | 138 | 54% | 103 | 40% |
Again, on the three criteria, HCP did not perform significantly better than lay people (Figure 6).
Fig. 6.
Comparing lay versus HCP performance on three criteria
To assess performance on all three criteria, we combined the three individual scores into a normalized composite score; a correct criterion was scored “1”, while violation of any criterion scored “0”. As expected, this alternative form of scoring subjects’ responses produced results (Table 4) similar to the graph-based analysis (Figure 5). HCP incorporated all three features of a correct graph somewhat more often than lay people. There was a little more variation in HCP responses (σlay = 0.42 vs. σHCP = 0.45), but differences in performance were limited (28 percent for HCP vs. 23 percent for lay) and not significant (χ2 = 2.01, d.f. = 1, p = 0.16). Using the normalized composite indicator, variations on a logistic regression were then run to test whether age (μ = 32.6, σ = 12.6), BMI (μ = 24.2, σ = 4.6), gender (F = 307,M = 314), or HCP status predicted a subject’s success in producing the correct answer. Neither age (p = 0.94) nor BMI (p = 0.51) was a significant predictor of success (Table 5). HCP status, when considered on its own (Model 4), was not a significant predictor of ability to produce the correct graph. However, we observed a marginally significant (p = 0.052) gender difference in likelihood of success between lay and HCP, with females performing worse than males in this sample. To assess for confounding, we tested for interaction between gender and professional status (Model 2) and then subsetted the data by gender and reran the logistic regressions on the two subsets (not shown). We observed no significant interaction between gender and professional status (p = 0.441). Additionally, in the logistic regression models with males only, we observed that, among males, there was a significant difference in the likelihood of success between lay and HCPs (p = 0.0474). Interestingly, a similar gender effect was observed as in the original Booth Sweeny and Sterman study (2000); in their study, males were also marginally more likely to be successful than females.
Table 4.
Percentages of sketches simultaneously exhibiting all three criteria
| Normalized total score (NTS) | |
|---|---|
| NTS score for all subjects | 0.25 |
| NTS for all HCP subjects | 0.28 |
| NTS for non-HCP subjects | 0.23 |
Table 5.
Logistic regression models
| Dependent variable | ||||
|---|---|---|---|---|
| Correct representation of weight trajectory | ||||
| (1) | (2) | (3) | (4) | |
| Age | −0.003 (0.008) | |||
| BMI | 0.018 (0.021) | |||
| Gender (female = 1) | −0.592 *** (0.197) | −0.490 * (0.261) | −0.628 *** (0.193) | |
| Professional (HCP = 1) | 0.372 * (0.193) | 0.504 ** (0.256) | 0.373 * (0.192) | 0.265 (0.187) |
| Gender: professional | −0.297 (0.386) | |||
| Constant | −1.348 *** (0.539) | −1.030 *** (0.157) | −0.981 *** (0.142) | −1.223 *** (0.125) |
| ObservationsAkaike inf. crit. | 621 691.767 | 621 690.259 | 621 688.851 | 621 697.661 |
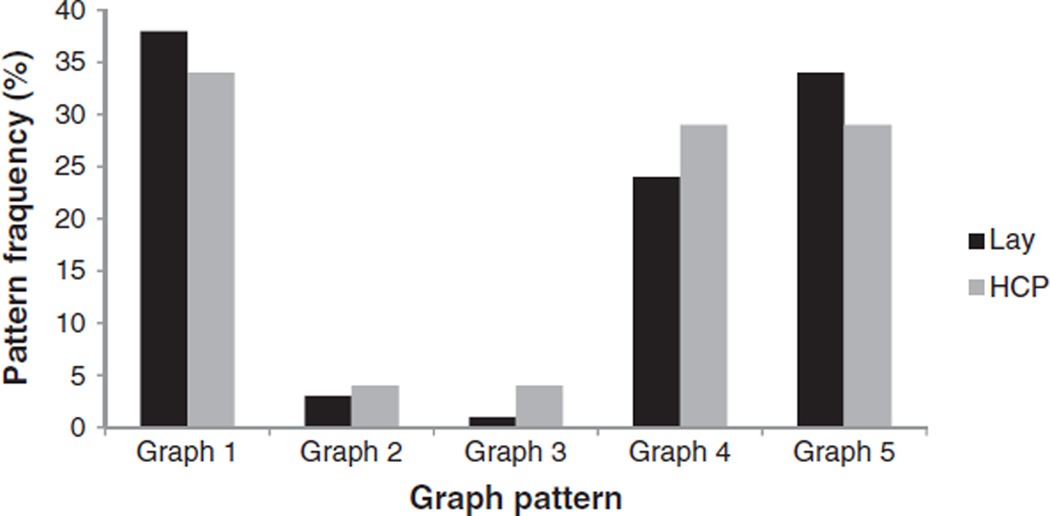
Figure 7 and Table 6a show frequencies of subjects’ graphed responses organized into three categories: correct answer, use of correlation heuristic and otherwise incorrect answers. Correlation heuristic refers to responses that match the pattern of graph 1 in Figure 4, in which body weight matches the pattern of food intake. Use of correlation heuristic was the most frequent type of incorrect answer: 36 percent of participants produced this type of graph. There was no association between the graph type drawn and the subject status as HCP (Table 6b) (χ2 = 2.34, d.f. = 2, p = 0.31).
Fig. 7.
Observed responses by graph pattern (graph 1 represents correlation heuristic, graph 4 represents correct pattern, graph 5 represents all other patterns)
Table 6.
a) Patterns identified overall. b) Patterns identified by professional status
| Correct | Incorrect | Correlation heuristic | |
|---|---|---|---|
| Counts | 161 | 235 | 225 |
| (%) | 25.93% | 37.84% | 36.23% |
| HCP counts | 74 | 96 | 86 |
| (%) | 28.9% | 37.5% | 33.6% |
| Lay counts | 87 | 139 | 139 |
| (%) | 23.8% | 38.1% | 38.1% |
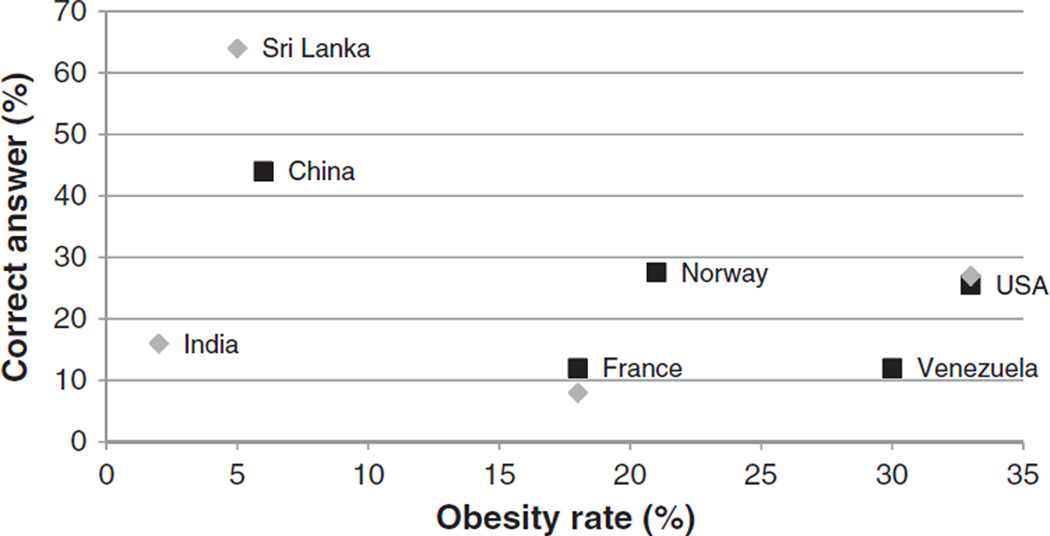
In order to assess between-country differences, we compared average task performances plotted against obesity rate for each country in Figure 8.5 The scatter plot provides a “performance × importance” analysis (IPA) comparison. IPA is a diagnostic and strategic planning approach to assess the consistent allocation of resources, a key determinant of performance, to activities deemed to be important for a society (Eskildsen and Kristensen, 2006).
Fig. 8.
Performance × importance analysis matrix (U.S.A. and France have one label for two points because both countries studied a group in each category; lay is indicated as black square and HCP as grey diamond)
While preliminary, IPA results highlight two interesting questions: (i) is there a causal link between poor performance in assessing weight gain/loss dynamics and effective personal weight management? and (ii) why is the U.S.A. positioned at the lower-right quadrant on the IPA grid?
Discussion
The SIGOS study builds upon a long stream of research investigating decision-making performance on SF tasks (Brehmer, 1992; Sterman, 2000; Sterman and Booth, 2002; Maani and Maharaj, 2004; Li and Maani, 2011). This study demonstrated that individuals’ problems in understanding SF systems extend to their understanding of body weight regulation. This finding has significant implications for public health messaging, health education and health policy. In addition, this study pilot tested a novel social-networking-inspired model for research collaboration and demonstrated its feasibility.
Key findings and implications
In this study we presented highly educated subjects (postgraduate) with a simple task to test their ability to reason about basic SF dynamics relating to weight gain/loss. Overall, both lay and HCP subjects performed poorly. This study demonstrates for the first time that the health issue of regulation of diets to control weight is no exception to SF failure. More specifically, we found that individuals failed to grasp that quantity of a stock rises when the inflow exceeds the outflow, and intuitively assume that the output of a system is positively correlated with its inputs. This cognitive error, known as ‘the correlation heuristic”, is well established (Booth Sweeney and Sterman, 2000; Atkins et al., 2002; Pala and Vennix, 2005; Cronin et al., 2009). Previous investigations of this SF failure have ruled out potential confounders, including lack of contextual knowledge, inadequate motivation, inability to interpret graphics, confusing information displays, cognitive effort and computational complexity (Cronin and Gonzalez, 2007; Cronin et al., 2009).6 Therefore, SF failure appears to be a pervasive deficiency in human reasoning and not an artifact of the task (Cronin et al., 2009). Our results corroborate prior findings from SF experimental studies covering a wide variety of task settings (Booth Sweeney and Sterman, 2000).
Two aspects of the experimental task that many participants, both lay and HCP, found particularly counterintuitive deserve some discussion. First, there was a widespread tendency among subjects to match the trajectories of body weight to the inflow pattern. This use of a correlation heuristic illustrates a basic misunderstanding of the difference between what causes a flow to move in a certain direction (increasing/decreasing) and what causes the associated stock to rise or fall. The correlation heuristic is sometimes appropriate to apply (e.g. illness is highly correlated with the consumption of toxic mushrooms), but in systems with SF structures it can lead to systematic errors, as it does in this case (Cronin et al., 2009). Second, many subjects failed to properly account for the inertia and memory inherent to the process of stock accumulation. After the Christmas feast, body weight does not drop to its original level, even as food intake drops back to pre-holiday level. Rather, body weight remains at its maximum level. Indeed, at any point in time, the amount of energy in the body (the stock) reflects the cumulative effect, over time, of the net inflows over outflows, not merely the instantaneous flow status at a particular time point. Therefore, stocks are said to provide systems with inertia because they establish a “memory” of all past events in the system. Failure to recognize the stock-related inertia/memory in personal health may be a “self-serving” and presumably pervasive misconception that has potentially serious implications in judging and managing health risks (Hall et al., 2012). For example, weight gain and lack of compensation after holiday season overeating have been previously reported (Brownell and Horgen, 2004; Yanovski et al., 2000; Parker-Pope, 2005).
Our study also revealed a particularly disturbing observation: HCPs did not perform better than lay subjects. Many HCPs drew trajectories that violated even basic physical principles such as the conservation of energy/matter, i.e. failing to realize that the quantity in a stock must increase if the inflow exceeds outflow, even if inflow is decreasing. This observation raises the question of the impact of domain experience in overcoming SF failure. Brunstein et al. (2010) explored lay persons’ and medical students’ SF reasoning performance on medical and non-medical accumulation problems, using various task displays. These authors showed that domain experience (duration of medical education and age) “is not a strong indicator for SF performance”. In SIGOS, practicing HCPs from different countries and medical educational systems performed similarly to lay subjects and medical students in terms of SF failure, suggesting that, in addition to duration of education, daily medical practice does not improve SF performance. Therefore SIGOS results corroborate the conclusions of prior work on SF failure and extend them to the domain of weight regulation.
Assuming our results are replicated, they raise serious concerns. Fundamentally human beings cannot effectively manage what they do not understand. Therefore, misconception of the SF dynamics underlying body weight will lead to erroneous inferences about their health-associated risks. This could severely undermine obesity prevention and management efforts. In consequence, both lay (general public and undergraduate) and HCP (medical graduate and practitioners) might benefit from developing an intuitive appreciation of the basics of SF dynamics in order to use an appropriate heuristic. Linking these concepts to human bioenergetics should promote a paradigm shift and create a common consensual cognitive framework. For lay people it would clear up confusion, favor new habits in weight management and sensitize them to obesity prevention programs. For HCPs, it would improve understanding of pathology and therapeutic strategies as well as mutual understanding with patients, thereby potentially improving medical care compliance and efficacy. Poor performance by HCP on SF tasks underscores the need to incorporate systems thinking into health education curricula. One potential starting point could be the use of teaching-pictures recently shown to simplify resolution of accumulation problems (Brockhaus et al., 2013). This might help individuals to develop intuition for dynamics. Overall, the social-networking-inspired model for research collaboration has pros (cost/time effectiveness, transdisciplinarity and worldwide dimension) and cons (decontextualized interactions, terminology issues resulting from transdisciplinarity). This research collaboration model requires a high level of commitment but generates reciprocal scientific emulation.
Future research directions
Because obesity rates differ widely among populations and/or cultures, the levels of public discourse and public health “educational” interventions differ widely as well. This raises a number of policy questions: what effect, if any, do public awareness and public health education have on enhancing people’s understanding of body weight/energy regulation and of its dynamics? And does it matter?
Unraveling the effect of the causal link, if any, between understandings of SF dynamics related to weight gain/loss and effective personal weight management is an experimentation challenge. Since obesity is a complex multifactorial condition, it is unlikely that understanding the dynamics of personal weight/energy regulation is a sufficient condition on its own for effective weight management. But is it a necessary condition? IPA results suggest it may well be a promising research endeavor with potentially significant policy and health implications. This point is perhaps best illustrated by Sri Lanka’s intriguing results, whose HCPs achieved the highest performance, with 64 percent correct responses at a low 5 percent obesity rate. The IPA raises a second critical policy question: why is the U.S.A. in the lower-right quadrant of the grid, despite its government’s committed educational efforts about obesity and guidelines to promote healthy weight? For the U.S.A. not to be in the upper-left quadrant, high performance and low obesity rate may be related to significant delays encountered in translating public understanding into behavioral changes and in creating supportive environments (physical and economical). For the U.S.A. not to be in the upper-right quadrant (high performance and high obesity rate) is surprising and might be of concern. To understand whether this is a public policy failure, and to propose alternatives, is a legitimate concern that needs to be addressed.
In conclusion, altogether, our findings suggest that SF failure is a global problem rather than a problem unique to a particular culture. Therefore it might be possible to envisage a common solution. One potential intervention would be to provide system-dynamics-based insights about health issues such as obesity and associated complications to individuals and their health care providers. We believe this could contribute to improved human health worldwide.
Acknowledgements
We thank Dr Alba Salas Paredes, Facultad de Farmacia y Bioanálisis, Universidad de Los Andes, Mérida, Venezuela, for his contribution in the acquisition of data and Dr Karen T. Cuenco, University of Pittsburgh, for her input and comments on the statistical analysis. Financial support (Prof. Marathe) was provided through NIH MIDAS Grant 2U01GM070694-09 and 3U01FM070694-09S1; DTRA Grant HDTRA1-11-1-0016. We thank anonymous reviewers for their valuable and constructive comments and are grateful to SDR editors and Laura Black for their insightful advice.
Biographies
Tarek Abdel-Hamid Department of Information Sciences, Naval Postgraduate School, Monterey, CA 93943, U.S.A.
Felix Ankel University of Minnesota Medical School Emergency Department, Saint Paul, United States.
Michele Battle-Fisher Wright State Boonshoft School of Medicine, Center for Global Health, Kettering, United States.
Bryan Gibson University of Utah, VA Salt Lake City Healthcare System, Salt Lake City, United States.
Gilberto Gonzalez-Parra Universidad de los Andes, Departamento de Cálculo, Merida, Venezuela.
Mohammad Jalali Virginia Tech, Management Systems Engineering, Falls Church, United States.
Kirsikka Kaipainen VTT Technical Research Centre of Finland, VTT, ICT for Health, Tampere, Finland.
Nishan Kalupahana University of Tennessee, UT Obesity Research Center and Department of Animal Science, Knoxville, Tennessee, United States.
Ozge Karanfil MIT, Sloan School, Cambridge, United States.
Achla Marathe Virginia Bioinformatics Institute, Department of Agricultural and Applied Economics, Blacksburg, United States.
Brian Martinson Health Partners Research Foundation, Minneapolis, United States.
Karma McKelvey Florida International University, Epidemiology, Miami, United States.
Suptendra Nath Sarbadhikari Indian Ministry of Health & Family Welfare, Centre for Health Informatics, New Delhi, India.
Stephen Pintauro University of Vermont, Nutrition and Food Sciences, Burlington, United States.
Patrick Poucheret Université Montpellier, Laboratoire de Pharmacologie et Physiopathologie Expérimentale, Montpellier, France.
Nicolaas Pronk Health Partners Research Foundation, Bloomington, United States.
Ying Qian Shanghai University, Information Management, Shanghai, China.
Edward Sazonov University of Alabama, Electrical and Computer Engineering, Tuscaloosa, United States.
Kim Van Oorschot BI Norwegian Business School, Department of Leadership and Organizational, Behaviour, Nydalsveien 37 0442 Oslo, Norway.
Akshay Venkitasubramanian North Carolina State University, Health Systems Engineering Laboratory, Raleigh, United States.
Philip Murphy Monterey Institute of International Studies, International Policy Studies, Monterey United States.
Footnotes
Non-U.S. participants were asked to substitute the Thanksgiving/Christmas designations with their own pair of local holidays (a pair of eating-type holidays that are approximately 1 month apart) to ensure the cover story fits the cultural context of their study.
In reality, even if physical activity is unchanged, a person’s total daily energy expenditure (EE) changes if body weight and composition change in response to overeating. For example, weight gain often triggers metabolic adaptations that increase resting energy expenditure (REE). However, changes in total EE induced by 4–8 days of overeating (as per our scenario) would be quite small.
A note to the reader: before proceeding to the next section, we suggest you take a few minutes to sketch your own solution.
After the study was conducted, experimental subjects were referred to an online implementation of the task for the opportunity to “play” it again online and/or to access an interactive tutorial explaining the correct solution. The online version remains available for public access on: http://forio.com/simulate/tkabdelh/lab-u-forio/overview/.
Source of national obesity rates: The World Factbook, Central Intelligence Agency (https://www.cia.gov/library/publications/the-world-factbook/rankorder/2228rank.html).
The simple graphs had five points and represented a 5-minute time period, whereas the complex graphs had 21 points and represented a 21-minute time period. The shapes of the graphs were identical.
References
- Abdel-Hamid TK. Thinking in Circles about Obesity: Applying Systems Thinking to Weight Management. New York: Springer; 2009. [Google Scholar]
- Abdel-Hamid TK. EUREKA: insights into human energy and weight regulation from simple—bathtub-like—models. International Journal of System Dynamics Applications. 2012;1(3):139–177. [Google Scholar]
- Atkins PWB, Wood RE, Rutgers PJ. The effects of feedback format on dynamic decision making. Organizational Behavior and Human Decision Processes. 2002;88(2):587–604. [Google Scholar]
- Booth Sweeney L, Sterman JD. Bathtub dynamics: initial results of a systems thinking inventory. System Dynamics Review. 2000;16(4):249–294. [Google Scholar]
- Brehmer B. Strategies in real-time, dynamic decision making. In: Einhorn Hillel J, Hogarth R., editors. Insights in Decision making: A Tribute. Chicago, IL: University of Chicago Press; 1990. [Google Scholar]
- Brehmer B. Dynamic decision making: human control of complex systems. Acta Psychologica (Amsterdam) 1992;81(3):211–241. doi: 10.1016/0001-6918(92)90019-a. [DOI] [PubMed] [Google Scholar]
- Brockhaus F, Arnold J, Schwarz M, Sedlmeier P. Does modification of representation format affect stock–flow thinking?; Proceedings of the 2013 International Conference of the System Dynamics Society; Cambridge, MA. 2013. [Google Scholar]
- Brownell KD, Horgen KB. Food Fight. Chicago, IL: Contemporary Books; 2004. [Google Scholar]
- Brunstein A, Gonzalez C, Kanter S. Effects of domain experience in the stock–flow failure. System Dynamics Review. 2010;26(4):347–354. [Google Scholar]
- Casazza K, Fontaine KR, Astrup A, Birch LL, Brown AW, Bohan Brown MM, Durant N, Dutton G, Foster M, Heymsfield SB, McIver K, Mehta T, Menachemi N, Newby PK, Pate R, Rolls BJ, Sen B, Smith DL, Thomas DM, Allison DB. Myths, presumptions, and facts about obesity. New England Journal of Medicine. 2013;368(5):446–454. doi: 10.1056/NEJMsa1208051. [DOI] [PMC free article] [PubMed] [Google Scholar]
- Cronin MA, Gonzalez C. Understanding the building blocks of system dynamics. System Dynamics Review. 2007;23(1):1–17. [Google Scholar]
- Cronin MA, Gonzalez C, Sterman JD. Why don’t well-educated adults understand accumulation? A challenge to researchers, educators, and citizens. Organizational Behavior and Human Decision Processes. 2009;108(1):116–130. [Google Scholar]
- Dalle Grave R, Calugi S, Molinari E, Petroni ML, Bondi M, Compare A, Marchesini G QUOVADIS Study Group. Weight loss expectations in obese patients and treatment attrition: an observational multicenter study. Obesity Research. 2005;12(12):1961–1969. doi: 10.1038/oby.2005.241. [DOI] [PubMed] [Google Scholar]
- Diehl E, Sterman J. Effects of feedback complexity on dynamic decision making. Organizational Behavior and Human Decision Processes. 1995;62(2):198–215. [Google Scholar]
- Einhorn HJ, Hogarth RM. Decision making: going forward in reverse. Harvard Business Review. 1987;65(1):66–70. [Google Scholar]
- Eskildsen JK, Kristensen K. Enhancing importance performance analysis. International Journal of Productivity and Performance Management. 2006;55(1):40–60. [Google Scholar]
- Forrester JW. System dynamics: future opportunities paper D-3108-1. MA: The System Dynamics Group, Sloan School of Management; 1979. [Google Scholar]
- Gonzalez C, Dutt V. A generic dynamic control task for behavioral research and education. Computers in Human Behavior. 2011;27(5):1904–1914. [Google Scholar]
- Gonzalez C, Wong H. Understanding stocks and flows through analogy. System Dynamics Review. 2012;28(1):3–27. [Google Scholar]
- Hall KD, Heymsfield SB, Kemnitz JW, Klein S, Schoeller A, Speakman JR. Energy balance and its components: implications for body weight regulation. American Journal of Nutrition. 2012;95(4):989–994. doi: 10.3945/ajcn.112.036350. [DOI] [PMC free article] [PubMed] [Google Scholar]
- Kelly T, Yang W, Chen C, Reynolds K, He J. Global burden of obesity in 2005 and projections to 2030. International Journal of Obesity. 2008;32(9):1431–1437. doi: 10.1038/ijo.2008.102. [DOI] [PubMed] [Google Scholar]
- Khare A, Inman JJ. Daily, week-part, and holiday patterns in consumers’ caloric intake. Journal of Public Policy and Marketing. 2009;28(2):234–252. [Google Scholar]
- Kuchler F, Variyam JN. Mistakes were made: misperception as a barrier to reducing weight. International Journal of Obesity. 2003;27(7):856–861. doi: 10.1038/sj.ijo.0802293. [DOI] [PubMed] [Google Scholar]
- Leventhal H, Meyer D, Nerenz DR. The common sense representation of illness danger. In: Rachman S, editor. Contributions to Medical Psychology. Vol. 2. New York: Pergamon Press; 1980. pp. 7–30. [Google Scholar]
- Li A, Maani KE. Dynamic decision-making, learning and mental models; Proceedings of the 29th International Conference of the System Dynamics Society; Washington, DC. 2011. [Google Scholar]
- Maani KE, Maharaj V. Links between systems thinking and complex decision making. System Dynamics Review. 2004;20(1):21–48. [Google Scholar]
- Pala Ö, Vennix AM. Effect of system dynamics education on systems thinking inventory task performance. System Dynamics Review. 2005;21(2):147–172. [Google Scholar]
- Parker-Pope T. The skinny on holiday weight gain: it’s not as bad as you think, but it sticks. Wall Street Journal. 2005 Dec 13; D1. http://online.wsj.com/news/articles/SB113443439581520726. [Google Scholar]
- Senge PM. The Fifth Discipline: The Art and Practice of the Learning Organization. New York: Doubleday/Currency; 1990. [Google Scholar]
- Shell E. The Hungry Gene: The Inside Story of the Obesity Industry. New York: Grove Press; 2002. [Google Scholar]
- Simon HA. Sciences of the Artificial. Cambridge, MA: Massachusetts Institute of Technology Press; 1970. [Google Scholar]
- Sontag S. Illness as Metaphor. New York: Picador; 1990. [Google Scholar]
- Sterman JD. Business Dynamics: Systems Thinking and Modeling for a Complex World. Boston, MA: Irwin McGraw-Hill; 2000. [Google Scholar]
- Sterman JD. All models are wrong: reflections on becoming a systems scientist. System Dynamics Review. 2002;18(4):501–531. [Google Scholar]
- Sterman JD, Booth Sweeney L. Cloudy skies: assessing public understanding of global warming. System Dynamics Review. 2002;18(2):207–240. [Google Scholar]
- Yanovski JA, Yanovski SZ, Sovik KN, Nguyen TT, O’Neil PM, Sebring NG. A prospective study of holiday weight gain. The New England journal of medicine. 2000;342(12):861–867. doi: 10.1056/NEJM200003233421206. [DOI] [PMC free article] [PubMed] [Google Scholar]


