

Abstract
BACKGROUND
Reproductive toxicity of Atrazine (ATR) was evaluated in two rat multigenerational studies. Development of male reproductive parameters was evaluated in separate studies after prenatal or postnatal exposure.
METHODS
In multigenerational studies, rats received dietary concentrations of 0, 10, 50, 100 or 500 ppm ATR. In separate studies in female rats, ATR was administered by gavage at 0, 1, 5, 25 or 125 mg/kg/day during pregnancy (GD6–21) or lactation (LD2–21). Plasma testosterone concentration, testicular and epididymal weights, and sperm counts were measured in male offspring on PND70 and 170.
RESULTS
In the multigenerational studies, parental systemic toxicity occurred at 500 ppm (38.7 mg/kg/day), but reproductive endpoints were unaffected. In the prenatal study, maternal toxicity and embryo-fetal mortality occurred at 125 mg/kg/day. In male offspring, testosterone levels and sperm counts were unaffected, although the percentage of abnormal sperm increased at 125 mg/kg/day (PND 70) and 25 mg/kg/day (PND170). In the postnatal study, maternal toxicity and reduced body weights of male offspring occurred at 125 mg/kg/day. Additionally, reduced testicular (PND70, PND170) and epididymal (PND70) weights and increased numbers of abnormal sperm (PND70, PND170) were seen, but no changes in plasma testosterone or sperm counts.
CONCLUSIONS
Dietary administration of ATR did not affect rat reproduction up to a parentally toxic dose of 38.7 mg/kg/day. Some effects on male reproductive system development occurred after high dose, bolus administration to dams, but doses were much higher than expected under normal use conditions. Thus, oral RfDs for ATR would be protective for reproductive effects
Keywords: atrazine, multigeneration reproduction, postcoitum, gestation, lactation, male development, rat
INTRODUCTION
Atrazine (ATR) is a chlorotriazine herbicide used in agriculture to control broadleaf weeds and some grasses in maize, sugar cane, and sorghum field crops (Breckenridge et al., 2010). ATR inhibits photosynthesis through blockade of electron transfer by reversibly binding to the plastoquinone-binding protein of water–plastoquinone oxidoreductase of photosystem II, which is unique to plant chloroplasts (Tischer and Strotmann, 1977; Good, 1961).
Several epidemiology studies (reviewed by Goodman et al., 2014) evaluated the association between agricultural practices, including ATR use, and reproductive health effects including miscarriages, premature delivery, birth defects, and small-for-gestational-age infants. Overall, no consistent associations between ATR use and adverse reproductive or developmental outcomes were observed, and as pointed out by the Scientific Advisory Panel to the USEPA, the studies had limitations that rendered them unsuitable for risk assessment purposes (USEPA, 2010).
Previous published studies reported that high doses of ATR administered by gavage resulted in embryotoxicity (Cummings et al., 2000; Narotsky et al., 2001; Scialli et al., 2014) and changes in male (Trentacoste et al., 2001; Friedmann, 2002) or female reproductive endpoints including reproductive hormones; sperm count; and morphologic, developmental (Laws et al., 2000; Stoker et al., 2000; Ashby et al., 2002; Rayner et al., 2004, 2007; Davis et al., 2011), or functional outcomes (Peters and Cook, 1973). High doses of ATR administered by gavage have been reported to affect female reproductive processes including impact on the estrous cycle (Cooper et al., 1996), reduction in the luteinizing hormone (LH) surge (Cooper et al., 2000; Simpkins et al., 2011), decreased number of corpora lutea (Foradori et al., 2014), and decreased number of ova shed (Cooper et al., 1996; Foradori et al., 2014). However, these effects were not observed when ATR was administered as a temporally distributed dose in feed (Foradori et al., 2014). Only one study evaluated the multigenerational reproductive effects of 50 ppb ATR administered in drinking water as a mixture with several other pesticides and nitrate (Heindel et al., 1994). Since the potential effects of ATR on reproduction have not been adequately addressed in the published literature, the results from two multigeneration reproduction feeding studies in rats are provided. One study (ATR1) was conducted before the development of standard guidelines or good laboratory practices (GLP), and the high dose did not elicit maternal toxicity. Therefore, a second study was subsequently conducted (ATR2). To permit a comparison to recent publications on gestational (Fraites et al., 2011) or postnatal exposure to ATR (Davis et al., 2011), the results from two studies on male reproductive development following either in utero or postnatal exposure to ATR are also presented.
METHODS
A three-generation reproduction study (ATR1), a two-generation reproduction study (ATR2), a study of gestational exposure with postnatal developmental evaluation in males (ATR3), and a study of lactational exposure with postnatal developmental evaluation in males (ATR4) were conducted according to GLP guidelines (ATR2–ATR4). Three of the studies (ATR1, ATR3, ATR4) were conducted in contract toxicology laboratories (ATR1: Woodard Research Corporation, Herndon, VA, 1966; ATR 3 and ATR4: Covance Laboratories, Muenster, Germany, 2008) and one (ATR2; 1987) was conducted in a laboratory of Syngenta Crop Protection, LLC, formerly Ciba-Geigy Corporation; Safety Evaluation Facility, Summit, New Jersey. All laboratories followed existing animal welfare guidelines. Animals for all studies were housed under controlled temperature, humidity, and light conditions and were fed certified diets. Animals were observed daily for changes in appearance, behavior, and mortality, and food consumption and body weight were monitored regularly.
Multigeneration Reproduction Studies of ATR in Rats
Three-generation study (ATR1)
Albino rats (Charles River Breeding Laboratories) were randomly divided into three dose groups with 10 males and 20 females in each group. Figure1 summarizes the experimental design for ATR1.
Figure 1.

Study design for three-generation dietary study, ATR1. F0 (parental), F1, and F2 generations were administered 0, 50, or 100 ppm ATR in the diet from 10 to 15 weeks before mating. Each generation was mated twice. The first litter (litter a) was examined and discarded; representative pups from the second litter (litter b) were treated and subsequently mated to produce the next generation.
Animals were fed powdered diets (Purina Laboratory Chow) containing ATR (80% purity) at concentrations of 0, 50, or 100 ppm (based on active moiety). Because young rats consume more food per kilogram body weight than older rats, animals in each generation were fed a diet containing one half of the ATR concentration in adult feed for the first 3 weeks in an attempt to keep ATR doses relatively constant. In each generation, young rats of both sexes were exposed for 10 to 15 weeks (depending on the generation) after which they were mated to produce two litters. The first litter in each generation was weighed, examined, and discarded. One or two pups from the second litter were retained as parents of the next generation (10 males, 20 females per group). Pregnancy and fertility endpoints were evaluated, and a gross necropsy and histopathological examination were conducted on one animal per sex per litter at weaning of the F3b pups. Litters were not culled to a standard litter size during the lactational period.
Two-generation study (ATR2)
Male and female SD-derived rats (SD is Sprague Dawley; CRCD, VAF/PLUS) were obtained from Charles River Laboratories (Kingston, NY) and randomly assigned to treatment groups (30/sex/group). F0 generation animals were fed Purina 5002 Certified Rodent Chow containing ATR (97.8% purity) at concentrations of 0, 10, 50, or 500 ppm (0, 0.73, 3.64, or 38.7 mg/kg/day). The homogeneity and stability of ATR in rodent diet were verified by HPLC analysis before study initiation and dietary concentrations were confirmed periodically during the study to be within 93 to 105% of target. The high dose of 500 ppm was selected because 1000 ppm in a carcinogenicity study on ATR exceeded the maximum tolerated dose (MTD) (Stevens et al., 1999), and no effects on maternal parameters were observed at 100 ppm in ATR1. After 10 weeks of treatment, males and females were mated, and exposure to ATR in the diet continued for the pregnant F0 dams through delivery of pups and lactation. At weaning, 30 male and 30 female pups (F1 generation) were selected from each dose group and fed the same diet for 12 weeks. F1 animals were allowed to mate (avoiding mating of littermates), and dietary exposure to ATR continued until weaning of the F2 litters. All parental animals (F0 and F1) were sacrificed after either completion of mating (males) or completion of lactation (females). Pregnancy and fertility endpoints were evaluated, and necropsies were performed on F2 pups at postnatal day (PND) 4 or at weaning. On PND 4, litters were adjusted to four males and four females where possible.
Statistical analyses were conducted as follows. For parental body weight, body weight gain, feed consumption, and absolute and relative organ weights, Bartlett's test was used to confirm homogeneity of variance (Snedecor and Cochran, 1968), followed by a one-way analysis of variance (ANOVA; Snedecor and Cochran, 1968). If the ANOVA revealed a significant effect, a pairwise comparison between control and each of the treated groups was conducted using Dunnett's method of multiple comparisons (Dunnett, 1955, 1964). F1 male and female pup weights (preweaning) were analyzed using a covariate analysis (ANCOVA), with the litter size on PND 0 as the covariate. Preimplantation loss and postimplantation loss were either analyzed with Mantel's trend test (Mantel, 1963) or with a chi-bar-squared test using normalized scores generated using the Blom method (Blom, 1958). Mantel's trend test was used to analyze pup sex ratio; fertility, mating, and gestation indices; gestation duration (two-sided); and pup survival (one-sided). The proportion of female rats mating was cross-classified by treatment groups and cohabitation intervals. Analysis was accomplished by treating cohabitation as a quantitative index (Bhapkar, 1968), and a mean score was calculated for each group based on proportion mated and cohabitation interval. Mean scores were analyzed with a chi-squared test. The litter size was analyzed with a chi-bar-squared test using normalized scores generated using Blom's method. For trend tests, if a positive trend was revealed, then multiple comparisons were conducted using the same trend test.
Special Reproduction Studies
Reproductive development of male rats after in utero exposure to ATR (ATR3)
Groups of 25 time-mated female Wistar rats (Fa. Harlan-Winkelmann GmbH, Borchen, Germany) were treated daily by oral gavage with the vehicle (Mondamin brand of finely ground corn starch, 2% in water) or ATR (99.5% purity) at dose levels of 0, 1, 5, 25, and 125 mg/kg from gestation day (GD) 6 through GD 21. The homogeneity and stability of ATR in oral formulations were verified by HPLC analysis, and concentrations were within acceptable ranges (98–108% of nominal). Dams were allowed to litter and rear their offspring to weaning. Pregnancy, parturition, and litter parameters were evaluated. The parental animals, female offspring, and, where possible, one male pup per litter, were euthanized at weaning and necropsied. After weaning, the remaining F1 male offspring (exposed in utero to ATR) were group-housed until PND 70, at which time 25 males per group were randomly selected for sperm evaluation. Thirty-five of the remaining F1 males were randomly selected to remain on the study through PND 170, at which time 25 males per group were randomly selected for sperm evaluation. Testosterone concentrations in plasma were also determined on PND 70 and PND 170. Throughout the study, animals had ad libitum access to a commercial powdered diet for laboratory animals (Ssniff Spezialdiatem GmbH, Soest, Germany).
Sperm analyses and testosterone assays were conducted in the laboratory of Dr. I. Chahoud (Freie Universität Berlin). Males selected for sperm analysis were necropsied and adrenal glands, epididymides, pituitary, prostate, seminal vesicles, and testes were weighed. The left testis and left cauda epididymis were separately minced and homogenized in 0.9% NaCl with 0.5% Triton X-100. Homogenization-resistant spermatids or spermatozoa in testes or epididymides, respectively, were counted in a hemocytometer. Spermatozoa obtained from the ductus deferens were stained with 2% eosin and assessed morphologically using a light microscope at 40× magnification; sperm with abnormal heads or abnormal tails were recorded and the percentage of sperm evaluated (N = 200) that were abnormal was calculated. Plasma testosterone was measured in duplicate using an ELISA kit (IBL, Germany) according to manufacturer's instructions.
Statistical analyses were conducted as follows. F0 and F1 postweaning body weight, food consumption, duration of gestation, number of implantations, number of pups delivered, and number of live pups (on days 1, 4, 6, 14, 21 postpartum) were statistically analyzed as parametric data using the statistical package of the online data collection system TERASYS. Briefly, Levene's Test (Sachs, 1984) was used to test for homogeneity of variances, and data were transformed using a rank transformation if they were determined to be heterogeneous. A one-way ANOVA was then conducted, followed by a two-tailed Dunnett's t-test if the ANOVA was significant (Dunnett, 1955; Sachs, 1984; Luginbuhl et al., 1987). For mean pup weight per litter (PNDs 0–21), analysis was conducted in the TERASYS system using ANCOVA (Sachs, 1984; Luginbuhl et al., 1987). Organ weights and individual organ/body weight ratios were analyzed using SAS (Release 6.12). Bartlett's test was used to test for homogeneity of variances. Rank transformation occurred for individual organ/body weight ratios (considered nonparametric) and for organ weight data that were determined to be heterogeneous. Homogeneous data were analyzed using ANOVA as described above. Data heterogeneous after transformation were analyzed using a two-tailed Kruskal–Wallis test followed by a two-tailed Wilcoxon rank-sum test if the Kruskal–Wallis test was significant (Kruskal and Wallis, 1952, 1953; Sachs, 1984; Luginbuhl et al., 1987).
Reproductive development of male rats after postnatal exposure to ATR (ATR4)
Mated female Wistar rats (Fa. Harlan-Winkelmann GmbH, Borchen, Germany) were randomly assigned to five experimental groups. After delivery, F0 females (27–31/group) were administered ATR (97.2% purity) by gavage at doses of 0, 1, 5, 25, or 125 mg/kg/day (vehicle, Mondamin, 2% in water) from PND 2 through PND 21. The homogeneity and stability of ATR in oral formulations were verified by HPLC analysis, and concentrations were within acceptable range (96–100% of nominal). The parental animals, the female offspring, and, where possible, one male pup per litter, were euthanized after weaning and necropied. After weaning, male F1 offspring were reared and randomly assigned for PND 70 and PND 170 evaluations as described for ATR3 to provide 25 males per group for evaluation on each day. Throughout the study, animals had ad libitum access to a commercial powdered diet for laboratory animals (Ssniff Spezialdiatem GmbH). Sperm analyses and testosterone assays were conducted in the laboratory of Dr. I. Chahoud, as described previously. Statistical analyses were conducted as described above for ATR3.
RESULTS
Multigeneration Reproduction Studies of ATR in Rats
Three-generation study (ATR1)
ATR had no effect on body weight (Fig.2) or clinical signs of the F0, F1, or F2 males or females when administered in the feed at concentrations of 50 or 100 ppm. There were no effects on the percentage of males or females that mated or produced viable litters (Table 1). Litters from treated groups for all three offspring generations (F0, F1, and F2) were comparable to the controls in the numbers of litters per group, numbers of live births, physical condition, mean weights at birth and at weaning, percentage of young alive at weaning (Table 2), and gross autopsy observations (data not shown). Histopathologic examinations of tissues from weanlings in each F3 litter did not reveal any treatment-related target organ toxicity and no gross malformations were observed in any ATR-treated animal (data not shown).
Figure 2.

Group mean body weights of male and female rats in the three-generation dietary study, ATR1.
Table 1.
Fertility Indices in ATR1
| ART1 fertility indices | |||||||||
|---|---|---|---|---|---|---|---|---|---|
| F0 generation | F1 generation | F2 generation | |||||||
| Control | 50 ppm | 100 ppm | Control | 50 ppm | 100 ppm | Control | 50 ppm | 100 ppm | |
| First mating | |||||||||
| No. of females cohabitated | 20 | 20 | 20 | 20 | 20 | 20 | 20 | 19 | 20 |
| No. of pregnant females | 19 | 18 | 18 | 18 | 18 | 14 | 15 | 17 | 18 |
| Female fertility index (%)a | 95 | 90 | 90 | 90 | 90 | 70 | 75 | 89 | 90 |
| No. of males cohabitated | 10 | 10 | 10 | 10 | 10 | 10 | 10 | 10 | 10 |
| No. of males siring at least one litter | 10 | 10 | 10 | 10 | 10 | 8 | 9 | 10 | 10 |
| No. of males siring only one litter | 1 | 2 | 2 | 2 | 2 | 2 | 3 | 2c | 2 |
| Male fertility index (%)b | 100 | 100 | 100 | 100 | 100 | 80 | 90 | 100 | 100 |
| Second mating | |||||||||
| No. of females cohabitated | 20 | 20 | 20 | 20 | 20 | 20 | 20 | 19 | 20 |
| No. of pregnant females | 18 | 15 | 16 | 16 | 17 | 16 | 16 | 17 | 20 |
| Female fertility index (%)a | 90 | 75 | 80 | 80 | 85 | 80 | 80 | 89 | 100 |
| No. of males cohabitated | 10 | 10 | 10 | 10 | 10 | 10 | 10 | 10 | 10 |
| No. of males siring at least one litter | 10 | 9 | 9 | 9 | 10 | 9 | 9 | 10 | 10 |
| No. of males siring only one litter | 2 | 3 | 2 | 2 | 3 | 2 | 3 | 2c | 0 |
| Male fertility index (%)b | 100 | 90 | 90 | 90 | 100 | 90 | 100 | 100 | 100 |
Female fertility index = (no. of females cohabitated/no. of females pregnant) × 100.
Male fertility index = (no. of males cohabitated/no. of males siring at least one litter) × 100.
Excludes one male that was only cohabitated with a single female.
Table 2.
Reproductive and Pup Endpoints from the Three-Generation Reproduction Study on ATR (ATR1)
| ATR1 reproduction parameters | |||||||||
|---|---|---|---|---|---|---|---|---|---|
| F0 generation | F1 generation | F2 generation | |||||||
| Control | 50 ppm | 100 ppm | Control | 50 ppm | 100 ppm | Control | 50 ppm | 100 ppm | |
| First mating | |||||||||
| No. of pregnant females | 19 | 18 | 18 | 18 | 18 | 14 | 15 | 17 | 18 |
| No. with live litters PND0 (%) | 19 (100) | 18 (100) | 18 (100) | 18 (100) | 18 (100) | 14 (100) | 15 (100) | 17 (100) | 18 (100) |
| Mean number of live pups, PND0a | 10.0 ± 3.2 | 10.1 ± 2.2 | 11.1 ± 1.4 | 9.9 ± 2.3 | 9.7 ± 2.7 | 11.3 ± 2.1 | 8.8 ± 1.8 | 10.2 ± 1.5 | 9.3 ± 1.6 |
| Live birth index (%)b | 99.0 | 97.4 | 96.7 | 97.5 | 99.0 | 96.2 | 97.8 | 99.5 | 98.1 |
| No. with live litters PND21 (%) | 15 (78.9) | 16 (88.9) | 14 (77.8) | 18 (100) | 17 (100) | 14 (100) | 15 (100) | 17 (100) | 18 (100) |
| PND21 survival index (mean%)c | 74.1 | 78.2 | 64.1 | 79.9 | 71.9 | 73.5 | 92.4 | 81.4 | 88.3 |
| Mean live litter size, PND21a,d | 9.6 ± 2.6 | 8.9 ± 2.2 | 9.1 ± 1.8 | 7.8 ± 2.7 | 7.4 ± 3.4 | 8.1 ± 2.6 | 8.1 ± 2.1 | 8.2 ± 1.6 | 8.3 ± 2.4 |
| Mean PND0 pup weighta | 5.7 ± 0.5 | 5.5 ± 0.5 | 5.4 ± 0.5 | 6.6 ± 0.6 | 6.6 ± 0.9 | 6.6 ± 1.1 | 6.1 ± 0.6 | 5.8 ± 0.6 | 5.9 ± 0.4 |
| Mean PND21 pup weighta,d | 34.0 ± 7.8 | 35.6 ± 7.6 | 34.6 ± 5.1 | 36.4 ± 6.3 | 42.1 ± 9.4 | 37.3 ±7.2 | 38.9 ± 7.0 | 36.5 ± 5.4 | 38.5 ± 6.5 |
| Second mating | |||||||||
| No. of pregnant females | 18 | 15 | 16 | 16 | 17 | 16 | 16 | 17 | 20 |
| No. with live litters PND0 (%) | 18 (100) | 15 (100) | 15 (93.8) | 16 (100) | 16 (94) | 16 (100) | 16 (100) | 17 (100) | 20 (100) |
| Mean number of live pups, PND0a | 8.2 ± 2.0 | 8.8 ± 2.4 | 7.8 ± 3.2 | 9.6 ± 3.4 | 10.1 ± 3.2 | 9.6 ± 3.8 | 8.9 ± 1.5 | 10.1 ± 2.2 | 10.4 ± 3.0 |
| Live birth index (%)b | 97.5 | 93.6 | 88.3 | 97.3 | 93.5 | 92.4 | 99.4 | 100 | 97.0 |
| No. with live litters PND21 (%) | 17 (94.4) | 14 (93.3) | 13 (86.7) | 15 (93.8) | 15 (88.2) | 15 (93.8) | 16 (100) | 16 (94.1) | 18 (90) |
| PND21 survival index (mean%)c | 86.4 | 83.3 | 83.9 | 74.7 | 71.2 | 67.0 | 94.8 | 77.4 | 68.9 |
| Mean live litter size, PND21a,d | 7.5 ± 2.1 | 8.1 ± 0.9 | 7.5 ± 2.0 | 7.8 ± 2.1 | 8.1 ± 2.3 | 7.1 ± 3.4 | 8.4 ± 1.5 | 8.2 ± 3.2 | 8.3 ± 3.0 |
| Mean PND0 pup weighta | 6.7 ± 0.8 | 6.8 ± 1.0 | 6.8 ± 3.2 | 5.8 ± 0.7 | 5.6 ± 0.8 | 6.0 ± 3.7 | 6.4 ± 0.5 | 6.3 ± 0.6 | 6.5 ± 0.7 |
| Mean PND21 pup weighta,d | 33.5 ± 8.3 | 34.5 ± 6.4 | 37.8 ± 7.9 | 45.2 ± 8.7 | 43.0 ± 8.0 | 46.6 ± 7.8 | 33.6 ± 7.0 | 31.1 ± 8.0 | 30.6 ± 8.6 |
Expressed as mean ± standard deviation.
Mean percentage of pups per litter alive on PND0.
Mean percentage of live pups surviving to PND21 per litter.
Excluding litters with no live pups on PND21.
Two-generation study (ATR2)
There were no treatment-related mortalities or clinical observations after dietary exposure to 10, 50, or 500 ppm ATR for two consecutive generations. In the 500 ppm group, there were significant reductions in body weight gain for males and females of the F0 and F1 generations throughout the treatment period (Fig.3). Food consumption was reduced for males and females at 500 ppm, but this effect was less prominent for F0 and F1 females during gestation (Fig.4). ATR did not affect any reproductive endpoints in either generation. Mating, fertility, and gestation indices were comparable across treated and control groups in both generations (Table 1968). There was a reduction in the number of F1 females that became pregnant and delivered viable offspring in the 10 ppm group. This difference was not considered treatment-related because there were no effects on fertility in the 50 or 500 ppm groups or in the 10 ppm F0 females. Reproductive endpoints, including number of viable litters, and mean numbers of viable and stillborn pups, were similar across groups (Table 1968). There was no effect of treatment on the sex ratio.
Figure 3.
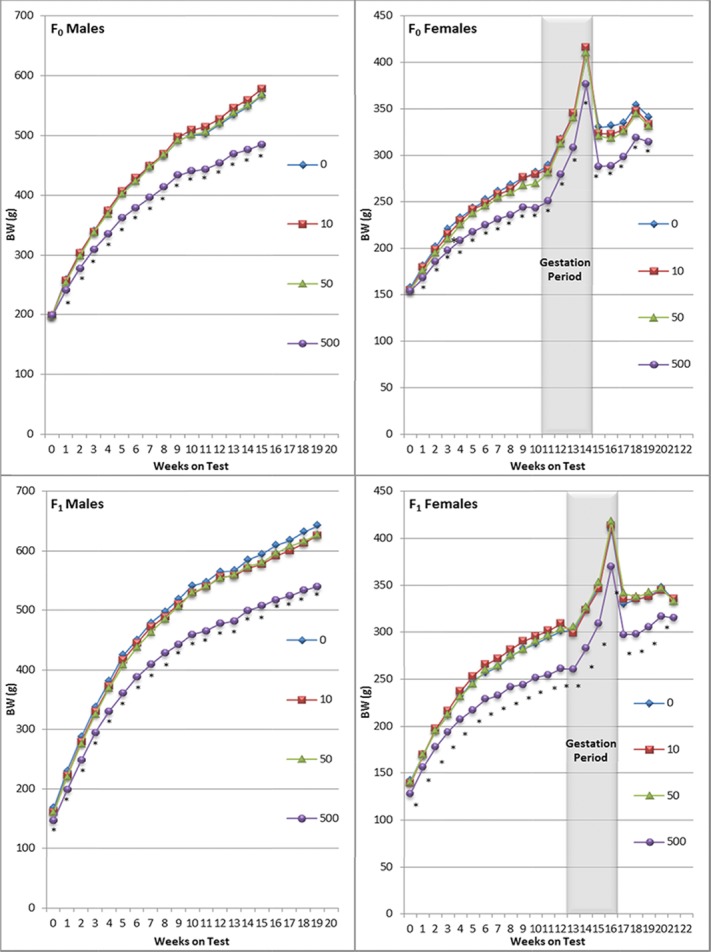
Group mean body weights of male and female rats in the two-generation dietary study, ATR2. An asterisk (*) below a symbol indicates a mean value significantly different from the control mean (p < 0.05) as determined by one-way ANOVA followed by Dunnett's t-test.
Figure 4.

Group mean food consumption of male and female rats in the two-generation dietary study, ATR2. Each point is the group mean of each animal's average daily consumption during 7-day periods. An asterisk (*) below a symbol indicates a mean value significantly different from the control mean (p < 0.05) as determined by one-way ANOVA followed by Dunnett's t-test.
Table 3.
Reproductive Indices and Offspring Endpoints from the Two-Generation Reproduction Study on ATR (ATR2)
| ATR feeding level (ppm [mg/kg/day]) | ||||||||
|---|---|---|---|---|---|---|---|---|
| 0 | 10 (0.73) | 50 (3.64) | 500 (38.7) | 0 | 10 (0.73) | 50 (3.64) | 500 (38.7) | |
| Parental generation | F0 generation | F1 generation | ||||||
| Number of mated females | 30 | 30 | 30 | 30 | 30 | 30 | 30 | 30 |
| Number of pregnant females | 29 | 28 | 26 | 26 | 24 | 18 | 28 | 26 |
| Fertility index (%)a | 96.7 | 93.3 | 86.7 | 86.7 | 85.7 | 69.2 | 93.3 | 89.7 |
| Mating index (%)b | 100 | 100 | 100 | 100 | 93.3 | 86.7 | 100 | 96.7 |
| Gestation index (%)c | 96.6 | 100 | 100 | 96.2 | 95.8 | 100 | 100 | 96.2 |
| Number of viable litters | 28 | 28 | 26 | 25 | 23 | 18 | 28 | 25 |
| Mean number of viable newborn ± SD, day 0 | 13.2±3.6d | 15.0±2.1 | 15.0±2.1 | 13.7±4.6 | 11.0±5.0 | 13.3±2.8 | 13.4±3.3 | 12.4±4.1 |
| Mean number of of still birth ± SD, day 0 | 0.26±0.53d | 0.25±0.44 | 0.23±0.51 | 0.35±0.69 | 0.50±0.83 | 0.17±0.51 | 0.07±0.26 | 0.31±0.74 |
| Offspring generation | F1 generation | F2 generation | ||||||
| Number of viable males, day 0 | 166 | 218 | 206 | 171 | 131 | 114 | 182 | 150 |
| Number of viable females, day 0 | 190 | 203 | 183 | 184 | 133 | 126 | 194 | 171 |
| Sex ratio (% males) day 0 | 46.6 | 51.8 | 53.0 | 48.2 | 49.6 | 47.5 | 48.4 | 46.7 |
| Percentage of pups alive on PND4 | 96.6 | 96.9 | 97.7 | 95.7 | 89.6 | 98.7 | 97.1 | 99.5 |
| Percentage of pups alive from PND 4 to PND 21 | 97.6 | 91.1 | 96.2 | 98.0 | 96.6 | 98.6 | 99.6 | 98.4 |
| Mean pup weight (g), PND 0, males ± SD | 6.4±0.1 | 6.0±0.1 | 6.2±0.1 | 6.3±0.1 | 6.4±0.1 | 6.0±0.1* | 6.2±0.1 | 6.2±0.1 |
| Females ± SD | 6.0±0.1 | 5.7±0.1 | 5.7±0.1 | 6.0±0.1 | 6.0±0.1 | 5.8±0.1 | 5.8±0.1 | 5.9±0.1 |
| Mean pup weight (g), PND 4, males ± SD | 9.1±0.2 | 8.1±0.2* | 8.6±0.2 | 8.7±0.2 | 9.3±0.3 | 8.8±0.3 | 9.0±0.2 | 9.0±0.2 |
| Females ± SD | 8.6±0.2 | 7.7±0.2* | 7.9±0.2* | 8.4±0.2 | 8.9±0.2 | 8.4±0.2 | 8.5±0.2 | 8.6±0.2 |
| Mean pup weight (g), PND 7, males ± SD | 14.4±0.4 | 13.0±0.4 | 13.5±0.4 | 13.4±0.4 | 14.0±0.5 | 13.4±0.5 | 13.7±0.4 | 13.3±0.4 |
| Females ± SD | 13.4±0.4 | 12.2±0.4 | 12.4±0.4 | 12.7±0.4 | 13.4±0.4 | 12.7±0.4 | 12.8±0.3 | 12.9±0.4 |
| Mean pup weight (g), PND 21, males ± SD | 49.9±1.1 | 45.1±1.1 | 47.2±1.1 | 46.2±1.2 | 47.8±1.3 | 44.6±1.4 | 43.8±1.1 | 43.0±1.2 |
| Females ± SD | 46.8±1.0 | 43.4±1.0 | 44.0±1.0 | 44.4±1.0 | 44.2±1.4 | 42.5±1.4 | 41.3±1.2 | 42.3±1.3 |
Fertility index = (number of pregnant females/number of females cohabited with males) × 100.
Mating index = (number of sperm-positive females/number of females cohabited with males) × 100.
Gestation index = (number of females with live-born/number of sperm-positive females) × 100.
Two pregnant females were excluded from the evaluation because the day of insemination (day 0) could not be ascertained.
Statistically different from controls at p ≤ 0.05, covariate analysis (litter size as covariate).
Pup survival was unaffected by ATR treatment at any dose for either generation. A covariate analysis of pup weight, taking into account litter size at birth, did not reveal treatment-related effects. Isolated significant reductions in pup body weight were not considered treatment-related because they did not follow a dose-related pattern (no effects at 500 ppm), and changes were confined to single days during lactation (Table 1968).
At necropsy, there were no treatment-related macroscopic changes in males or females from the F0 or F1 parental generations or from F2 pups. Microscopic evaluations of the pituitary gland and reproductive organs (testes, epididymides, seminal vesicles, prostate, coagulating gland, ovaries, uterus, cervix, and vagina) from the control and high-dose groups in the F0 and F1 parental generations did not show treatment-related effects. Testis and ovarian organ weights were also not affected by ATR treatment at any feeding level (Table 1958).
Table 4.
Gonadal Weights of Parental Animals from the Two-Generation Reproduction Study of ATR (ATR2)
| 0 | 10 (0.73) | 50 (3.64) | 500 (38.7) | 0 | 10 (0.73) | 50 (3.64) | 500 (38.7) | |
|---|---|---|---|---|---|---|---|---|
| F0 generation | F1 generation | |||||||
| Males | ||||||||
| Number of males | 30 | 30 | 30 | 30 | 30 | 30 | 30 | 30 |
| Mean terminal body weight (g ± SD) | 546 ± 52 | 564 ± 53 | 551 ± 49 | 474 ± 55* | 623 ± 56 | 607 ± 70 | 608 ± 64 | 526 ± 51* |
| Mean testes weight (g ± SD) | 4.96 ± 0.35 | 4.84 ± 0.64 | 4.86 ± 0.39 | 4.87 ± 0.56 | 5.29 ± 0.40 | 5.14 ± 0.58 | 5.37 ± 0.58 | 5.17 ± 0.57 |
| Females | ||||||||
| Number of females | 30 | 30 | 30 | 30 | 30 | 30 | 30 | 30 |
| Mean terminal body weight (g ± SD) | 302 ± 24 | 303 ± 24 | 296 ± 25 | 275 ± 20* | 309 ± 38 | 315 ± 44 | 300 ± 31 | 278 ± 24* |
| Mean ovaries weight (g ± SD) | 0.129 ± 0.034 | 0.140 ± 0.038 | 0.122 ± 0.034 | 0.133 ± 0.028 | 0.128 ± 0.043 | 0.111 ± 0.028 | 0.121 ± 0.024 | 0.122 ± 0.024 |
Statistically different from controls at p ≤ 0.05, ANOVA and Dunnett's t-test.
Special Reproduction Studies
Male reproductive development in rats after prenatal exposure to ATR (ATR3)
There were no effects on clinical signs or mortality in pregnant female rats administered ATR on GD6-GD21 by oral gavage at doses of 1, 5, 25, or 125 mg/kg/day. In pregnant dams, signs of maternal toxicity occurred at 25 mg/kg/day and above. Statistically significantly reduced food consumption (Fig.5B) was accompanied by a loss of body weight and/or reduced body weight gain (Fig.5A) during gestation in females in the 125 mg/kg/day dose group; slight reductions in food consumption and body weight gain also occurred in the 25 mg/kg/day dose group. At the end of treatment, a compensatory increase in body weight gain occurred in the 125 mg ATR/kg/day dose group such that group mean body weight was not significantly different from the control group during lactation. Food consumption appeared to be lower in the 125 mg/kg/day group than in controls on lactation day 14 to 21, but this difference was not statistically significant. The maternal no observable adverse effect level (NOAEL) for the study was 5 mg/kg/day.
Figure 5.

Group mean maternal body weight and food consumption during treatment on GDs 6 to 21 (A and B) or PNDs 2 to 21 (E and F). Group mean male and female pup body weights on PNDs 1 to 21, following treatment during on GDs 6 to 21 (C and D) or on PNDs 2 to 21 (G and H). An asterisk (*) below a symbol indicates a mean value significantly different from the control mean (p < 0.05) as determined by one-way ANOVA followed by Dunnett's t-test.
Evidence of reproductive toxicity was observed in maternal rats administered 125 mg ATR/kg/day throughout gestation (Table 2010). Of the 21 females that were pregnant in the high-dose group, only 13 delivered live litters, while 8 had total in utero litter loss. Additionally, embryo-fetal mortality occurred in live-born litters as evidenced by an increase in postimplantation loss and a significant reduction in mean number of pups per litter at birth in the 125 mg/kg/day group compared with controls. Postnatal pup survival was also significantly affected in the 125 mg/kg/day group. All pups died by PND 4 in seven live-born litters and all pups died by PND 21 in an additional two litters, leaving only four litters surviving to weaning in the 125 mg/kg/day group. Neither pre- nor postnatal survival was affected in the other ATR-treated groups.
Table 5.
Pregnancy Outcome in Wistar Rats Treated with ATR during Days 6 to 21 of Gestation (ATR3)
| Dose | Control | 1 mg/kg | 5 mg/kg | 25 mg/kg | 125 mg/kg |
|---|---|---|---|---|---|
| Females | |||||
| Mated | 25 | 25 | 25 | 25 | 25 |
| Pregnant | 20 | 21 | 22 | 25 | 21 |
| No pups delivereda | – | – | – | 1 | 8 |
| Delivering dead pups | – | 1 | 1 | – | – |
| Delivering live pups | 20 | 21 | 21 | 24 | 13 |
| Gestation length | 22.0 ± 0.0 | 22.0 ± 0.4 | 22.2 ± 0.4 | 22.0 ± 0.3 | 22.2 ± 0.4 |
| Implantation sites | 217 | 249 | 258 | 262 | 147 |
| Pups delivered | 201 | 221 | 231 | 243 | 80 |
| Litter size | 10.1 ± 2.9 | 10.5 ± 2.8 | 11.0 ± 2.3 | 10.1 ± 3.3 | 6.2 ± 4.5* |
| Postimplantation loss (%)b | 8.0 | 12.0 | 8.4 | 8.6 | 44.4 |
| Pups alive PND 1 | 200 | 218 | 227 | 240 | 61 |
| Pups alive PND 4 | 200 | 217 | 218 | 239 | 35 |
| Pups alive PND 21 | 184 | 212 | 206 | 225 | 27 |
| Viability index (PNDs 0–4) | 98 | 98 | 92 | 98 | 34 |
| Weaning index (PNDs 4–21) | 94 | 98 | 95 | 95 | 57 |
Total intrauterine loss.
Postimplantation loss = (no. of implantations − no. of live pups PND 0)/no. of implantations × 100.
p < 0.05.
Body weight was significantly reduced on PND 1 for male and female pups in the 125 mg/kg/day dose group through PND 7 for males (Fig.5C) and PND 14 for females (Fig.5D). Thereafter, pup weights in the high-dose group were not significantly different from controls. There was no effect on pup weight at dose levels ≤25 mg/kg/day. There were no treatment-related effects on survival or body weight (Fig.6A) in the subset of male pups selected for developmental studies postweaning.
Figure 6.

Group mean male pup body weight during PND 21 to PND 168 following treatment during on GDs 6 to 21 (A) or on PNDs 2 to 21 (B). An asterisk (*) below a symbol indicates a mean value significantly different from the control mean (p < 0.05) as determined by one-way ANOVA followed by Dunnett's t-test.
Due to the excessive pre- and postnatal mortality in the 125 mg/kg/day group, there were too few males to evaluate male reproductive endpoints on PND 170; consequently, males in this group were only evaluated on PND 70. Reproductive organ and pituitary weights for males necropsied on PND 70 or PND 170 are presented in Table 6. Although in utero ATR exposure led to significantly reduced relative pituitary weights on PND 70 in the 125 mg/kg/day group, other organs were unaffected.
Table 6.
Male Reproductive Endpoints in Adult Male Offspring after In Utero Exposure to ATR during Days 6 to 21 of Gestation (ATR3)
| Dose (mg/kg/day) | |||||
|---|---|---|---|---|---|
| 0 | 1 | 5 | 25 | 125 | |
| PND 70 | |||||
| N | 25 | 25 | 25 | 25 | 12 |
| Terminal body weighta | 283 ± 33 | 275 ± 33 | 270 ± 18 | 272 ± 33 | 275 ± 24 |
| Organ weights,b | |||||
| Testis weight (total) | 3.16 ± 0.32 | 3.06 ± 0.39 | 3.12 ± 0.27 | 3.09 ± 0.24 | 3.15 ± 0.24 |
| Epididymis weight (total) | 0.78 ± 0.10 | 0.74 ± 0.12 | 0.74 ± 0.09 | 0.75 ± 0.10 | 0.75 ± 0.08 |
| Relative prostate weight | 0.23 ± 0.07 | 0.22 ± 0.06 | 0.22 ± 0.06 | 0.21 ± 0.04 | 0.20 ± 0.05 |
| Relative seminal vesicle weight | 0.32 ± 0.07 | 0.31 ± 0.06 | 0.31 ± 0.06 | 0.29 ± 0.07 | 0.26 ± 0.07 |
| Relative pituitary weight (mg/g) | 0.027 ± 0.009 | 0.026 ± 0.009 | 0.025 ± 0.10 | 0.024 ± 0.009 | 0.016 ± 0.007* |
| Plasma testosterone (ng/ml) | 3.0 ± 1.8 | 5.1 ± 3.7* | 4.1 ± 2.5 | 3.8 ± 3.2 | 3.2 ± 3.1 |
| Spermatid number (×106) | 166 ± 35 | 165 ± 48 | 176 ± 38 | 160 ± 43 | 154 ± 42 |
| Sperm number (×106) | 107 ± 46 | 112 ± 47 | 106 ± 43 | 110 ± 44 | 85 ± 28 |
| Abnormal sperm (%) | 8.8 ± 4.4c | 9.5 ± 5.7 | 10.1 ± 4.1 | 11.3 ± 3.8 | 15.8 ± 8.2*d |
| PND 170 | |||||
| N | 25 | 25 | 25 | 25 | 0e |
| Terminal body weighta | 425 ± 40 | 440 ± 24 | 441 ± 31 | 428 ± 31 | NA |
| Organ weights,b | NA | ||||
| Testis weight (total) | 3.57 ± 0.45 | 3.52 ± 0.24 | 3.60 ± 0.36 | 3.64 ± 0.23 | NA |
| Epididymis weight (total) | 1.20 ± 0.12 | 1.19 ± 0.10 | 1.18 ± 0.12 | 1.19 ± 0.10 | NA |
| Relative prostate weight | 0.28 ± 0.05 | 0.30 ± 0.05 | 0.26 ± 0.04 | 0.27 ± 0.06 | NA |
| Relative seminal vesicle weight | 0.35 ± 0.04 | 0.38 ± 0.04 | 0.36 ± 0.05 | 0.34 ± 0.07 | NA |
| Relative pituitary weight (mg/g) | 0.025 ± 0.004 | 0.025 ± 0.004 | 0.025 ± 0.003 | 0.024 ± 0.004 | NA |
| Plasma testosterone (ng/ml) | 1.8 ± 0.8c | 2.1 ± 1.4 | 2.4 ± 2.1 | 2.0 ± 1.6 | NA |
| Spermatid number (×106) | 235 ± 63 | 230 ± 39 | 236 ± 52 | 241 ± 42 | NA |
| Sperm number (×106) | 214 ± 66 | 214 ± 34 | 214 ± 55 | 221 ± 40 | NA |
| Abnormal sperm (%) | 5.7± 1.7 | 5.5 ± 2.1 | 6.3 ± 2.3 | 7.5 ± 3.0* | NA |
Mean body weight and absolute organ weights are expressed in grams ± standard deviation.
Relative organ weight = [organ wt. (g)/body wt. (g)] × 100 for testis, epididymis, prostate, seminal vesicle.
Relative organ weight for pituitary = milligram pituitary/gram body weight.
N = 24.
N = 13.
Due to the excessive pre- and postnatal mortality in the 125 mg/kg/day group, there were too few males for evaluation on PND 170.
Statistically significant from control at p ≤ 0.05, ANOVA and Dunnett's t-test.
Prenatal ATR treatment did not alter spermatid counts in testes, spermatozoa counts in the epididymides, or plasma testosterone concentrations on PND 70 or PND 170 at any dose (Table 6). A statistically significant increase in the percentage of abnormal sperm was observed on PND 70 in the 125 mg/kg/day dose group compared to controls and on PND 170 in the 25 mg/kg/day dose group; the 125 mg/kg/day dose group could not be assessed on PND170 due to increased postnatal mortality in this group. Therefore, the no-observed-effect level (NOEL) for male developmental toxicity was 5 mg/kg/day.
Reproductive performance of male rats after postnatal exposure to ATR (ATR4)
No ATR-related mortality or clinical observations occurred in females administered ATR during lactation by oral gavage at dose levels of 1, 5, 25, or 125 mg/kg/day. Postpartum exposure of F0 females to ATR at 125 mg/kg/day resulted in significantly reduced food consumption throughout lactation (Fig.5F), which corresponded with slight reductions in body weight gain in the high-dose group (Fig.5E). Thus, the maternal NOAEL was 25 mg/kg/day. Administration of ATR to dams during lactation had no effects on pup viability or weaning indices (Table 7). Pup body weights were significantly reduced in the 125 mg/kg/day dose group on PND 4 through PND 21 (Fig.5G and H). After weaning of the 125 mg/kg/day group, body weights of F1 males (offspring of dams exposed during lactation) remained reduced through PND 63 (Fig.6B), but food consumption and clinical observations for F1 males were comparable to control offspring (data not shown).
Table 7.
Litter Endpoints for Female Wistar Rats Treated with ATR during Days 2 to 21 of Lactation (ATR4)
| Dose | Control | 1 mg/kg | 5 mg/kg | 25 mg/kg | 125 mg/kg |
|---|---|---|---|---|---|
| Females | |||||
| Pregnant | 31 | 30 | 29 | 33 | 32 |
| Delivering live pups (%) | 30 (97) | 28 (93) | 28 (97) | 32 (97) | 31 (97) |
| Pups delivered | 337 | 301 | 320 | 366 | 333 |
| Meana pups delivered PND0 | 11.2 ± 2.8 | 10.4 ± 3.8 | 11.4 ± 2.9 | 11.4 ± 2.4 | 10.7 ± 2.7 |
| Pups alive PND 0 | 333 | 296 | 319 | 366 | 331 |
| Pups alive PND 21 | 275 | 271 | 275 | 303 | 262 |
| Viability indexb (%) | 96 | 96 | 91 | 93 | 92 |
| Weaning indexc (%) | 84 | 93 | 91 | 89 | 88 |
| Mean live pups per live litters PND1 | 11.3 ± 2.2 | 10.6 ± 3.6 | 11.5 ± 2.7 | 11.4 ± 2.4 | 10.7 ± 2.8 |
| Number of live litters | 29 | 28 | 27 | 32 | 31 |
| Mean live pups per live litters PND21 | 11.0 ± 2.3 | 10.4 ± 3.2 | 11.0 ± 2.4 | 11.2 ± 2.6 | 10.1 ± 2.6 |
| Number of live litters | 25 | 26 | 25 | 27 | 26 |
All means presented as means ± standard deviations.
Viability index = mean [(number pups alive PND4 / number born alive) × 100].
Weaning index = mean [(number pups alive PND21 / number alive PND21) × 100].
*p < 0.05;
**p < 0.01 as determined by covariate analysis (litter size as covariate), covariate adjusted means not shown.
On PND 70, slight but statistically significant reductions in absolute testis (∼6–7%) and epididymis (∼10%) weights were observed for F1 males in the 125 mg/kg/day group (Table 1996). By PND 170, there were no significant differences in epididymis weights but testis weights remained reduced in the 125 mg/kg/day group compared to controls. No changes in prostate, seminal vesicle, or pituitary weights were seen at any dose.
Table 8.
Male Reproductive Endpoints in Offspring after Exposure to ATR during Lactation (ATR4)
| Dose (mg/kg/day) | |||||
|---|---|---|---|---|---|
| 0 | 1 | 5 | 25 | 125 | |
| PND 70 | |||||
| N | 25 | 25 | 25 | 25 | 25 |
| Terminal body weighta | 275 ± 28 | 292 ± 19*c | 272 ± 38 | 279 ± 35 | 268 ± 28 |
| Organ weightsab | |||||
| Testis weight (total) | 3.03 ± 0.22 | 3.05 ± 0.33 | 3.02 ± 0.24 | 3.02 ± 0.28 | 2.82 ± 0.22* |
| Epididymis weight (total) | 0.67 ± 0.07 | 0.67 ± 0.09 | 0.66 ± 0.08 | 0.65 ± 0.08 | 0.60 ± 0.07* |
| Relative prostate weight | 0.21 ± 0.03 | 0.21 ± 0.041958 | 0.21 ± 0.04 | 0.21 ± 0.03 | 0.21 ± 0.03 |
| Relative seminal vesicle weight | 0.28 ± 0.06 | 0.28 ± 0.051958 | 0.28 ± 0.07 | 0.28 ± 0.06 | 0.30 ± 0.04 |
| Relative pituitary weight (mg/g) | 0.033 ± 0.005 | 0.033 ± 0.006d | 0.032 ± 0.005 | 0.035 ± 0.007 | 0.034 ± 0.005 |
| Plasma testosterone (ng/ml) | 2.6 ± 2.7 | 3.6 ± 3.0 | 2.6 ± 2.5 | 4.6 ± 5.5 | 3.1 ± 2.8 |
| Spermatid umber (×106) | 164 ± 29 | 142 ± 45 | 161 ± 25 | 158 ± 27 | 143 ± 32 |
| Sperm number (×106) | 104 ± 31 | 100 ± 43 | 115 ± 33 | 98 ± 24 | 86 ± 33 |
| Abnormal sperm (%) | 6.3 ± 2.5 | 10.2± 18.9e | 7.3 ± 2.7 | 7.1 ± 2.4 | 9.2 ± 2.5 |
| PND 170 | |||||
| N | 25 | 25 | 25 | 25 | 25 |
| Terminal body weighta | 450 ± 29 | 466 ± 34 | 457 ± 31 | 454 ± 30 | 438 ± 32 |
| Organ Weightsa,b | |||||
| Testis weight (total) | 3.62 ± 0.19 | 3.57 ± 0.57 | 3.57 ± 0.28 | 3.50 ± 0.32 | 3.40 ± 0.25* |
| Epididymis weight (total) | 1.18 ± 0.12 | 1.19 ± 0.17 | 1.21 ± 0.09 | 1.19 ± 0.10 | 1.16 ± 0.08 |
| Relative prostate weight | 0.27 ± 0.03 | 0.27 ± 0.03 | 0.28 ± 0.04 | 0.26 ± 0.04 | 0.25 ± 0.04 |
| Relative seminal vesicle weight | 0.34 ± 0.04 | 0.34 ± 0.05 | 0.34 ± 0.06 | 0.34 ± 0.05 | 0.35 ± 0.04 |
| Relative pituitary weight (mg/g) | 0.026 ± 0.005 | 0.026 ± 0.005 | 0.026 ± 0.004 | 0.026 ± 0.004 | 0.026 ± 0.003 |
| Plasma testosterone (ng/ml) | 2.1 ± 1.2 | 2.1 ± 1.7 | 1.6 ± 1.0 | 1.6 ± 0.7 | 2.2 ± 1.7 |
| Spermatid number (×106) | 238 ± 41 | 241 ± 63 | 229 ± 54 | 221 ± 45 | 216 ± 35 |
| Sperm number (×106) | 203 ± 54 | 213 ± 62 | 218 ± 64 | 211 ± 43 | 211 ± 44 |
| Abnormal sperm (%) | 6.0 ± 3.3 | 6.9 ± 3.1 | 6.6 ± 2.4 | 7.4 ± 2.4 | 8.6 ± 3.1* |
Mean body weight and absolute organ weights are expressed in grams ± standard deviation.
Relative organ weight = [organ wt. (g)/body wt. (g)] × 100 or testis, epididymis, prostate, seminal vesicle.
Relative organ weight for pituitary = milligram pituitary/gram body weight.
N = 22, three terminal body weights inadvertently not determined.
N = 21, one pituitary damaged during processing; three terminal body weights inadvertently not determined.
Includes one animal with 100% abnormal sperm.
Significantly different from the control at p ≤ 0.05, ANOVA and Dunnett's t-test.
Lactational exposure to ATR had no effects on plasma testosterone concentrations or spermatid or sperm counts in F1 males on PND 70 or PND 170. An increase in the percentage of abnormal sperm was noted in the 125 mg/kg/day group on PND 170 (Table 1996). Therefore, the NOEL for male developmental toxicity following lactational exposure to ATR was 25 mg/kg/day.
DISCUSSION
This article presents data from two multigeneration reproduction studies and two special studies investigating the development and function of the male reproductive tract in rats. To our knowledge, these are the first multigenerational mammalian reproductive toxicity studies presented in the literature using dietary administration of ATR.
The three-generation study (ATR1), which was conducted before contemporary designs for reproductive toxicity studies were standardized by USEPA (1996), showed that dietary concentrations of ATR up to 100 ppm had no effect on fetal development, lactation, maturation to adulthood, mating, pregnancy, or reproduction. ATR2, which employed a high dose of 500 ppm, resulted in parental toxicity indicated by significantly reduced body weight gain accompanied by reduced food consumption in both sexes over two generations, thereby meeting regulatory standards for high-dose selection (OECD, 2001). It is likely that reduced body weight gain observed in the high-dose group of ATR2 was the result of diminished food intake throughout the treatment period, which has been frequently observed in other studies of rats exposed to higher dietary concentrations of ATR (Stevens et al., 1999). Despite reductions in food intake and body weight gain, there were no effects of ATR on reproduction, including mating and fertility, number of live litters, number of live or stillborn pups, or the growth and development of pups. Thus, in two multigeneration studies in rats, exposure to ATR in the diet did not adversely affect reproduction or development at concentrations up to a parentally toxic dose of 500 ppm (average daily dose in F0 generation females during gestation ∼ 39 mg/kg/day).
It is known that high doses of ATR administered by oral gavage inhibit the estrogen-induced (Cooper et al., 2000; Simpkins et al., 2011) or estrogen plus progesterone–induced (LH) surge in ovariectomized SD (Cooper et al., 2000; Simpkins et al., 2011), Long-Evans (LE; Cooper et al., 2000), and Wistar rats (Foradori et al., 2009a, b2009b) but not in Fischer-344 rats (Simpkins et al., 2011). The effect of ATR on the LH surge requires a minimum of 4 days of treatment to reach a maximum (Goldman et al., 2013) and is reversible within 4 days of the cessation of treatment (Foradori et al., 2009a). The results of these studies are consistent with a disruption in hypothalamic control of pituitary function by ATR, as has also been shown by other researchers (Cooper et al., 1996; Cooper et al., 2000; Foradori et al., 2009b; Foradori et al., 2013; reviewed in Cooper et al., 2007).
Despite clear ATR-induced reductions in LH, follicle stimulating hormone (FSH) (Foradori et al., 2009a), and prolactin release (Stoker et al., 1999) in rats following gavage doses, the effects of ATR on reproductive endpoints have only been demonstrated at very high doses, and the response is strain-specific. Cooper et al. (1996) demonstrated alterations of normal estrous cycling in SD and LE females at oral gavage ATR doses of 75 to 300 mg/kg. However, only repeated administration of 300 mg/kg/day completely blocked cycling and subsequent ovulation (Cooper et al., 2000), and this dose resulted in significant reductions in body weight gain during the 21-day treatment period. Likewise, treatment with 50 to 200 mg/kg/day ATR on days 1 through 8 of pregnancy increased pre- and postimplantation loss in only one of four rat strains tested, and only at dose levels that caused maternal body weight loss or marked reductions in body weight gain (Cummings et al., 2000). It is important that dose levels that had an effect on reproductive parameters in the study by Cummings et al. (2000) were well above the parentally toxic dose level of approximately 39 mg/kg/day in our dietary two-generation study, suggesting that doses required to elicit reproductive effects in rodents would not be tolerated with long-term administration.
Dose kinetics is another important factor in the ability of ATR to alter the LH surge and reproductive endpoints in rodents. In a study by Foradori et al. (2014), when ATR was administered in the diet as a distributed dose over 24 hr at doses of up to 50 mg/kg/day (1460 ppm), there was no effect on the LH surge in intact female LE rats, whereas doses of 12 mg/kg/day or greater, administered daily by gavage, suppressed the preovulatory LH surge. These bolus doses also increased the number of LE females with lengthened (5-day) or irregular estrous cycles (no estrus), and a bolus dose of 100 mg/kg significantly reduced the mean number of corpora lutea and collected ova from mated LE females, but only in those females with a blunted LH surge. Conversely, reproductive endpoints (LH surge, estrous cycle changes, numbers of corpora lutea, and numbers of collected ova) were not affected by ATR administered in the diet. SD females also showed reductions in the LH surge and the number of ova collected at bolus doses of 50 mg/kg/day and greater, but a significant reduction in the number of corpora lutea was observed only in the 100 mg/kg/day bolus-dosed group (Foradori et al., 2014). These results suggest that effects of ATR or its metabolites on the HPG axis likely occur when their plasma concentrations exceed a critical threshold concentration. These findings are consistent with the results of the multigeneration studies (ATR1 and ATR2) where there were no effects on reproduction and fertility after dietary administration, even at dose levels that, when given by gavage, suppressed the LH surge (Foradori et al., 2014; Cooper et al., 2007) and caused persistent and sustained decrements in parental body weight and food consumption through two generations. Thus, it is improbable that ATR would adversely affect reproduction or fertility in humans under conditions of a temporally distributed, low-dose exposure that might be encountered following occupational exposure or via diet (USEPA, 2006) or drinking water (USEPA, 2012).
Studies ATR3 and ATR4 were conducted to evaluate effects of prenatal or lactational ATR administration, respectively, on male reproductive development. ATR was administered by oral gavage to dams at dose levels of 0, 1, 5, 25, or 125 mg/kg/day on GDs 6 to 21 (ATR3) or PNDs 2 to 21 (ATR4). In both studies, male offspring were evaluated on PND 70 and PND 170 for sperm endpoints, male reproductive organ weights, and plasma testosterone. When 125 mg/kg/day ATR was administered as a bolus dose by gavage, there was evidence of maternal toxicity and reduced pup viability following gestational exposure, and effects on pup body weight after gestational or lactational exposure, but very few effects on male reproductive endpoints.
A significant number of dams in ATR3 experienced prenatal total litter loss at the high dose of 125 mg/kg/day but not at lower doses. ATR-induced prenatal total litter loss has been reported by others (Cummings et al., 2000; Narotsky et al., 2001) and may be related to the role of LH (Narotsky et al., 2001) or prolactin (Cummings et al., 2000) in the maintenance of pregnancy in rodents. Cummings et al. (2000) reported that daily gavage doses of 50 to 200 mg/kg/day ATR administered on days 1 through 8 of pregnancy during the diurnal and nocturnal prolactin surges increased pre- and postimplantation loss in sensitive rat strains. Narotsky et al. (2001) demonstrated prenatal total litter loss after oral gavage administration of ATR in early gestation (GDs 6–10) but not midgestation (GDs 11–15) in multiple species, which was attributed to reductions in LH. Since humans rely on chorionic gonadotropin (CG) to maintain pregnancy (Zelesznik and Pohl, 2006) rather than on LH or prolactin, the effect of ATR on maintenance of pregnancy in rodents may not be relevant to humans. Furthermore, full litter loss was observed only at high, maternally toxic doses (i.e., doses causing body weight loss) in rodents (ATR3; Narotsky et al., 2001).
It is possible that part of the reduced pup body weight gain observed in litters of dams exposed during lactation to ATR is due to decreased suckling-induced prolactin release as described by Stoker et al. (1999). These investigators reported that when lactating dams were gavaged twice daily with ATR at dose levels of 12.5, 25, and 50 mg/kg (total daily doses of 25, 50, and 100 mg/kg), suckling-induced maternal prolactin concentrations were reduced in 40, 60, and 100% of the dams respectively. The amount of milk observed in the pup stomach was noticeably less in the high-dose group (Stoker, 1999; personal communication).
In our studies, high-dose levels of ATR administered by gavage for 16 days during gestation or 20 days during lactation had very minimal effects on male reproductive endpoints on PND 70 or 170. Small increases in abnormal sperm were noted at doses of 25 mg/kg/day and above, and reductions in testicular weights were noted after lactational exposure at 125 mg/kg/day, but there were no changes in plasma testosterone concentration, testicular or epididymal sperm counts, or weights of other reproductive organs. Male fertility was also unaffected in the multigeneration studies, suggesting that the effect on sperm morphology either did not occur following dietary administration, or was not of sufficient magnitude to impair male reproductive function in the feeding studies.
The minimal effect on male reproductive endpoints in our studies is in contrast to a previous study in which gavage dosing of male rats during the peripubertal period caused reductions in plasma and intratesticular testosterone concentrations as well as reduced seminal vesicle and prostate weights (Trentacoste et al., 2001). However, a pair-feeding experiment within this study demonstrated that effects on male reproductive endpoints could be replicated by reducing food consumption in untreated rats to the level of food consumed by ATR-treated rats. These results suggest that changes in male reproductive endpoints may not be entirely related to ATR treatment, but may be secondary to reduced food consumption. Although the association between reduced food consumption and alterations in male reproductive parameters has also been demonstrated by others (Rehm et al., 2008), Laws et al. (2000) reported that the effect of ATR on delaying vaginal opening was not entirely due to its effect on body weight.
Fraites et al. (2011) conducted a study on male reproductive development after gestational ATR exposure that was very similar to the design of ATR3. Doses of 0, 1, 5, 20, and 100 mg/kg/day were administered to pregnant SD females on GD 14 through GD 21, and reproductive endpoints of male offspring were evaluated. The distribution of ATR and its metabolites in dams, fetuses, and neonates following gestational exposure were also quantitated. Postnatal survival was decreased at 100 mg/kg/day, which is similar to the effects seen in ATR3 at 125 mg/kg/day. Consistent with our findings, there were no effects on testosterone production, timing of puberty, anogenital distance, and play behavior at dose levels ≤20 mg/kg/day, despite detectable levels of ATR and its metabolites in maternal and fetal tissues at term (Fraites et al., 2011). A similar study conducted by Rosenberg et al. (2008) reported decreases in anogenital distance after late gestational exposure to ATR at 75 mg/kg/day, delays in preputial separation, and reductions in serum testosterone concentrations at 50 to 100 mg/kg/day but no changes in seminal vesicle or prostate weights and no changes in any male reproductive endpoints at 1 or 10 mg/kg/day. Reproductive effects in male offspring occurred primarily at doses that caused reductions in maternal food consumption and body weight gain.
Hayes et al. (2002) reported that when Xenopus laevis larvae were exposed to low parts-per-billion levels of ATR in water from hatching until tail resorption, feminizing/demasculinizing effects were observed. These effects, which have not be replicated by others (Kloas et al., 2009a,b2009b), are difficult to reconcile with the subtle effects on male reproductive parameters seen at high doses in rats. Furthermore, the suggestion (Hayes et al., 2011) that gonadal effects reported in amphibians are consistent across vertebrate classes is not supported by the studies reported here.
Prostatic inflammation was not assessed in the current studies. Stoker (1999) reported that males receiving an ATR dosage of 50 mg/kg twice daily and given ovine prolactin on PND 120 exhibited increased prostate weights and inflammation. However, the increased PND 120 prostate weight was not confirmed in ATR4, as no effect on prostate weight was observed on PND 70 or 170 in male offspring of dams administered ATR 125 mg/kg/day from PNDs 2 to 21 in ATR4.
The data presented here showed that there were no effects of ATR on rat reproduction when ATR was administered as a temporally distributed dose in the diet up to an NOEL dose of 38.7 mg/kg/day. Although there were some effects of a high bolus dose of ATR on the development of the male reproductive system, the NOELs following prenatal (5 mg/kg/day) and postnatal (25 mg/kg/day) exposure were much higher than would be expected in humans under normal use conditions. For example, the NOELs are approximately 50,000- to 400,000-fold greater than the dose that would be received by a 60-kg woman who drank 2 liters/day of water containing ATR at the maximum contaminant level (MCL) of 3 μg/l (USEPA, 2012), as calculated in Scialli et al. (2014).
Although reproductive endpoints were not used to set the MCL, the MCL is protective of the endpoints evaluated in this article. The oral reference dose for ATR is set at 0.0018 mg/kg/day (USEPA, 2006) or at 0.018 mg/kg/day (JMPR, 2009) based on effects on LH in a chronic rat study. These oral reference dose exposure levels for ATR are also protective against any potential developmental or reproductive effects when compared with the NOELs from the reproduction studies presented here.
CONFLICT OF INTEREST
The studies summarized in this article were conducted by Syngenta Crop Protection, LLC., a manufacturer and registrant of atrazine. Dr. Breckenridge is an employee of Syngenta Crop Protection, LLC.; Drs. Scialli, White, and DeSesso are consultants to Syngenta Crop Protection, LLC.
REFERENCES
- Ashby J, Tinwell H, Stevens J, Pastoor T, Breckenridge CB. The effects of atrazine on the sexual maturation of female rats. Regul Toxicol Pharmacol. 2002;35:468–473. doi: 10.1006/rtph.2002.1571. [DOI] [PubMed] [Google Scholar]
- Bhapkar VP. On the analysis of contingency tables with quantitative response. Biometrics. 1968;24:329–338. [PubMed] [Google Scholar]
- Blom G. Statistical estimates and transformed beta variables. New York: John Wiley & Sons; 1958. [Google Scholar]
- Breckenridge BC, Simpkins J, Eldridge JC, Stevens JT. Symmetrical triazine herbicides: a review of regulatory endpoints. In: Kreiger R, editor. Handbook of pesticide toxicology: agents. 3rd ed. New York: Classes of Pesticides, Academic Press; 2010. pp. 1711–1723. Chapter 79. [Google Scholar]
- Cooper RL, Stoker TE, Goldman JM, Parrish MB, Tyrey L. Effect of atrazine on ovarian function in the rat. Reprod Toxicol. 1996;10:257–264. doi: 10.1016/0890-6238(96)00054-8. [DOI] [PubMed] [Google Scholar]
- Cooper RL, Laws SC, Das PC, Narotsky MG, Goldman JM, Lee Tyrey E, Stoker TE. Atrazine and reproductive function: mode and mechanism of action studies. Birth Defects Res B Dev Reprod Toxicol. 2007;80:98–112. doi: 10.1002/bdrb.20110. [DOI] [PubMed] [Google Scholar]
- Cooper RL, Stoker TE, Tyrey L, Goldman JM, McElroy WK. Atrazine disrupts the hypothalamic control of pituitary-ovarian function. Toxicol Sci. 2000;53:297–307. doi: 10.1093/toxsci/53.2.297. [DOI] [PubMed] [Google Scholar]
- Cummings AM, Rhodes BE, Cooper RL. Effect of atrazine on implantation and early pregnancy in 4 strains of rats. Toxicol Sci. 2000;58:135–143. doi: 10.1093/toxsci/58.1.135. [DOI] [PubMed] [Google Scholar]
- Davis LK, Murr AS, Best DS, Fraites MJP, Zorrilla LM, Narotsky MG, Stoker TE, Goldman JM, Cooper RL. The effects of prenatal exposure to atrazine on pubertal and postnatal reproductive indices in the female rat. Repro Toxicol. 2011;32:43–51. doi: 10.1016/j.reprotox.2011.04.004. [DOI] [PubMed] [Google Scholar]
- Dunnett CW. A multiple comparisons procedure for comparing several treatments with control. J Am Stat Assoc. 1955;50:1096–1121. [Google Scholar]
- Dunnett CW. New tables for multiple comparison with a control. Biometrics. 1964;20:482–491. [Google Scholar]
- Foradori CD, Hinds LR, Hanneman WH, Handa RJ. Effects of atrazine and its withdrawal on gonadotropin-releasing hormone neuroendocrine function in the adult female Wistar rat. Biol Reprod. 2009a;81:1099–1105. doi: 10.1095/biolreprod.109.077453. [DOI] [PubMed] [Google Scholar]
- Foradori CD, Hinds LR, Hanneman WH, Legare ME, Clay CM, Handa RJ. Atrazine inhibits pulsatile luteinizing hormone release without altering pituitary sensitivity to a gonadotropin-releasing hormone receptor agonist in female Wistar rats. Biol Reprod. 2009b;81:40–45. doi: 10.1095/biolreprod.108.075713. [DOI] [PubMed] [Google Scholar]
- Foradori CD, Zimmerman AD, Hinds LD, Zuloaga KL, Breckenridge CB, Handa RJ. Atrazine inhibits pulsatile gonadotropin-releasing hormone (GNRH) release without altering GNRH messenger RNA or protein levels in the female rat. Biol Reprod. 2013;88:1–7. doi: 10.1095/biolreprod.112.102277. [DOI] [PubMed] [Google Scholar]
- Foradori CD, Sawhney-Coder P, Tisdel M, Yi KD, Simpkins JW, Handa RJ, Breckenridge CB. The effect of atrazine administered by gavage or in diet on the LH surge and reproductive performance in intact female Sprague-Dawley and Long Evans rats. Birth Defects Res B Dev Reprod Toxicol. 2014 doi: 10.1002/bdrb.21109. [DOI] [PMC free article] [PubMed] [Google Scholar]
- Fraites MJP, Narotsky MG, Best DS, Stoker TE, Davis LK, Goldman JM, Hotchkiss MG, Klinfelter GR, Kamel A, Qian Y, Podhorniak L, Cooper RL. Gestational atrazine exposure: effects on male reproductive development and metabolite distribution in the dam, fetus, and neonate. Reprod Toxicol. 2011;32:52–63. doi: 10.1016/j.reprotox.2011.04.003. [DOI] [PubMed] [Google Scholar]
- Friedmann AS. Atrazine inhibition of testosterone production in rat males following peripubertal exposure. Reprod Toxicol. 2002;16:275–279. doi: 10.1016/s0890-6238(02)00019-9. [DOI] [PubMed] [Google Scholar]
- Goldman J, Davis LK, Murr AS, Cooper RL. Atrazine-induced elevation or attenuation of the LH surge in the ovariectomized, estrogen-primed female rat: role of adrenal progesterone. Reproduction. 2013;146:305–314. doi: 10.1530/REP-13-0011. [DOI] [PubMed] [Google Scholar]
- Good NE. Inhibitors of the Hill reaction. Plant Physiol. 1961;36:788–803. doi: 10.1104/pp.36.6.788. [DOI] [PMC free article] [PubMed] [Google Scholar]
- Goodman M, Mandel JS, DeSesso JM, Scialli AR. Atrazine and pregnancy outcomes: a systematic review of epidemiologic evidence. Birth Defects Res B Dev Reprod Toxicol. 2014 doi: 10.1002/bdrb.21101. [DOI] [PMC free article] [PubMed] [Google Scholar]
- Hayes TB, Collins A, Lee M, Mendoza M, Noriega N, Stuart AA, Vonk A. Hermaphroditic, demasculinized frogs after exposure to the herbicide atrazine at low ecologically relevant doses. Proc Natl Acad Sci USA. 2002;99(8):5476–5480. doi: 10.1073/pnas.082121499. [DOI] [PMC free article] [PubMed] [Google Scholar]
- Hayes TB, Beasley VR, de Solla S, Iguchi T, Ingraham H, Kestemont P, Kniewald J, Kniewald Z, Langlois VS, Luque EH, McCoy KA, Munoz-de-Toro M, Oka T, Oliveira CA, Orton F, Ruby S, Suzawa M, Tavera-Mendoza LE, Trudeau VL, Victor-Costa AB, Willingham E. Demasculinization and feminization of male gonads by atrazine: consistent effects across vertebrate classes. J Steroid Biochem Mol Biol. 2011;127:64–73. doi: 10.1016/j.jsbmb.2011.03.015. [DOI] [PMC free article] [PubMed] [Google Scholar]
- Heindel JJ, Chapin RE, Gulati DK, George JD, Price CJ, Marr MC, Myers CB, Barnes LH, Fail PA, Grizzle TB. Assessment of the reproductive and developmental toxicity of pesticide/fertilizer mixtures based on confirmed pesticide contamination in California and Iowa groundwater. Fundam Appl Toxicol. 1994;22:605–621. doi: 10.1006/faat.1994.1067. [DOI] [PubMed] [Google Scholar]
- Joint FAO/WHO Meeting on Pesticide Residues in Food (JMPR, 2007) Part II: toxicological evaluation of atrazine. Geneva, Switzerland: WHO Press; 2009. pp. 37–138. [Google Scholar]
- Kloas W, Lutz I, Springer T, Krueger H, Wolf J, Holden L, Hosmer A. Does atrazine influence larval development and sexual differentiation in Xenopus laevis. Toxicol Sci. 2009a;107:376–384. doi: 10.1093/toxsci/kfn232. [DOI] [PMC free article] [PubMed] [Google Scholar]
- Kloas W, Lutz I, Urbatzka R, Springer T, Krueger H, Wolf J, Holden L, Hosmer A. Does atrazine affect larval development and sexual differentiation of South African clawed frogs. Ann NY Acad Sci. 2009b;1163:437–440. doi: 10.1111/j.1749-6632.2009.04456.x. [DOI] [PubMed] [Google Scholar]
- Kruskal WH, Wallis WA. Use of ranks in one-criterion variance analysis. J Am Stat Assoc. 1952;47:583–621. [Google Scholar]
- Kruskal WH, Wallis WA. Use of ranks in one-criterion variance analysis. J Am Stat Assoc. 1953;48:907–911. [Google Scholar]
- Laws SC, Ferrell JM, Stoker TE, Schmid J, Cooper RL. The effects of atrazine on female Wistar rats: an evaluation of the protocol for assessing pubertal development and thyroid function. Toxicol Sci. 2000;58:366–376. doi: 10.1093/toxsci/58.2.366. [DOI] [PubMed] [Google Scholar]
- Luginbuhl RC, Schlotzhauer SD, Parker CJ. SAS/STAT procedures guide for personal computers. Cary, NC: SAS Institute; 1987. Version 6. [Google Scholar]
- Mantel N. Chi-square tests with one degree of freedom: extension of Mantel-Haenszel procedure. J Am Stat Assoc. 1963;58:690–700. [Google Scholar]
- Narotsky MG, Best DS, Guidici DL, Cooper RL. Strain comparisons of atrazine-induced pregnancy loss in the rat. Reprod Toxicol. 2001;15:61–69. doi: 10.1016/s0890-6238(00)00111-8. [DOI] [PubMed] [Google Scholar]
- Organization for Economic Cooperation and Development (OECD) OECD 416: two-generation reproduction toxicity study. Paris: OECD; 2001. [Google Scholar]
- Peters JW, Cook RM. Effects of atrazine on reproduction in rats. Bull Environ Contam Toxicol. 1973;9:301–304. doi: 10.1007/BF01684788. [DOI] [PubMed] [Google Scholar]
- Rayner JL, Wood C, Fenton SE. Exposure parameters necessary for delayed puberty and mammary gland development in Long-Evans rats exposed in utero to atrazine. Toxicol Appl Pharmacol. 2004;195:23–34. doi: 10.1016/j.taap.2003.11.005. [DOI] [PubMed] [Google Scholar]
- Rayner JL, Enoch RR, Wolf DC, Fenton SE. Atrazine-induced reproductive tract alterations after transplacental and/or lactational exposure in male Long-Evans rats. Toxicol Appl Pharmacol. 2007;218:238–248. doi: 10.1016/j.taap.2006.11.020. [DOI] [PubMed] [Google Scholar]
- Rehm S, White TE, Zahalka EA, Stanislaus DJ, Boyce RW, Wier PJ. Effects of food restriction on testis and accessory sex glands in maturing rats. Toxicol Pathol. 2008;36:687–694. doi: 10.1177/0192623308320275. [DOI] [PubMed] [Google Scholar]
- Rosenberg BG, Chen H, Folmer J, Liu J, Papadopoulos V, Zirkin BR. Gestational exposure to atrazine: effects on the postnatal development of male offspring. J Androl. 2008;29:304–311. doi: 10.2164/jandrol.107.003020. [DOI] [PubMed] [Google Scholar]
- Sachs L. Angewandte statistik. 6. Berlin, Heidelberg, New York, Tokyo: Springer Verlag; 1984. [Google Scholar]
- Scialli AR, DeSesso JM, Breckenridge CB. Developmental studies with atrazine and its major metabolites in rats and rabbits. Birth Defects Res B Dev Reprod Toxicol. 2014 doi: 10.1002/bdrb.21099. [DOI] [PMC free article] [PubMed] [Google Scholar]
- Simpkins JW, Swenberg JS, Weiss N, Brusick D, Eldridge JC, Stevens JT, Handa RJ, Hovey RC, Plant TM, Pastoor TP, Breckenridge CB. Atrazine and breast cancer: a framework assessment of the toxicological and epidemiological evidence. Toxicol Sci. 2011;123:441–459. doi: 10.1093/toxsci/kfr176. [DOI] [PMC free article] [PubMed] [Google Scholar]
- Snedecor GW, Cochran WG. Statistical Methods. Ames, IA: Iowa State University Press; 1968. pp. 258–296. [Google Scholar]
- Stevens JT, Breckenridge CB, Wetzel LT, Thakur AK, Liu C, Werner C, Luempert LC, Eldridge JC. A risk characterization for atrazine: oncogenicity profile. J Toxicol Environ Health A. 1999;56:69–109. doi: 10.1080/009841099158169. [DOI] [PubMed] [Google Scholar]
- Stoker TE, Robinette CL, Cooper RL. Maternal exposure to atrazine during lactation suppresses suckling-induced prolactin release and results in prostatitis in the adult offspring. Toxicol Sci. 1999;52:68–79. doi: 10.1093/toxsci/52.1.68. [DOI] [PubMed] [Google Scholar]
- Stoker TE, Laws SC, Guidici DL, Cooper RL. The effect of atrazine on puberty in male Wistar rats: an evaluation in the protocol for the assessment of pubertal development and thyroid function. Toxicol Sci. 2000;58:50–59. doi: 10.1093/toxsci/58.1.50. [DOI] [PubMed] [Google Scholar]
- Tischer W, Strotmann H. Relationship between inhibitor binding by chloroplasts and inhibition of photosynthetic electron transport. Biochim Biophys Acta. 1977;460:113–125. doi: 10.1016/0005-2728(77)90157-8. [DOI] [PubMed] [Google Scholar]
- Trentacoste SV, Friedmann AS, Youker RT, Breckenridge CB, Zirkin BR. Atrazine effects on testosterone levels and androgen-dependent reproductive organs in peripubertal male rats. J Androl. 2001;22:142–148. [PubMed] [Google Scholar]
- USEPA. Health effects test guidelines OPPTS 870.3800, reproduction and fertility toxicity effects. Washington, DC: EPA; 1996. 712-C-96–207. [Google Scholar]
- USEPA. Triazine cumulative risk assessment. 2006. HED human health risk assessment in support of the reregistration eligibility decisions for atrazine, simazine and propazine. PC Codes: 080808, 080803, 080807. DP 317976. Health Effects Division (7509C), Benefits and Economic Analysis Division (7503C), and Environmental Fate and Effects Division (7507C). March 28, 2006. Office of Prevention, Pesticides and Toxic Substances. United States Environmental Protection Agency. Washington, DC.
- USEPA. 2010. pp. 51–62. Transmittal of meeting minutes of the FIFRA Scientific Advisory Panel Meeting on the draft framework and case studies on atrazine, human incidents, and the Agricultural Health Study: incorporation of epidemiology and human incident data into human health risk assessment. April 22, 2010.. Available at: http://www.epa.gov/scipoly/sap/meetings/2010/020210minutes.pdf.
- USEPA. Basic information about atrazine in drinking water. 2012. Available at: http://water.epa.gov/drink/contaminants/basicinformation/atrazine.cfm#four. Accessed August 7, 2013.
- Zelesznik AJ, Pohl CR. Knobil and Neill's physiology of reproduction. 3rd ed. New York: Raven Press; 2006. Control of follicular development, corpus luteum function, the maternal recognition of pregnancy, and the neuroendocrine regulation of the menstrual cyce in higher primates; pp. 2449–2510. Chapter 45.In: E. Knobil and JD Neill, editors. [Google Scholar]