Abstract
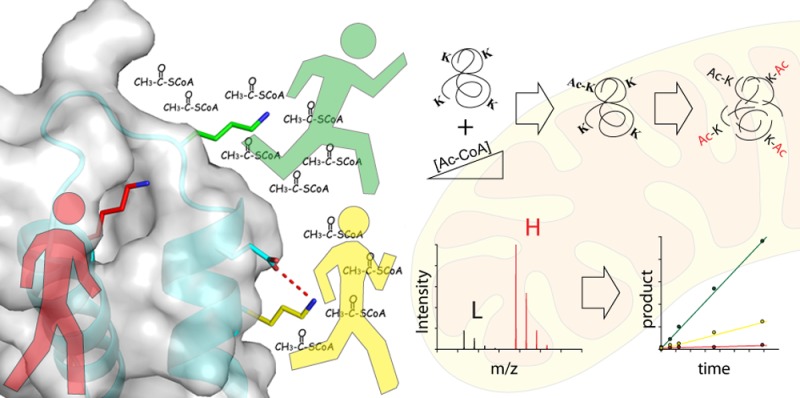
Protein acetylation of lysine ε-amino groups is abundant in cells, particularly within mitochondria. The contribution of enzyme-catalyzed and nonenzymatic acetylation in mitochondria remains unresolved. Here, we utilize a newly developed approach to measure site-specific, nonenzymatic acetylation rates for 90 sites in eight native purified proteins. Lysine reactivity (as second-order rate constants) with acetyl-phosphate and acetyl-CoA ranged over 3 orders of magnitude, and higher chemical reactivity tracked with likelihood of dynamic modification in vivo, providing evidence that enzyme-catalyzed acylation might not be necessary to explain the prevalence of acetylation in mitochondria. Structural analysis revealed that many highly reactive sites exist within clusters of basic residues, whereas lysines that show low reactivity are engaged in strong attractive electrostatic interactions with acidic residues. Lysine clusters are predicted to be high-affinity substrates of mitochondrial deacetylase SIRT3 both in vitro and in vivo. Our analysis describing rate determination of lysine acetylation is directly applicable to investigate targeted and proteome-wide acetylation, whether or not the reaction is enzyme catalyzed.
Protein acetylation is a post-translational modification affecting diverse cellular processes.1−3 Although regulation of transcription by reversible acetylation of histone proteins is well-known, mass spectrometry based proteomic studies have catalogued thousands of acetylation sites in the mitochondria.4−8 Unlike nuclear acetylation, which is catalyzed by several families of lysine acetyltransferases (KATs), direct evidence of acetyltransferases in mitochondria is lacking. However, mitochondria do harbor the bona fide deacetylase, SIRT3, a member of the NAD+-dependent deacylases.9,10 SIRT3 has been shown to deacetylate and stimulate the activity of a number of metabolic enzymes, leading to enhanced oxidative metabolism, urea cycle, and ROS detoxification.11,12
Lack of evidence for mitochondrial KATs raises the possibility that lysine acetylation is largely an uncatalyzed reaction, whereby the unprotonated lysine side-chain reacts with the thioester of acetyl-CoA.13 Nonenzymatic acetylation has been observed on histone proteins.14−16 Due to higher pH and increased acetyl-CoA levels in mitochondria, nonenzymatic acetylation appears to be a viable possibility.13,15,17−19 Consistent with this idea, mitochondrial acetyl-CoA metabolism altered by dietary regimens or genetic manipulations affect lysine acetylation.4,5,10,13,20,21 Additionally, in vitro incubation of acetyl-CoA with nonhistone proteins leads to a time dependent increase in acetylation.17 Acetyl-phosphate, a prokaryotic metabolic intermediate, can modify lysine residues in vivo and in vitro, further illustrating the general plausibility of nonenzymatic acetylation.18,19 We have previously demonstrated that KAT families, GCN5 and MYST, utilize general base catalysis to remove a proton from the ε-amino group, permitting nucleophilic attack on the bound acetyl-CoA.15,22 In this regard, the pKa of the ε-amino group has little effect on the enzyme-catalyzed reaction, while the uncatalyzed reaction is directly dependent on the amount of unprotonated lysine.15 Regardless of whether enzymatic or nonenzymatic acetylation is the primary mode, knowledge of lysine reactivity toward these acetylating agents would provide crucial insight in the general mechanism of protein acetylation.
To establish an understanding of lysine reactivity for acetylation, the chemical kinetics at the site-specific level and among a broad range of proteins must be quantified. To date, there is only one report that quantifies the nonenzymatic second order rate for acetylation, which was reported for lys-36 of histone H3.16 Here, we utilize a newly developed mass spectrometry method to investigate the chemical reactivities (second order rate constants) of 90 lysine sites within eight purified proteins from mitochondrial and nonmitochondrial sources. The analysis revealed acetylation reactivities ranging over 3 orders of magnitude. Structural and bioinformatic analyses explore the molecular basis for high and low reactivity sites on two mitochondrial proteins known to be regulated by acetylation.
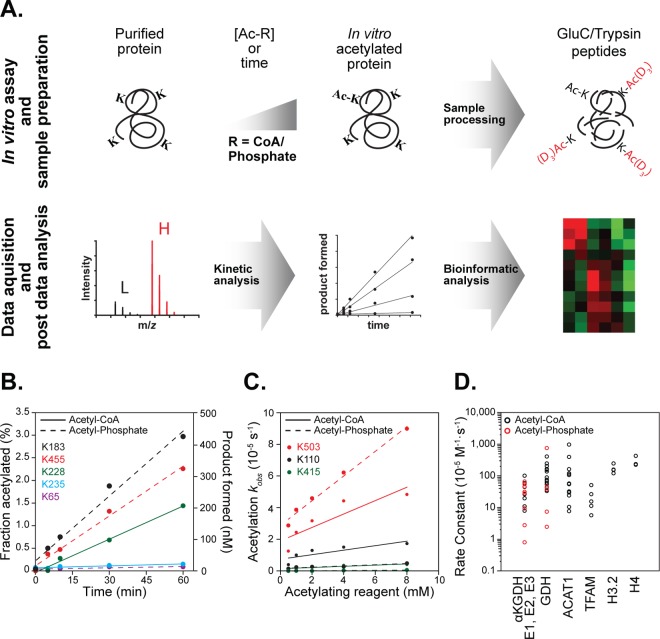
To quantify chemical acetylation kinetics, we modified a method previously developed for determining acetylation stoichiometry (Figure 1A).23 In short, site-specific stoichiometry is determined by reacting native proteins with acetylating reagent acetyl-CoA (AcCoA) or acetyl-phosphate (AcP), followed by denaturation and reaction with heavy-labeled acetic anhydride to chemically acetylate all remaining unmodified lysines. Proteolyzed samples were subjected to high-resolution mass spectrometry and acetylation stoichiometry was quantified. Here, purified protein was incubated with acetylating reagent AcCoA or AcP for various times or at varied reagent concentrations, followed by fast buffer exchange to remove any activated acetylating reagent. Sample processing for quantifying stoichiometry involved denaturation, reduction, alkylation, and isotopic chemical acetylation of the protein sample. Enzymatic digestion using GluC and trypsin generated chemically identical heavy and light peptide pairs, which were resolved by nano-LC-MS/MS, with subsequent quantification of acetylation stoichiometry in a site-specific manner.
Figure 1.
Kinetic analysis of nonenzymatic lysine acetylation. (A) Diagram of methodology used to determine nonenzymatic acetylation. Purified mitochondrial and nonmitochondrial proteins were incubated with varied concentrations of acetyl-CoA or acetyl-phosphate. At specific time points, protein is processed for mass spectrometry analysis followed by kinetic and bioinformatic analysis. (B) Time-dependent acetylation of bovine serum albumin. Incubation of BSA with 4.5 mM acetyl-CoA and 8.5 mM acetyl-phosphate over the course of 60 min shows linear increase in site-specific lysine acetylation. (C) Concentration-dependent acetylation of glutamate dehydrogenase (GDH). Purified GDH was incubated with acetyl-CoA and acetyl-phosphate for 60 min and analyzed to determine rate constants. The rate constants for the GDH sites listed in B are K503–412 × 10–5 M–1 s–1 (AcCoA), and 758 × 10–5 M–1 s–1 (AcP), K110–138 × 10–5 M–1 s–1 (AcCoA), 37.5 × 10⁻⁵ M–1 s–1 (AcP), K415–36.4 × 10⁻⁵ M–1 s–1 (AcCoA) and 7.4 × 10⁻⁵ M–1 s–1 (AcP). (D) Dot plot of rate constants quantified for α-ketoglutarate dehydrogenase complex (E1, E2, E3), glutamate dehydrogenase (GDH), acetyl-coa acetyltransferase 1 (ACAT1), mitochondrial transcription factor A (TFAM), histone H3.2 (H3), and histone H4 (H4).
To establish progress curves of nonenzymatic acetylation, we first evaluated the time-dependent acetylation of bovine serum albumin (BSA) with AcCoA and AcP. With both acetylating reagents, the site-specific acetylation was linear over 60 min (Figure 1B) and displayed vastly different rates for five unique lysine sites, highlighting the robustness of the method over a broad range of chemical reactivities. Once conditions for linearity were established, we determined the second order rate constants of site-specific lysine acetylation for the mitochondrial α-ketoglutarate dehydrogenase complex (αKGDH E1, E2, E3) and glutamate dehydrogenase using both AcCoA and AcP as the acetylating reagent, while acetyl-CoA acetyltransferase 1 (ACAT1), mitochondrial transcription factor A (TFAM), histone H3.2, and histone H4 were treated using AcCoA alone. Rate constants were determined by varying [AcCoA] or [AcP], plotting the pseudo-first-order rate constant (kobs) of site-specific acetylation as a function of concentration, and performing linear regression analysis. The slope of the line designates the second order rate constant. Figure 1C shows an example of the rate data for three sites in GDH that were quantified for both AcCoA and AcP reactions.
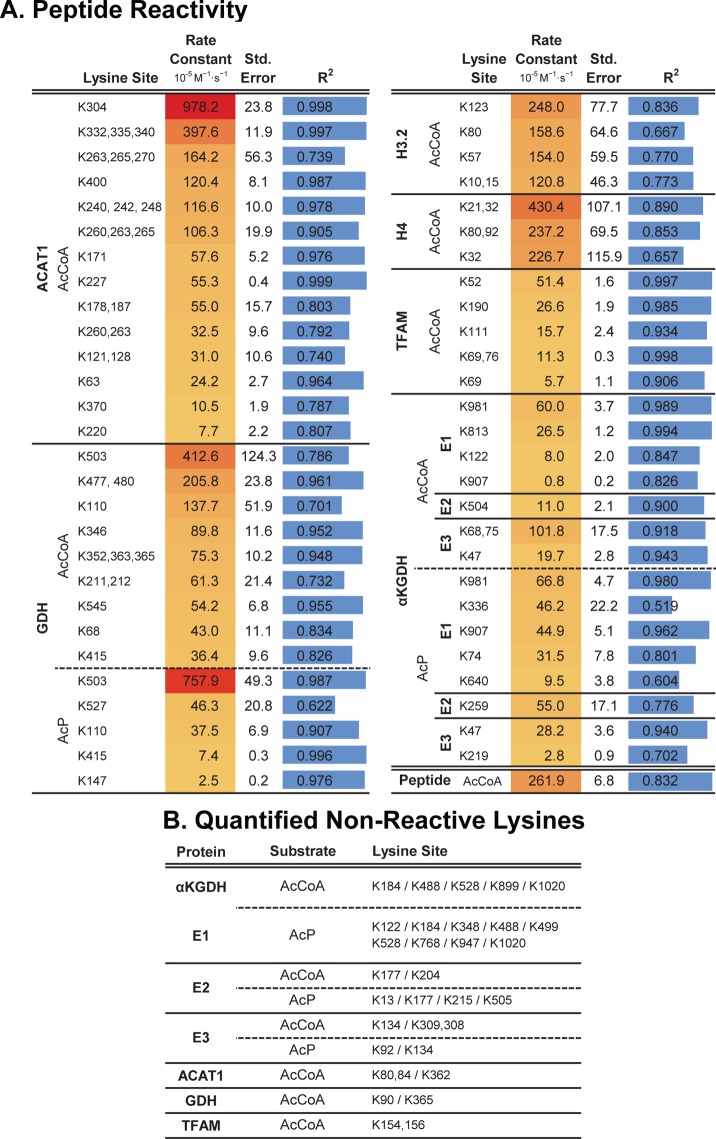
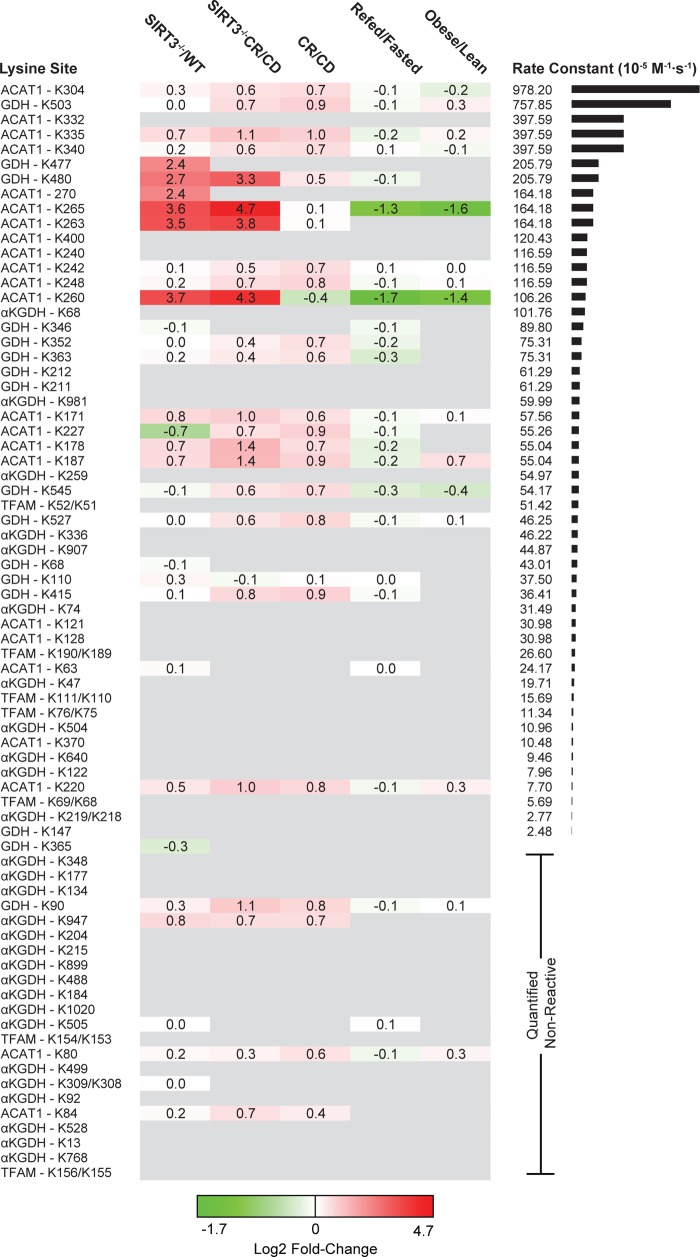
This kinetic analysis evaluated 90 lysine sites across these eight proteins, including 27 lysine sites that were detected, but no significant reactivity was calculable (Figure 2). Among the 63 sites with quantifiable reactivity, rate constants ranged over 3 orders of magnitude, with lys-503 (K503) on GDH yielding the second highest reactivity with a second order rate constant of 758 × 10–5 M–1 s–1 (Figure 1C). The least reactive lysine on GDH (K415) displayed a second order rate constant of 7.41 × 10⁻⁵ M–1 s–1, representing a 100-fold difference among sites on the same protein. In addition to highlighting the number of sites quantified per protein, the dot plot depicted in Figure 1D illustrates several important points. AcCoA and AcP show reactivities that are generally similar, and for each mitochondrial protein, the range of lysine reactivities within a given protein was 1–2 orders of magnitude (Figure 1D). To query the biological relevance of differential lysine acetylation rates, we undertook a meta-analysis of previously published acetylation fold-change data sets generated by immunoenrichment of digested acetyl-peptides. Data from four previous proteome scale studies of mouse mitochondria and embryonic fibroblast cells were gathered, cleaned, and merged into one data table containing over 26 500 data points from 3836 proteins encompassing five unique physiological perturbations.4,5,7,8 The data sets reflect a large swath of biological conditions known to interact with mitochondrial acetylation. Assembled data were then merged with the rate constants determined here and ranked according to decreasing values of reactivities (Figure 3).
Figure 2.
Site-specific lysine acetylation rate constants. (A) Second order rates for measured peptides. (B) Quantified nonreactive peptides are listed for each substrate condition.
Figure 3.
Lysine site reactivity mapped to acetylation fold-change proteomics. Heatmap of observed sites ranked from high to low reactivity across five experimental conditions. CD: control diet. CR: calorie restriction. Acetylation fold-change values were compiled from previous studies of mouse liver mitochondria and MEF cells. Mouse protein sites that differ in sequence number from observed proteins are identified by both sites: K[site]obs/K[site]Musmusculus. Quantified nonreactive sites are randomly ordered. Sites with high reactivities are more likely to be found in the acetylation data sets.
The number of conditions for which we were able to find fold-change data appears to decrease with decreasing rate constants. The immunoenrichment methodology used in these prior in vivo studies does not detect fold-change information for unmodified lysine sites or for acetylated peptides not enriched because of antibody specificity. Missing fold-change data likely reflect low or no in vivo acetylation of these low reactive sites. Here, our method of quantifying site reactivity does not rely on antibodies and therefore permits determination of both poorly and highly reactive lysine residues. In the group of 44 lysine residues with either no detectable reactivity or rates <30 × 10–5 M–1 s–1, only nine (or 12%) of these were detected in at least one of the biological data sets. In contrast, 40 sites have second order rate constants >30 × 10–5 M–1 s–1 with 24 (or 29%) of those sites overlapping with the biological data sets, and importantly 19/24 (or 79%) of those were observed in four different conditions (Figure 3). For comparison, we determined the second order rate constant of an unstructured histone H3 peptide with acetyl-CoA, yielding a value of 261 × 10–5 M–1 s–1 (Figure 2). Lysine sites with the highest reactivity (second order rate constant) were found on ACAT1 and GDH, and many of these sites appear to dynamically change in biological conditions that compare SIRT3–/– to WT and caloric restriction (CR) to a control diet (CD; Figure 3). Together, these results suggest that many highly reactive sites are more likely to exhibit larger fold-changes between conditions and more likely to be targets of SIRT3.
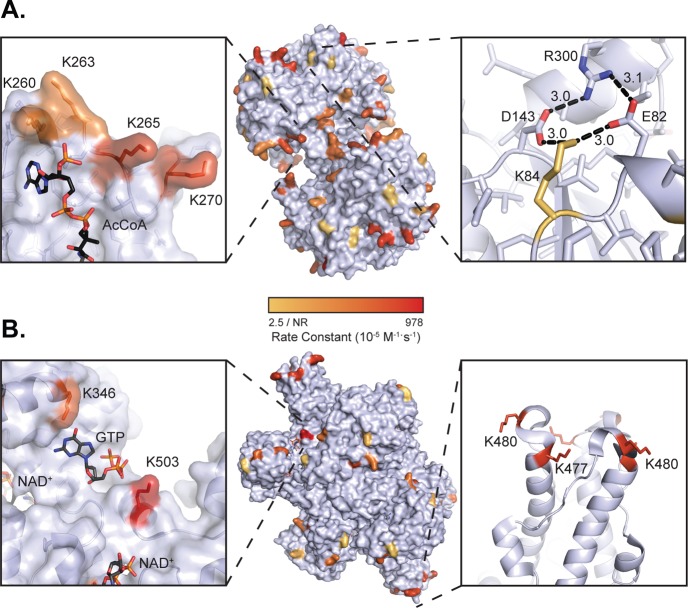
The extensive cataloguing of lysine reactivity allowed us to map these sites onto the protein structures of GDH and ACAT1, displaying a reactivity range that spans over 2 orders of magnitude. By visual inspection, lysine sites with the highest reactivity (red) tend to protrude away from the surface of the protein, while low reactivity sites (yellow) tend to form electrostatic interactions with neighboring residues (Figures 2 and 4). In ACAT1, this point is illustrated by structurally comparing K84, which yielded no significant reactivity, with K260, K263, K265, and K270, which displayed rate constants ranging from 106 × 10–5 to 164 × 10–5 M–1 s–1. K84 is part of a network of electrostatic interactions involving aspartate, glutamate, and arginine residues (Figure 4A). As a group, K260, K263, K265, and K270 form a cluster and do not make significant interactions with the protein surface (Figure 4A). Quite remarkably, the acetylation state of K260, K263, K265, and K270 increased ≥10-fold in the SIRT3–/– mice compare with WT (Figure 3).4 Equally interesting is the observation that K260 and K265 acetylation decreases when comparing refed/fasted as well as obese/lean (Figure 3).8 These residues are located in the CoA binding pocket, within 3–5 Å from the ribosyl-phosphate group of CoA. Site-specific acetyl-lysine incorporation and in vitro biochemical analysis provided direct evidence that SIRT3-mediated deacetylation of K260ac and K265ac enhanced ACAT1 activity, likely due to decreased affinity for coenzyme A (CoA) through lost electrostatic interaction between positively charged lysine and negatively charged 3′-phosphate of CoA.8 Thus, the high intrinsic reactivity toward acetyl-CoA, described here, can identify functionally relevant acetylation sites, particularly those regulated by SIRT3.
Figure 4.
Visualization of lysine reactivity. (A) Lysine reactivity mapped onto mouse ACAT1 structure (modeled from 2IB8, 87% identity; center panel). Reactivities of K260, K263, K265, K270 are shown in the acetyl-CoA binding pocket (left panel). Nonreactive K84 shown forming a salt bridge with E82 and D143 (right panel). (B) Lysine reactivity mapped onto bovine glutamate dehydrogenase (pdb: 3MW9; center panel). Reactivity of K503 shown near the allosteric GTP binding site (left panel). The trimeric antennae of GDH showing K477 and K480 reactivities and their close proximity. Acetylation rate color scale is in Log10 space.
We performed a similar structural analysis of lysine residues from GDH, which exists as a homohexamer featuring stacked dimers of trimers. K503 yielded the highest reactivity with both acetyl-phosphate and acetyl-CoA, and interestingly, this site is known to be acetylated, succinylated, and malonylated in mice.5,24 Sourced from bovine liver tissue, we found K503 of GDH was 10.1% acetylated (Supporting Information Table 1), suggesting that K503 is a highly reactive site both in vivo and in vitro. K503 sits in the allosteric GTP-binding pocket and at the base of the antennae region of GDH (Figure 4). The cleft containing K503 has three arginine residues involved in binding GTP. The charge of this cleft might attract negatively charged acetyl-phosphate and acetyl-CoA. We observed no obvious substrate saturation, suggesting a formal binding does not exist. SIRT5 is reported to function as a mitochondrial desuccinyl and demalonylase and would likely remove such acyl groups from K503 of GDH.24 Succinylated/malonylated K503 would be predicted to prevent binding of the allosteric inhibitor GTP. Interestingly, acetyl-proteomic data for SIRT3 suggests that this sirtuin does not regulate K503 of GDH (Figure 3). Instead, SIRT3 regulates the acetylation status on the tips of the two antennae, each of which involves the cluster of six lysine residues, K477 and K480 from three monomers (Figure 4B). K477 and K480 display a 5- to 10-fold increase in acetylation in liver mitochondria from SIRT3–/– mice and are also two of the most reactive lysines uncovered in this study (Figure 3). The six lysines of each antenna form a positive cluster that does not engage in electrostatic interaction with other amino acids. The antenna region of GDH is known to undergo conformational changes during the catalytic cycle and functions as the conduit for intersubunit communication during allosteric regulation.25,26 The antennae region projects out from the top of each NAD+ binding domain, as well as intersecting near the GTP allosteric site (Figure 4B). Given that the antennae function to transmit catalytic and allosteric information between subunits,25,26 acetylation of K477 and K480 might alter the allosteric behavior of GDH. Further studies will be needed to directly investigate the functional role of K477, K480, and K503 acylation.
To systematically evaluate the structural and chemical features within ACAT1 and GDH that affect lysine reactivity, we assessed the second order rate constants as a function of (1) predicted pKa, (2) B-factor, (3) surface accessibility, and (4) 3-D motifs (Supporting Information Figures 1–4). B-factor and predicted pKa displayed no significant trend as a function of the determined rate constants. There was a more obvious trend in exposed surface area, as reactivity increased with greater surface exposure. Analysis of neighboring residues (within 7 Å) in 3-D revealed some interesting observations. Among the lysines for which we have quantified reactivity, glutamate was the most abundant residue near lysine, but closer proximity (3.4–4 Å) yielded low reactivity, while those 5–6.6 Å away tended to display higher reactivity. Similar trends were noted with aspartate. Interestingly, lysine was found within a very narrow distance range 6–7 Å, and most of the corresponding paired lysines showed greater than average reactivity.
Collectively, our results suggest that surface exposure and local electrostatic interactions influence lysine reactivity toward AcP and AcCoA. Surprisingly, pKa values computed from the structure were not a reliable predictor of lysine reactivity. Similar conclusions were drawn by Kuhn et al., after assessing in vivo acetylation sites likely modified by AcP in bacteria.18 Among the bacterial proteins presumably acetylated by AcP, the linear sequence around the acetylated lysine tended to favor acidic residues glutamate and aspartate. Curiously, in vitro lysine reactivity toward short immobilized peptides favored lysines with a basic lysine or arginine at −1 and +1 positions. Here, our results with ACAT1 and GDH suggest that neighboring basic and acidic residues in 3-D space influence lysine reactivity. Glutamate and aspartate residues engaged in strong salt bridges with lysine yield poor acetylation reactivity, while these acidic groups at distances 5–7 Å permit higher reactivity (Supporting Information Figure 4). Neighboring lysines found within a range of 6–7 Å appeared among the more reactive lysines. Future studies will be needed to establish these trends at the proteome level and to chemically evaluate how local electrostatics direct lysine reactivity.
We previously analyzed the substrate specificity of SIRT3 both in vitro and in vivo.4,27 These results consistently revealed a strong preference for acetylated lysines in peptides containing basic residues. Here, we noted that many of the most reactive lysine residues exist as clusters in three-dimensional space within 6–12 Å and are exemplified by K477–K480 in GDH, and K260–K263–K265 and K171–K178–K187 in ACAT1. Strikingly, these lysines exhibited some of the largest fold-changes in acetylation in liver mitochondria when SIRT3 is absent (Figure 3), suggesting that they represent bona fide targets of SIRT3. Taken together, highly reactive sites that tend to exist within clusters of lysine residues are likely high-affinity substrates of SIRT3. Importantly, the observation that higher chemical reactivity tracks with the likelihood of dynamic modification in vivo provides evidence that enzyme-catalyzed acylation might not be necessary to explain the prevalence of protein acetylation in mitochondria. Furthermore, the second order rate constants measured in this study are sufficiently fast to be biologically relevant. The quantitative analysis described here can be directly applied to evaluating targeted and proteome-wide reactivities.
Methods
Detailed description of methods are described in the Supporting Information.
Acknowledgments
This work was supported, in whole or in part, by NIH GM065386 to J.M.D. and by NSF GRFP DGE-1256259 to J.B. We would like to thank K. Dittenhafer-Reed for the cloning, expression, and purification of TFAM; J. Lee for the expression and purification of histone H3; J. Feldman for the synthesis of histone H3 peptide and H4; and V. Kuzniestsov for the assistance with PyMOL and graphical abstract design.
Supporting Information Available
Protein samples, time-dependent acetylation, concentration-dependent acetylation, sample preparation, chemical acetylation and digestion, determination of second order rate constant for purified peptide, database search and data analysis, acetylation proteomics data aggregation, in silico pKa prediction, solvent accessible surface area calculation, average B-factor calculation, and 3D lysine motif. This material is available free of charge via the Internet at http://pubs.acs.org.
Author Contributions
§ These authors contributed equally to this work
The authors declare no competing financial interest.
Funding Statement
National Institutes of Health, United States
Supplementary Material
References
- Xiong Y.; Guan K. L. (2012) Mechanistic insights into the regulation of metabolic enzymes by acetylation. J. Cell Biol. 198, 155–164. [DOI] [PMC free article] [PubMed] [Google Scholar]
- Yang X. J.; Seto E. (2008) Lysine acetylation: codified crosstalk with other posttranslational modifications. Mol. Cell 31, 449–461. [DOI] [PMC free article] [PubMed] [Google Scholar]
- Choudhary C.; Weinert B. T.; Nishida Y.; Verdin E.; Mann M. (2014) The growing landscape of lysine acetylation links metabolism and cell signalling. Nat. Rev. Mol. Cell Biol. 15, 536–550. [DOI] [PubMed] [Google Scholar]
- Hebert A. S.; Dittenhafer-Reed K. E.; Yu W.; Bailey D. J.; Selen E. S.; Boersma M. D.; Carson J. J.; Tonelli M.; Balloon A. J.; Higbee A. J.; Westphall M. S.; Pagliarini D. J.; Prolla T. A.; Assadi-Porter F.; Roy S.; Denu J. M.; Coon J. J. (2013) Calorie restriction and SIRT3 trigger global reprogramming of the mitochondrial protein acetylome. Mol. Cell 49, 186–199. [DOI] [PMC free article] [PubMed] [Google Scholar]
- Rardin M. J.; Newman J. C.; Held J. M.; Cusack M. P.; Sorensen D. J.; Li B.; Schilling B.; Mooney S. D.; Kahn C. R.; Verdin E.; Gibson B. W. (2013) Label-free quantitative proteomics of the lysine acetylome in mitochondria identifies substrates of SIRT3 in metabolic pathways. Proc. Natl. Acad. Sci. U. S. A. 110, 6601–6606. [DOI] [PMC free article] [PubMed] [Google Scholar]
- Lundby A.; Lage K.; Weinert B. T.; Bekker-Jensen D. B.; Secher A.; Skovgaard T.; Kelstrup C. D.; Dmytriyev A.; Choudhary C.; Lundby C.; Olsen J. V. (2012) Proteomic analysis of lysine acetylation sites in rat tissues reveals organ specificity and subcellular patterns. Cell Rep. 2, 419–431. [DOI] [PMC free article] [PubMed] [Google Scholar]
- Sol E. M.; Wagner S. A.; Weinert B. T.; Kumar A.; Kim H.-S.; Deng C.-X.; Choudhary C. (2012) Proteomic Investigations of Lysine Acetylation Identify Diverse Substrates of Mitochondrial Deacetylase Sirt3. PLoS One 7, e50545. [DOI] [PMC free article] [PubMed] [Google Scholar]
- Still A. J.; Floyd B. J.; Hebert A. S.; Bingman C. A.; Carson J. J.; Gunderson D. R.; Dolan B. K.; Grimsrud P. A.; Dittenhafer-Reed K. E.; Stapleton D. S.; Keller M. P.; Westphall M. S.; Denu J. M.; Attie A. D.; Coon J. J.; Pagliarini D. J. (2013) Quantification of Mitochondrial Acetylation Dynamics Highlights Prominent Sites of Metabolic Regulation. J. Biol. Chem. 288, 26209–26219. [DOI] [PMC free article] [PubMed] [Google Scholar]
- Feldman J. L.; Dittenhafer-Reed K. E.; Denu J. M. (2012) Sirtuin catalysis and regulation. J. Biol. Chem. 287, 42419–42427. [DOI] [PMC free article] [PubMed] [Google Scholar]
- Lombard D. B.; Alt F. W.; Cheng H.-L.; Bunkenborg J.; Streeper R. S.; Mostoslavsky R.; Kim J.; Yancopoulos G.; Valenzuela D.; Murphy A.; Yang Y.; Chen Y.; Hirschey M. D.; Bronson R. T.; Haigis M.; Guarente L. P.; Farese R. V. Jr.; Weissman S.; Verdin E.; Schwer B. (2007) Mammalian Sir2 homolog SIRT3 regulates global mitochondrial lysine acetylation. Mol. Cell. Biol. 27, 8807–8814. [DOI] [PMC free article] [PubMed] [Google Scholar]
- Hallows W. C.; Yu W.; Smith B. C.; Devires M. K.; Ellinger J. J.; Someya S.; Shortreed M. R.; Prolla T.; Markley J. L.; Smith L. M.; Zhao S.; Guan K.-L.; Denu J. M. (2011) Sirt3 Promotes the Urea Cycle and Fatty Acid Oxidation during Dietary Restriction. Mol. Cell 41, 139–149. [DOI] [PMC free article] [PubMed] [Google Scholar]
- Newman J. C.; He W.; Verdin E. (2012) Mitochondrial protein acylation and intermediary metabolism: regulation by sirtuins and implications for metabolic disease. J. Biol. Chem. 287, 42436–42443. [DOI] [PMC free article] [PubMed] [Google Scholar]
- Wagner G. R.; Hirschey M. D. (2014) Nonenzymatic protein acylation as a carbon stress regulated by sirtuin deacylases. Mol. Cell 54, 5–16. [DOI] [PMC free article] [PubMed] [Google Scholar]
- Paik W. K.; Pearson D.; Lee H. W.; Kim S. (1970) Nonenzymatic acetylation of histones with acetyl-CoA. Biochim. Biophys. Acta 213, 513–522. [DOI] [PubMed] [Google Scholar]
- Tanner; Langer; Denu (2000) Kinetic mechanism of human histone acetyltransferase P/CAF. Biochemistry 39, 15652. [DOI] [PubMed] [Google Scholar]
- Kuo Y.-M.; Andrews A. J. (2013) Quantitating the Specificity and Selectivity of Gcn5-Mediated Acetylation of Histone H3. PLoS One 8, e54896. [DOI] [PMC free article] [PubMed] [Google Scholar]
- Wagner G. R.; Payne R. M. (2013) Widespread and Enzyme-independent N∈-Acetylation and N∈-Succinylation of Proteins in the Chemical Conditions of the Mitochondrial Matrix. J. Biol. Chem. 288, 29036–29045. [DOI] [PMC free article] [PubMed] [Google Scholar]
- Kuhn M. L.; Zemaitaitis B.; Hu L. I.; Sahu A.; Sorensen D.; Minasov G.; Lima B. P.; Scholle M.; Mrksich M.; Anderson W. F.; Gibson B. W.; Schilling B.; Wolfe A. J. (2014) Structural, Kinetic and Proteomic Characterization of Acetyl Phosphate-Dependent Bacterial Protein Acetylation. PLoS One 9, e94816. [DOI] [PMC free article] [PubMed] [Google Scholar]
- Weinert B. T.; Iesmantavicius V.; Wagner S. A.; Schölz C.; Gummesson B.; Beli P.; Nyström T.; Choudhary C. (2013) Acetyl-phosphate is a critical determinant of lysine acetylation in E. coli. Mol. Cell 51, 265–272. [DOI] [PubMed] [Google Scholar]
- Schwer B.; Eckersdorff M.; Li Y.; Silva J. C.; Fermin D.; Kurtev M. V.; Giallourakis C.; Comb M. J.; Alt F. W.; Lombard D. B. (2009) Calorie restriction alters mitochondrial protein acetylation. Aging Cell 8, 604–606. [DOI] [PMC free article] [PubMed] [Google Scholar]
- Hirschey M. D.; Shimazu T.; Jing E.; Grueter C. A.; Collins A. M.; Aouizerat B.; Stančáková A.; Goetzman E.; Lam M. M.; Schwer B.; Stevens R. D.; Muehlbauer M. J.; Kakar S.; Bass N. M.; Kuusisto J.; Laakso M.; Alt F. W.; Newgard C. B.; Farese R. V. Jr; Kahn C. R.; Verdin E. (2011) SIRT3 deficiency and mitochondrial protein hyperacetylation accelerate the development of the metabolic syndrome. Mol. Cell 44, 177–190. [DOI] [PMC free article] [PubMed] [Google Scholar]
- Berndsen C. E.; Albaugh B. N.; Tan S.; Denu J. M. (2007) Catalytic Mechanism of a MYST Family Histone Acetyltransferase. Biochemistry 46, 623–629. [DOI] [PMC free article] [PubMed] [Google Scholar]
- Baeza J.; Dowell J. A.; Smallegan M. J.; Fan J.; Amador-Noguez D.; Khan Z.; Denu J. M. (2014) Stoichiometry of site-specific lysine acetylation in an entire proteome. J. Biol. Chem. 289, 21326–21338. [DOI] [PMC free article] [PubMed] [Google Scholar]
- Du J.; Zhou Y.; Su X.; Yu J. J.; Khan S.; Jiang H.; Kim J.; Woo J.; Kim J. H.; Choi B. H.; He B.; Chen W.; Zhang S.; Cerione R. A.; Auwerx J.; Hao Q.; Lin H. (2011) Sirt5 Is a NAD-Dependent Protein Lysine Demalonylase and Desuccinylase. Science 334, 806–809. [DOI] [PMC free article] [PubMed] [Google Scholar]
- Smith T. J.; Schmidt T.; Fang J.; Wu J.; Siuzdak G.; Stanley C. A. (2002) The structure of apo human glutamate dehydrogenase details subunit communication and allostery. J. Mol. Biol. 318, 765–777. [DOI] [PubMed] [Google Scholar]
- Banerjee S.; Schmidt T.; Fang J.; Stanley C. A.; Smith T. J. (2003) Structural Studies on ADP Activation of Mammalian Glutamate Dehydrogenase and the Evolution of Regulation. Biochemistry 42, 3446–3456. [DOI] [PubMed] [Google Scholar]
- Smith B. C.; Settles B.; Hallows W. C.; Craven M. W.; Denu J. M. (2011) SIRT3 substrate specificity determined by peptide arrays and machine learning. ACS Chem. Biol. 6, 146–157. [DOI] [PMC free article] [PubMed] [Google Scholar]
Associated Data
This section collects any data citations, data availability statements, or supplementary materials included in this article.


