

Abstract
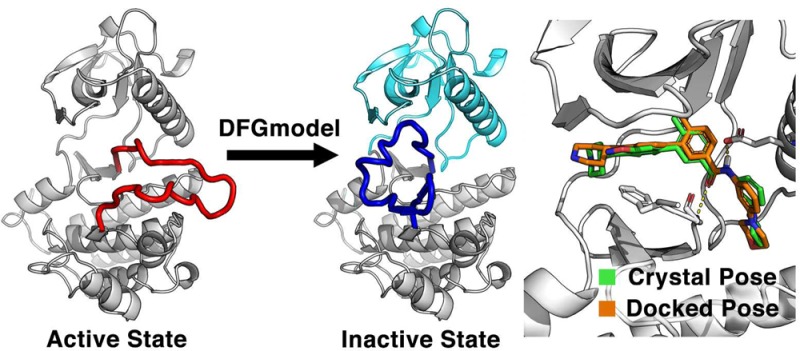
Protein kinases exist in equilibrium of active and inactive states, in which the aspartate-phenylalanine-glycine motif in the catalytic domain undergoes conformational changes that are required for function. Drugs targeting protein kinases typically bind the primary ATP-binding site of an active state (type-I inhibitors) or utilize an allosteric pocket adjacent to the ATP-binding site in the inactive state (type-II inhibitors). Limited crystallographic data of protein kinases in the inactive state hampers the application of rational drug discovery methods for developing type-II inhibitors. Here, we present a computational approach to generate structural models of protein kinases in the inactive conformation. We first perform a comprehensive analysis of all protein kinase structures deposited in the Protein Data Bank. We then develop DFGmodel, a method that takes either a known structure of a kinase in the active conformation or a sequence of a kinase without a structure, to generate kinase models in the inactive conformation. Evaluation of DFGmodel’s performance using various measures indicates that the inactive kinase models are accurate, exhibiting RMSD of 1.5 Å or lower. The kinase models also accurately distinguish type-II kinase inhibitors from likely nonbinders (AUC > 0.70), suggesting that they are useful for virtual screening. Finally, we demonstrate the applicability of our approach with three case studies. For example, the models are able to capture inhibitors with unintended off-target activity. Our computational approach provides a structural framework for chemical biologists to characterize kinases in the inactive state and to explore new chemical spaces with structure-based drug design.
The protein kinase family is one of the largest protein families in human, comprising 518 different kinases that function as on/off switches in cellular signaling pathways and modulate almost all basic cellular activities.1,2 Malfunctions in protein kinases are associated with various diseases,3 such as cancer,4 and autoimmune disorders.5 Therefore, protein kinases are one of the most pursued targets for drug development.6,7 In fact, 25 kinase drugs have already been approved by the FDA, and many other potential kinase drugs are currently in clinical trials.8,9
All protein kinases share similar structural fold.10 This includes a catalytic domain comprising a smaller N-terminal subdomain (N-lobe) and a large C-terminal subdomain (C-lobe), in which the cleft between the two lobes forms the ATP-binding site. The N-lobe is composed of a β-sheet and a long α-helix (αC-helix), whereas the C-lobe is predominantly α-helical. The two lobes are connected by the hinge region, in which the N-lobe can adopt a wide range of positions relative to the C-lobe.11 Situated in the C-lobe, the Asp-Phe-Gly (DFG) motif is a highly conserved motif that forms part of the ATP-binding site and coordinates magnesium binding. Immediately following the DFG-motif is the activation loop (A-loop), a stretch of 20–30 residues, which serves as the regulator of kinase activities.12,13
Protein kinases are highly dynamic. The N-lobe, αC-helix, hinge region, and A-loop can undergo a wide range of movement and adopt multiple conformations, such as DFG-flip and rotation of αC-helix, that define catalytic activity.14−18 Particularly, the DFG-motif of protein kinases adopts two major conformations, including the DFG-in and DFG-out conformations, which are thought to determine active or inactive states, respectively, as well as various intermediate conformations. In the active state or DFG-in conformation, the DFG-Phe is packed into a hydrophobic pocket, the DFG-pocket, between the N- and C-lobes, and stabilizes this active conformation through interactions with hydrophobic residues in that region.19 In this conformation, the ATP-binding site is well-defined; the DFG-Asp faces outward to coordinate a magnesium ion for ATP binding, whereas the A-loop moves away from the ATP-binding site and forms a β-hairpin for substrate binding. Currently, there are 16 FDA-approved drugs that target the ATP-binding site in this conformation to competitively inhibit ATP binding (type-I kinase inhibitors, e.g., vandetanib).9
Conversely, in the inactive state or DFG-out conformation, the DFG-Asp flips, and the DFG-Phe moves out of the DFG-pocket (Figure 1A), which can adopt a range of conformations (Figure S1). This DFG-flip induces movement in the A-loop, thereby deforming and obstructing part of the ATP-binding site. The unoccupied DFG-pocket joins with the deformed ATP-binding site and becomes accessible for ligand binding. Drugs that target the DFG-out conformation (type-II kinase inhibitors), such as the cancer drug imitanib (Gleevec) and sorafenib (Nexavar), have been recently developed, and current effort has focused on the design of this class of inhibitors.9,20 Notably, structural data of kinases with the DFG-out conformation remains scarce, making it difficult to discover unique type-II inhibitor scaffolds for key drug targets such as mTOR and RET with structure-based drug design methods. Thus, several approaches have been developed to model kinase domains in the DFG-out conformation. For example, Kufareva and Abagyan deleted the DFG-motif in a DFG-in kinase structure and replaced it with an attractive potential density.21 Xu et al. modeled the DFG-out conformation by building the A-loop ab initio and rotating the N-lobe by a fixed amount of degree to account for the conformational changes.22 However, the extent of the N-lobe rotation can be highly variable and is still unknown for some kinases (e.g., mTOR). Furthermore, the modeling of the roughly 25-residue A-loop is time-exhaustive and subject to large errors.23
Figure 1.
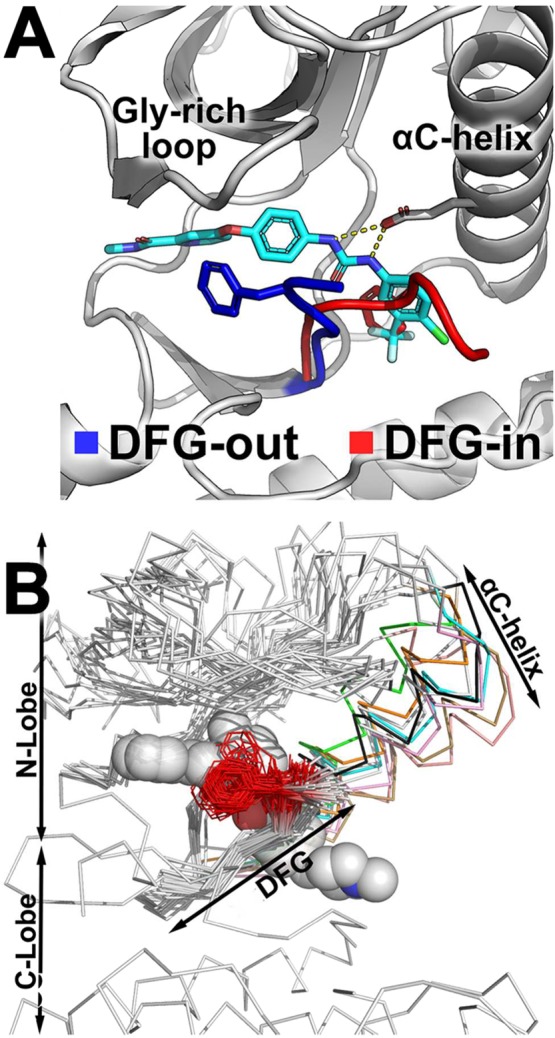
DFG-motif flips between two conformations. (A) Type-II inhibitor sorafenib (cyan sticks) is not compatible with the DFG-in conformation because it overlaps with the phenylalanine residue of the DFG-motif (red stick). (B) The DFG-motif and the residues preceding it are structurally conserved across most kinases, with the Phe side chain (red line) pointing away from the protein core. Type-II inhibitors (gray spheres) occupy the ATP-binding site and the DFG-pocket. The αC-helix of the N-lobe (colored ribbons) can adopt a wide range of conformations, thereby shifting the position of the N-lobe (white ribbons) relative to the C-lobe.
Here, we introduce a method to generate structural models of the kinase domain in DFG-out conformations using homology modeling. We first perform a comprehensive analysis of all experimentally determined kinase structures in complex with small molecule ligands. We then describe the development of DFGmodel, a method that constructs DFG-out kinase models based on multiple structures of related kinases, and evaluate the method’s performance with a variety of measures (e.g., statistical potentials). Finally, we illustrate the utility of the approach by describing three case studies of relevant targets.
Results and Discussion
The DFG-Motif Is Classified into Three Conformational States
The DFG-motif is highly conserved in both sequence and structure among the majority of protein kinases, including various atypical kinases (e.g., mTOR, RNaseR), and its conformation determines the shape of the ATP-binding site (Figure 1). We first grouped all 1950 crystal structures of the human protein kinases from the Protein Data Bank24 (PDB) into three conformational states, DFG-in, DFG-out, and intermediate, by calculating the directional vectors of the residues in the DFG-motif and comparing them to a reference DFG-in kinase structure (Figure S2; Methods). In brief, DFG-in and DFG-out conformations have both directional vectors in roughly opposite directions, and they usually represent ligand-bound conformations; intermediate structures are those with directional vectors that do not match the criteria for DFG-in and DFG-out conformations and are usually apo or have the ligand bound with an irregular pose that distorts the DFG-motif. For example, the DFG-motif of P38α co-crystallized with dibenzoxepinone (PDG: 4L8M) adopts an intermediate conformation in which the DFG-Asp side chain directly interacts with the ligand.17 Structures in the DFG-in, DFG-out, and intermediate conformations account for 75.6, 7.3, and 17.1% of all kinase structures, respectively. Moreover, the fraction of crystal structures in the DFG-out conformation varies between serine/threonine (S/T) kinases and tyrosine (Y) kinases (Figure 2A). This highlights the limited structural information on DFG-out structures that is needed for structure-based drug design of type-II inhibitors.
Figure 2.

Structural features of the human kinome. (A) Fractions of human kinase with known structures in the DFG-in, DFG-out, and intermediate conformations. (B) Kinases with DFG-out conformation in the human kinome. Kinases with an experimentally determined structure in the DFG-out conformation are marked with a red circle. Compositions of key amino acids at the (C) gatekeeper and (D) (D – 1) positions. The majority of these amino acids are equally abundant in kinases with a DFG-out crystal structure and those with a DFG-in crystal structure only.
DFG-Out Conformation Is Highly Conserved
We constructed a multiple structure alignment of all protein kinase structures (Figure 1B). The DFG-out structures are generally less compact than the DFG-in structures. For example, the N-lobe of DFG-out structure adopts a relatively wide range of conformations, as shown by the range of αC-helix positions (Figure 1B). The alignment indicates that the β-hairpin preceding the DFG-motif is structurally conserved, even in atypical kinases, and the majority of the DFG-out structures have similar DFG-motif conformation. Specifically, the Asp and Phe of the DFG-motif, which we defined as the (D) and (D + 1) residues (Methods), respectively, are flipped by approximately 180° in relation to DFG-in structures, whereas the side chain of the (D + 1) residue points away from the hydrophobic DFG-pocket (Figure 1B). The conformation of the DFG-motif and the overall position of the A-loop may be correlated, although it may not be the determinant factor of A-loop secondary structure (Figure S3). Because the A-loop does not take part in forming the DFG-out binding site, the conformation of the A-loop may not be critical for type-II ligand binding. Furthermore, the DFG-flip does not change the overall structure of the C-lobe. This analysis provides a structural framework to generate DFG-out models for kinases with no known DFG-out structures. Particularly, to account for the conformation changes in the N-lobe upon the DFG-flip, we hypothesize that a diverse set of kinase structures in DFG-out conformations with distinct N-lobe conformations, especially the αC-helix and glycine-rich loop, could be used as templates for modeling.
DFG-Out Conformation Is Not Restricted to Only a Few Protein Kinases or Families
Overall, we identified 189 experimentally determined DFG-out structures, which cover the majority of human kinome (Figure 2A,B). This suggests that the DFG-out conformation is not restricted to only a few protein kinases or families, in agreement with previous analysis.9 However, these structures represent only 43 unique proteins, less than 9% of the kinome. In particular, P38α (44) and BRAF (12) structures constitute the majority of S/T-kinase structures, whereas KDR (25) is overrepresented among the Y-kinase structures (Figure S4). This nonuniform distribution is directly related to the current research focus that has mostly centered on a very limited number of targets for therapeutic purposes, such as P38α and KDR, and may not necessarily be because a protein kinase is incapable of adopting the DFG-out conformation that can be targeted by type-II inhibitors.
Next, we analyzed the amino acid composition at two key positions: the gatekeeper residue, which resides in the kinase hinge region of the binding site, and the residue preceding the DFG-motif, i.e., the (D – 1) position (Figure S5).25 These two residues form the bottleneck of the channel that connects the ATP-binding site to the DFG-pocket in the DFG-out conformation. The width of the channel can be approximated by the sum of the size of these residues. We analyzed previously published kinase inhibition profile data26 and observed that type-II inhibitors inhibit kinases with varying channel widths, including those with narrow channels that have large residues at the gatekeeper/(D – 1) positions (Table S1). For example, P38α has a narrow bottleneck to the DFG-pocket. Interestingly, 7 of 14 previously tested type-II inhibitors significantly inhibited P38α activity (Table S1). This suggests that type-II inhibitors can be designed for kinases with a narrow or wide channel, in agreement with previous analysis.9
For the gatekeeper residue, it was previously proposed that this residue limits the accessibility of the DFG-pocket, where a small residue (e.g., Thr) is preferred by type-II inhibitors and larger residues (e.g., Met, and Phe) may block access to the DFG-pocket.21 In contrast, we find that larger amino acids, such as Met and Phe, are as common in kinases with DFG-out structures as in those kinases that have not yet been determined to be in the DFG-out conformation (Figure 2C), in agreement with Zhao et al.9
For the (D – 1) residue, the small amino acids Gly, Ala, Ser, Thr, and Cys account for 82% of the amino acids found at this position in the human kinome (Figure 2D).27 The differences for Gly, Leu, and Ile at this position are statistically insignificant due to the low number of available DFG-out crystal structures (Table S2). Similar to the gatekeeper residue, we do not observe a significant difference in the amino acid composition between kinases with and without known DFG-out structure. These data suggest that the identity of the gatekeeper and (D – 1) residues may not be the only factor that determine a kinase’s susceptibility to type-II kinase inhibitors. Importantly, given that these residues have similar composition in kinases with and without a known DFG-out conformation, it may imply that most protein kinases have the intrinsic ability to access the DFG-out conformation. Other factors may contribute to a kinase’s susceptibility to type-II kinase inhibitors, including the level of phosphorylation in the A-loop,12 the presence of a binding partner,28 or the state of the domain that modulates the conformational state of the kinase,15 which may influence the conformation of the DFG-motif.
DFG-Out Conformations Can Be Modeled Accurately through Homology Modeling
In homology modeling, a target protein is modeled based on one or more related experimentally determined protein structures (i.e., templates). Due to the limited structural data of noncatalytic domains of protein kinases (Figure S6), here we focus on the catalytic domain of the kinase and do not model the noncatalytic domains. Furthermore, the models are based on ligand-bound kinase structures and are therefore expected to capture biologically relevant kinase conformations, similar to the crystal structures. In DFG-out structures, the relative position of the N-lobe to the C-lobe determines the conformation of the binding site, which is typically composed of the DFG-motif, the αC-helix, and the glycine-rich loop (Figure 1B). Modeling DFG-out structures using a single template may not optimally represent the ensemble of conformations of the N/C-lobes.29 Therefore, to capture an “average” DFG-out conformation, we developed an approach, DFGmodel, to generate DFG-out models for the target kinase based on homology modeling of multiple template structures (Figure 3; Methods). We selected 18 representative structures with large variation in the relative position of the N/C-lobes, while avoiding overrepresentation of any kinase (Figure S4), as templates for modeling (Table S3).
Figure 3.

Workflow of DFGmodel.
We evaluated the quality of the multi-template-based models generated by DFGmodel (Figure 4) as well as single-template-based models from MODBASE,30 a database of automatically generated homology models. Particularly, we used three different measures: normalized discrete optimized protein energy (Z-DOPE),31 template modeling score (TM-Score),32 and root-mean-square distance (RMSD). Z-DOPE is a normalized atomic distance-dependent statistical potential based on known protein structure and is used to assess the overall quality of the homology models. A Z-DOPE score below −1.0 indicates high structural overlap to the native structure.33 As expected, crystal structures obtain the best Z-DOPE scores (average score of −1.6 or lower). DFGmodel models perform better than MODBASE models, exhibiting Z-DOPE scores of −1.33 and −1.08, respectively (Tables 1 and S4).
Figure 4.
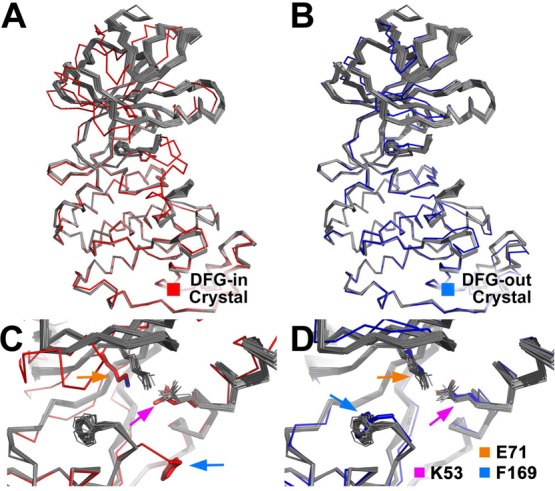
DFGmodel models of P38α. Fifty models (gray ribbon) are shown superposed onto the C-lobe of a (A) DFG-in crystal structure (PDB: 2LGC) and a (B) DFG-out crystal structure (PDB: 4A9Y). (C, D) DFG-flip moves F169 (blue arrow) in the models by 11 Å. Centroid of the models’ N-lobe is shifted, displacing the conserved K53 (orange arrow) by 3.0 Å and E71 (violet arrow) on αC-helix by 1.0 Å. The DFGmodel models are structurally more similar to known DFG-out structures than to DFG-in structures.
Table 1. DFG-Out Model Assessment.
| Z-DOPEa |
|||
|---|---|---|---|
| mean | median | SD | |
| DFG-in crystal structures | –1.66 | –1.63 | 0.17 |
| DFG-out crystal structures | –1.61 | –1.64 | 0.18 |
| DFGmodel models | –1.33 | –1.31 | 0.24 |
| MODBASE models | –1.08 | –1.17 | 0.45 |
| TM-Scoreb |
|||
|---|---|---|---|
| N-lobe | C-lobe | full domain | |
| crystal vs crystals | 0.87 ± 0.02 | 0.88 ± 0.02 | 0.87 ± 0.03 |
| DFGmodel models vs crystals | 0.88 ± 0.02 | 0.95 ± 0.01 | 0.93 ± 0.01 |
| MODBASE model vs crystals | 0.89 ± 0.02 | 0.87 ± 0.02 | 0.87 ± 0.02 |
| RMSDc (Å) |
|||
|---|---|---|---|
| N-lobe | C-lobe | full domain | |
| crystal vs crystals | 0.89 ± 0.21 | 0.70 ± 0.21 | 1.11 ± 0.20 |
| DFGmodel models vs crystals | 1.42 ± 0.12 | 0.96 ± 0.13 | 1.49 ± 0.12 |
| MODBASE models vs crystals | 1.25 ± 0.23 | 1.29 ± 0.14 | 1.79 ± 0.24 |
Z-DOPE is the score based on a normalized atomic distance-dependent statistical potential based on experimentally determined structures.
TM-Score is the template modeling score, which assesses the topological similarity of two protein structures.
RMSD marks the root-mean-square deviation between two structures.
In addition, we used TM-Score and RMSD to directly evaluate the accuracy of the models. TM-Score and RMSD are complementary measures, where TM-Score is more sensitive to the global topology than local variations. In particular, differences among distinct crystal structures of the same protein (crystal-to-crystal comparison) are set as an upper boundary for structure prediction (Tables 1, S5, and S6). Crystal-to-crystal comparisons of the N-lobe and C-lobe, separately, indicate that the lobes are structurally similar, with RMSD values generally lower than 0.9 Å. The full catalytic domain has slightly higher RMSD (1.11 Å) despite the identical sequence, suggesting that the N-lobe can adopt a range of positions relative to the C-lobe in DFG-out crystal structures, supporting our approach to use multiple template structures to represent the rigid movement of the N/C-lobes.
Applying the same structural analysis to our DFG-out models, both DFGmodel and MODBASE models have an average TM-Score above 0.85, which indicates a high probability of the same topology and fold,34 with models generated by DFGmodel score being slightly better than MODBASE models (Table 1). The DFGmodel models also have lower full domain RMSD (1.49 Å) than MODBASE models (1.79 Å) (Tables 1, S7, and S8). Notably, the RMSDs of the model-to-crystal comparison are only marginally higher than those of the crystal-to-crystal comparison. At the subdomain level, the DFGmodel models have RMSDs slightly higher than the corresponding RMSDs in crystal-to-crystal comparison. For example, the RMSD of the N-lobe is usually slightly higher (1.42 Å), probably due to the intrinsically flexible loops that frequently found in this subdomain. In summary, DFGmodel models are more accurate than MODBASE models, likely because they capture the rigid body movement of the lobes observed in the DFG-out structures.
DFG-Out Models Distinguish Type-II Inhibitors from Other Molecules
Because Z-DOPE, TM-Score, and RMSD assess the overall quality of the structure, they are not optimal for selecting the best models for virtual screening.35 Therefore, to evaluate whether the DFG-out models are suitable for virtual screening, we examined how well the models distinguish between type-II kinase inhibitors and non-type-II inhibitors (e.g., type-I inhibitors). Our test set included S/T- and Y-kinases representing distinct branches of the kinome tree (Table 2). To examine the potential utility of the DFGmodel-generated models for structure-based studies such as structure-based drug design36 and virtual screening,37 models with larger binding site volume were selected for enrichment evaluation with a data set of type-II ligands (Methods). Specifically, we used the enrichment plot to derive the area under the curve (AUC) and the logarithmic scale of the enrichment plot (logAUC) values that evaluate the enrichment of type-II inhibitors.35,38 Three case studies are presented: first with kinases with DFG-out structures to demonstrate that our models are comparable to known DFG-out crystal structures, followed by two case studies with kinases that do not have a DFG-out crystal structure to illustrate the potential real-world applicability of DFGmodel.
Table 2. Docking Performance.
| Case 1: Kinases with DFG-Out structure | ||||||||
|---|---|---|---|---|---|---|---|---|
| DFG-out crystal structure |
DFGmodel models |
|||||||
| ligandc | PDB | AUCd | logAUCe | PDB | AUC | logAUC | ||
| KDRb | 34 | 2RL5 | 76.4 | 38.9 | 3CJG | 77.6 | 33.6 | |
| P38αa | 24 | 2BAJ | 79.5 | 37.6 | 1OUY | 82.0 | 41.4 | |
| ABL1b | 20 | 3CS9 | 73.8 | 25.2 | 2F4J | 75.7 | 31.9 | |
| BRAFa | 19 | 4FC0 | 90.6 | 44.6 | 2FB8 | 87.7 | 39.1 | |
| LCKb | 18 | 2OG8 | 84.7 | 45.1 | 3LCK | 85.0 | 44.2 | |
| SRCb | 16 | 2OIQ | 62.4 | 19.4 | 2BDJ | 76.8 | 39.5 | |
| KITb | 14 | 1T46 | 71.3 | 26.9 | 1PKG | 82.4 | 39.0 | |
| EPHA3b | 6 | 3DZQ | 48.1 | 21.9 | 4G2F | 94.3 | 45.4 | |
| CDK8a | 5 | 4F7J | 84.2 | 55.1 | 4G6L | 95.0 | 47.7 | |
| JNK2a | 4 | 3NPC | 79.7 | 30.8 | 3E7O | 89.5 | 36.0 | |
| median | 78.0 | 34.2 | 83.7 | 39.3 | ||||
| SD | 12.3 | 11.6 | 7.0 | 5.1 | ||||
| Case 2: Kinases with No DFG-Out Structure | ||||||||
| RETb | 14 | 2X2L | 82.8 | 36.2 | ||||
| S6K1a | 6 | 4L3J | 92.3 | 39.0 | ||||
| Case 3: Kinase with No Crystal Structure | ||||||||
| PDFGRαb | 14 | n/a | 82.3 | 33.4 | ||||
Case Study 1: Kinases with DFG-Out Structures
We evaluated 10 protein kinases with crystal structures in DFG-in and in DFG-out conformations (Table 2). For each protein, DFGmodel was used to generate DFG-out models. We combined the docking results of these models into a consensus prediction and compared the enrichment of the consensus prediction to that of the known DFG-out crystal structure. Consensus of DFGmodel models enrich better than the experimentally determined DFG-out structures, for which the DFGmodel models obtain a slightly higher AUC median value than that of the DFG-out crystal structure (83.7 vs 78.6) (Table 2 and Figure 5). In addition, consensus DFG-out models perform favorably at retrieving hits early in the screening. For instance, the logAUC value,35 a measurement for early enrichments, indicates that the consensus DFGmodel result matches the performance of DFG-out crystal structures, with median values of 39.3 to 34.2, respectively. These results suggest that the consensus DFGmodel models generally perform as well as DFG-out crystal structure and, in some cases, outperform crystal structure in identifying correct type-II kinase inhibitors. The reason for this performance difference may be due to the fact that crystal structure, which is co-crystallized with a unique inhibitor, may have subtle differences in the binding site that is optimized to enrich a different set of type-II inhibitors.21 The use of consensus docking results from different models that were generated based on diverse DFG-out template structures overcomes the issue of a preoptimized binding pocket. Compared to using multiple DFG-out crystal structures for docking enrichment, which may be limited by the few crystal structures available, e.g., EPHA3 has only one DFG-out crystal structure, DFGmodel inherently generates an ensemble of models and thus we are not limited by the availability of a single DFG-out conformation; we can perform consensus docking against multiple conformations that typically tend to improve enrichment.35
Figure 5.

Enrichment of the consensus DFGmodel models: (A) BRAF, (B) P38α, and (C) S6K1 are S/T-kinases; (D) EPHA3, (E) KIT, and (F) RET are Y-kinases. Blue dotted line represents random selection ligand from a database of ligands and nonbinders. The inserted enrichment plot is the performance of a corresponding DFG-out crystal structure. RET and S6K1 do not have a DFG-out structure for comparison. DFGmodel models perform as well as (e.g., BRAF) or better than the DFG-out crystal structures.
Notably, the docking poses from the consensus DFG-out models are similar to poses of the ligands in DFG-out crystal structures (Figure 6). For example, the docked pose of the type-II inhibitors are comparable to the crystallographic poses seen in the corresponding DFG-out crystal structures (Figures 6A–C). Interestingly, in the majority of our test set of kinases without a known structure in complex with any type-II inhibitor, the predicted docked pose of the ligand is similar to the observed pose in its corresponding crystal structure (Figures 6D–F). For example, ligand 19B was originally designed for P38α (top 0.6%; ranked 9 among 1463 ligands) and was found to inhibit BRAF in a panel of kinase assay.39 The DFG-out model identified 19B as one of the top hits (top 2%; ranked 27), with a docked pose similar to the crystallographic pose in P38α (Figure 6E). Another example is ligand B1E, a BRAF(V600E) inhibitor by design (top 0.5%; ranked 6) that was found to inhibit SRC (top 0.8%; ranked 10) (Figure 6D).40
Figure 6.

Docked and crystal poses of type-II kinase inhibitors: (A) 1N8, (B) PD5, (C) B96, (D) B1E, (E) 19B, (F) AQB, (G) PD3, (H) PD5, and (I) BAX. Docked ligand poses of the DFGmodel models are compared to the poses derived from the corresponding crystal structures. Kinase models are shown as gray cartoons; crystal poses and docked poses are shown as sticks in green and various colors, respectively. DFG-Phe and the conserved Glu in αC-helix are depicted as gray sticks. The PDB name of the ligand is depicted next to the name of the kinase.
Case Study 2: Kinase with No DFG-Out Structure
To demonstrate the applicability of DFGmodel, we modeled two kinases that have not been co-crystallized with type-II kinase inhibitors in the DFG-out conformation before, including S6K1, an S/T-kinase, and RET, a Y-kinase. We chose these two kinases because they have been reported to be targets for a series of type-II inhibitors with well-studied polypharmacology profiles.41 The DFG-out models of S6K1 and RET have average Z-DOPE scores of −0.93 and −1.55, respectively, suggesting that these models are accurate. Furthermore, enrichment calculations of these models suggest that they can accurately distinguish novel type-II inhibitors from type-I inhibitors. For example, DFG-out models of S6K1 and RET have AUC values of 92.3 and 82.8, respectively (Table 2 and Figure 5C,F). Importantly, both models have good early detection performance, with logAUC values of 39.0 and 36.2, respectively. Although crystallographic data of S6K1 and RET in the DFG-out conformation is unavailable, the docking results suggest that our consensus DFGmodel models capture binding site properties that are important for virtual screening. Finally, we compared the predicted structures of S6K1 and RET in complex with their inhibitors PD3 and PD541 to the crystal structures of a different kinase, SRC, bound to these compounds (Figure 6G,H).42 Ligands PD3 and PD5 are broad-spectrum type-II kinase inhibitors that show activity against both S6K1 and RET. Both of these compounds are identified as top hits (top 5%) in our consensus DFG-out models for S6K1 and RET, and their docked poses are highly similar to the crystallographic poses, further increasing our confidence in the models and approach.42
Case Study 3: Kinase with No Structure
Platelet-derived growth factor receptors (PDGFRs) are membrane proteins responsible for regulation of cell growth and division. Of the two human PDGFR subtypes, α and β, abnormality in PDGFRα is associated with glioblastoma multiforme (GBM),43 suggesting that PDGFRα is a drug target for GBM treatment. However, currently, there is no known structure of PDGFRα. Thus, we used DFGmodel to model PDGFRα in the DFG-out conformation. The PDGFRα DFG-out models scores highly using various measures, including the statistical potential Z-DOPE (−1.21) as well as the enrichment values AUC (0.82) and logAUC (33.4), which suggest that the models are sufficiently accurate for productive virtual screening (Table 2). Although we do not have crystallographic data to support the binding modes of the known PDGFRα inhibitors, the docked pose of these type-II ligands are similar to the crystallographic binding pose identified in other known crystal structures. For example, sorafenib is known to inhibit PDGFRα. It was identified as one of the top hits to our consensus DFGmodel of PDGFRα (top 0.5%) and has a docked pose almost identical to the crystallographic pose of sorafenib observed in KDR, a related kinase (Figure 6I).
Conclusions
The limited number of structures of protein kinases in their inactive conformation often hampers the design of novel ligands against key kinase targets. We performed an analysis of the structures and sequences of the human protein kinome. Three key results emerge from this study. First, protein kinases adopt similar inactive DFG-out conformation and use similar amino acid types to regulate interactions with type-II inhibitors. Second, we developed DFGmodel, a method based on homology modeling that utilizes a diverse set of DFG-out template structures to generate kinase models in the inactive, DFG-out conformation (Figure 3). The models generated by DFGmodel are accurate, using various assessment measures, such as RMSD and TM-Score (Table 1). This suggests that our approach provides a framework for modeling kinase structures in conformations relevant for drug discovery. Third, the performance of the models in distinguishing known type-II inhibitors from other small molecules is comparable to or exceeds that of the DFG-out crystal structures (Table 2). Thus, DFGmodel is useful for virtual screening to identify novel kinase inhibitors and allows us to rationalize off-target effects of some type-II kinase inhibitors. The results presented in this study provide a structural basis for using homology modeling to characterize kinases in the DFG-out conformation for ligand discovery.
Methods
Alignment of Kinase Sequences and Structures
We used keyword search to obtain structures that are associated with human protein kinases from the PDB (total of 5484 chains).24 Because a typical kinase catalytic domain’s length is 220–300 residues, protein sequences with fewer than 200 residues (e.g., cyclin A, kinase fragments) were removed. The remaining sequences were aligned using T-Coffee/Expresso44,45 and visualized in Jalview46 v2.8.1. Sequences without the highly conserved glycine-rich loop and DFG-motif were discarded. For crystal structures that include multiple chains of the same kinase, the first chain in the structure was used. We identified a total of 3247 kinase chains that correspond to 2551 crystal structures (1924 are S/T-kinases and 627 are Y-kinases). Protein kinase structures were processed with BioPython.47,48 All S/T- and Y-kinases were structurally aligned to the C-lobe, excluding the A-loop, of the template protein kinase PKA (1ATP) and SRC (2BDF), respectively, with PyMOL.49 Kinases that are divergent in structures (RMSD > 5.0 Å), including atypical kinases such as pyruvate dehydrogenase kinases, RNaseR, mTOR, and PI3Ks, were not included in the analysis.
DFG-Motif Conformation Classification
Residues in or adjacent to the DFG-motif are named based on their relative positions to the Asp (D) of the DFG-motif. For example, Gly of the DFG-motif is at the (D + 2) position. DFG-motif conformation (i.e., DFG-in, DFG-out, or intermediate) is partially dictated by the dihedral angles of residues at the (D – 1) and (D) positions, which influence the directions of the side chains of the residues at the (D) and (D + 1) positions. A major difference between DFG-in and DFG-out conformations is the directional flip of the residues at the (D) and (D + 1) positions (Figure 1A). This directionality change can be quantified and compared using a vector-based method
where r1, r2, r3, and r4 are the atomic coordinates of (D):Cγ, (D):Cα, (D + 1):Cα, and (D + 1):Cγ, respectively, whereas the cross products nD and nD+1 define the direction of the residues at (D) and (D + 1) (Figure S2). The vectors nD and nD+1 are compared to the corresponding vectors found in the reference DFG-in structure, 1ATP, and various structures with well-defined DFG conformations, to derive the following conditions. The model has a DFG-in conformation if nD·nDref > −0.005 and nD+1·nD+1ref > 0.0. If nD·nDref < −0.125 and nD+1·nD+1ref < −0.05, then it has a DFG-out conformation. Those that do not fall into any of the categories have an intermediate conformation. The kinome tree diagram is generated with Kinome Render.50
DFGmodel
Models of the target kinases in DFG-out conformation were generated using MODELLER51 v9.12 based on 18 DFG-out kinases structures (Table S3). The entire N-lobe and the DFG-motif (from the (D – 2) to (D + 2) position) were modeled on the basis of the selected template structures, whereas the rest of the C-lobe would remain the same as the input structure. A-loop residues beyond (D + 2) were excluded from modeling because they are not in close proximity to the type-II inhibitor-binding site and are often disordered, adopting an ensemble of conformations (Figure S3). For each target, 50 initial models were generated and subsequently refined with two cycles of optimization, which undergoes 300 iterations of conjugate gradients using a variable-target function method and molecular dynamics with simulated annealing. Because, in some models, the binding site was blocked by rotamers of a residue in close proximity to the binding site, we excluded models with a particularly small volume by selecting 10 models with the largest calculated binding site volume as the docking receptors. The volume of a DFG-out model’s binding site was calculated using POVME52 v2.0. A sphere of inclusive volume and a sphere of exclusive volume defined the binding pocket for grid-point calculation. A grid space of 0.75 Å and a receptor–atom distance cutoff of 1.50 Å were used. Volume outside of the receptor’s convex hull was excluded. Small isolated volumes were considered contiguous with the primary pocket if they share more than eight neighboring points in common.
Model Assessment
The multiple-template DFG-out models were compared to both the crystal structures and the best single-template model from MODBASE.30 Three metrics were used to assess the quality of the multitemplate DFG-out models: Z-DOPE,31 TM-Score,32,34 and RMSD. For TM-Score and RMSD, the models were compared to the N-lobe, C-lobe, and full domain of both the DFG-in and DFG-out crystal structures, if a structure is available.
Docking Assessment
The selected DFG-out model’s ability to enrich type-II inhibitors in a docking screen was evaluated with a set of 1463 known type-I and type-II kinase inhibitors (Figure S7). Since many type-II kinase inhibitors are known to have a wide spectrum of anti-kinase activity, we searched through the corresponding literature to extract additional kinase assay data for virtual screening performance analysis. Molecular docking of small molecules against the models was done with FRED,53 a component of OpenEye’s OEDocking modeling suit, whereas the docked ligands were processed by RDKit. We used OMEGA53,54 to generate the ligand library, in which a maximum of 300 conformers was allowed. The best scoring pose of each ligand from the docked models was selected as the representative of the consensus docked ligand. Performance of the docking results was measured by the area under the curve (AUC) of the enrichment plot. Early detection performance of the model was quantified by the logarithmic scale of enrichment plot (logAUC) value.35
Acknowledgments
We thank Drs. A. Dar and R. Cagan (both Mount Sinai) for helpful discussions and sharing insights on protein kinases. This work was supported in part by the National Institutes of Health (R01 GM108911). We appreciate OpenEye Scientific Software, Inc. for granting us access to its high-performance molecular modeling applications through its academic license program. This work was supported in part through the computational resources and staff expertise provided by the Department of Scientific Computing at the Icahn School of Medicine at Mount Sinai.
Supporting Information Available
Figure S1: DFG-phenylalanine side chain adopts multiple conformations. Figure S2: Atomic coordinates and vectors for DFG-motif vector calculations. Figure S3: Activation loop in DFG-out kinase structures is structurally diverse. Figure S4: Number of experimentally determined DFG-out structures. Figure S5: The gatekeeper and (D – 1) residues. Figure S6: Length distribution of human protein kinase chains. Figure S7: Definition of type-I and type-II kinase inhibitors. Table S1: Size-score of select protein kinases. Table S2: Composition of amino acid type at the gatekeeper and (D – 1) positions in human kinome. Table S3: Eighteen templates for DFGmodel. Table S4: Z-DOPE scores for crystal structures and models. Table S5: Comparison of DFG-in crystal structures. Table S6: Comparison between DFG-out crystal structures. Table S7: Comparison between DFGmodel models and DFG-out crystal structures. Table S8: Comparison between MODBASE DFG-out models and crystal structures. This material is available free of charge via the Internet at http://pubs.acs.org.
The authors declare no competing financial interest.
Funding Statement
National Institutes of Health, United States
Supplementary Material
References
- Manning G.; Whyte D. B.; Martinez R.; Hunter T.; Sudarsanam S. (2002) The protein kinase complement of the human genome. Science 298, 1912–1934. [DOI] [PubMed] [Google Scholar]
- Manning G.; Plowman G. D.; Hunter T.; Sudarsanam S. (2002) Evolution of protein kinase signaling from yeast to man. Trends Biochem. Sci. 27, 514–520. [DOI] [PubMed] [Google Scholar]
- Lahiry P.; Torkamani A.; Schork N. J.; Hegele R. A. (2010) Kinase mutations in human disease: interpreting genotype-phenotype relationships. Nat. Rev. Genet. 11, 60–74. [DOI] [PubMed] [Google Scholar]
- Chang F.; Steelman L. S.; Lee J. T.; Shelton J. G.; Navolanic P. M.; Blalock W. L.; Franklin R. A.; McCubrey J. A. (2003) Signal transduction mediated by the Ras/Raf/MEK/ERK pathway from cytokine receptors to transcription factors: potential targeting for therapeutic intervention. Leukemia 17, 1263–1293. [DOI] [PubMed] [Google Scholar]
- He Y.; Xu H.; Liang L.; Zhan Z.; Yang X.; Yu X.; Ye Y.; Sun L. (2008) Antiinflammatory effect of Rho kinase blockade via inhibition of NF-kappaB activation in rheumatoid arthritis. Arthritis Rheum. 58, 3366–3376. [DOI] [PubMed] [Google Scholar]
- Cohen P. (2002) Protein kinases—the major drug targets of the twenty-first century?. Nat. Rev. Drug Discovery 1, 309–315. [DOI] [PubMed] [Google Scholar]
- Roberts P. J.; Der C. J. (2007) Targeting the Raf-MEK-ERK mitogen-activated protein kinase cascade for the treatment of cancer. Oncogene 26, 3291–3310. [DOI] [PubMed] [Google Scholar]
- Fabbro D.; Cowan-Jacob S. W.; Mobitz H.; Martiny-Baron G. (2012) Targeting cancer with small-molecular-weight kinase inhibitors. Methods Mol. Biol. 795, 1–34. [DOI] [PubMed] [Google Scholar]
- Zhao Z.; Wu H.; Wang L.; Liu Y.; Knapp S.; Liu Q.; Gray N. S. (2014) Exploration of type II binding mode: a privileged approach for kinase inhibitor focused drug discovery?. ACS Chem. Biol. 9, 1230–1241. [DOI] [PMC free article] [PubMed] [Google Scholar]
- Hanks S. K.; Hunter T. (1995) Protein kinases 6. The eukaryotic protein kinase superfamily: kinase (catalytic) domain structure and classification. FASEB J. 9, 576–596. [PubMed] [Google Scholar]
- Masterson L. R.; Cheng C.; Yu T.; Tonelli M.; Kornev A.; Taylor S. S.; Veglia G. (2010) Dynamics connect substrate recognition to catalysis in protein kinase A. Nat. Chem. Biol. 6, 821–828. [DOI] [PMC free article] [PubMed] [Google Scholar]
- Canagarajah B. J.; Khokhlatchev A.; Cobb M. H.; Goldsmith E. J. (1997) Activation mechanism of the MAP kinase ERK2 by dual phosphorylation. Cell 90, 859–869. [DOI] [PubMed] [Google Scholar]
- Stevenson L. M.; Deal M. S.; Hagopian J. C.; Lew J. (2002) Activation mechanism of CDK2: role of cyclin binding versus phosphorylation. Biochemistry 41, 8528–8534. [DOI] [PubMed] [Google Scholar]
- Frankel M.; Bishop S. M.; Ablooglu A. J.; Han Y. P.; Kohanski R. A. (1999) Conformational changes in the activation loop of the insulin receptor’s kinase domain. Protein Sci. 8, 2158–2165. [DOI] [PMC free article] [PubMed] [Google Scholar]
- Huse M.; Kuriyan J. (2002) The conformational plasticity of protein kinases. Cell 109, 275–282. [DOI] [PubMed] [Google Scholar]
- Huang H.; Zhao R.; Dickson B. M.; Skeel R. D.; Post C. B. (2012) alphaC helix as a switch in the conformational transition of Src/CDK-like kinase domains. J. Phys. Chem. B 116, 4465–4475. [DOI] [PMC free article] [PubMed] [Google Scholar]
- Martz K. E.; Dorn A.; Baur B.; Schattel V.; Goettert M. I.; Mayer-Wrangowski S. C.; Rauh D.; Laufer S. A. (2012) Targeting the hinge glycine flip and the activation loop: novel approach to potent p38alpha inhibitors. J. Med. Chem. 55, 7862–7874. [DOI] [PubMed] [Google Scholar]
- Gustafson W. C.; Meyerowitz J. G.; Nekritz E. A.; Chen J.; Benes C.; Charron E.; Simonds E. F.; Seeger R.; Matthay K. K.; Hertz N. T.; Eilers M.; Shokat K. M.; Weiss W. A. (2014) Drugging MYCN through an allosteric transition in Aurora kinase A. Cancer Cell 26, 414–427. [DOI] [PMC free article] [PubMed] [Google Scholar]
- Kornev A. P.; Haste N. M.; Taylor S. S.; Eyck L. F. (2006) Surface comparison of active and inactive protein kinases identifies a conserved activation mechanism. Proc. Natl. Acad. Sci. U.S.A. 103, 17783–17788. [DOI] [PMC free article] [PubMed] [Google Scholar]
- Blanc J.; Geney R.; Menet C. (2013) Type II kinase inhibitors: an opportunity in cancer for rational design. Anti-Cancer Agents Med. Chem. 13, 731–747. [DOI] [PubMed] [Google Scholar]
- Kufareva I.; Abagyan R. (2008) Type-II kinase inhibitor docking, screening, and profiling using modified structures of active kinase states. J. Med. Chem. 51, 7921–7932. [DOI] [PMC free article] [PubMed] [Google Scholar]
- Xu M.; Yu L.; Wan B.; Yu L.; Huang Q. (2011) Predicting inactive conformations of protein kinases using active structures: conformational selection of type-II inhibitors. PLoS One 6, e22644. [DOI] [PMC free article] [PubMed] [Google Scholar]
- Zhao S.; Zhu K.; Li J.; Friesner R. A. (2011) Progress in super long loop prediction. Proteins 79, 2920–2935. [DOI] [PMC free article] [PubMed] [Google Scholar]
- Berman H. M.; Westbrook J.; Feng Z.; Gilliland G.; Bhat T. N.; Weissig H.; Shindyalov I. N.; Bourne P. E. (2000) The Protein Data Bank. Nucleic Acids Res. 28, 235–242. [DOI] [PMC free article] [PubMed] [Google Scholar]
- Hari S. B.; Merritt E. A.; Maly D. J. (2013) Sequence determinants of a specific inactive protein kinase conformation. Chem. Biol. 20, 806–815. [DOI] [PMC free article] [PubMed] [Google Scholar]
- Davis M. I.; Hunt J. P.; Herrgard S.; Ciceri P.; Wodicka L. M.; Pallares G.; Hocker M.; Treiber D. K.; Zarrinkar P. P. (2011) Comprehensive analysis of kinase inhibitor selectivity. Nat. Biotechnol. 29, 1046–1051. [DOI] [PubMed] [Google Scholar]
- Livingstone C. D.; Barton G. J. (1993) Protein sequence alignments: a strategy for the hierarchical analysis of residue conservation. Comput. Appl. Biosci. 9, 745–756. [DOI] [PubMed] [Google Scholar]
- Brennan D. F.; Dar A. C.; Hertz N. T.; Chao W. C.; Burlingame A. L.; Shokat K. M.; Barford D. (2011) A Raf-induced allosteric transition of KSR stimulates phosphorylation of MEK. Nature 472, 366–369. [DOI] [PubMed] [Google Scholar]
- Larsson P.; Wallner B.; Lindahl E.; Elofsson A. (2008) Using multiple templates to improve quality of homology models in automated homology modeling. Protein Sci. 17, 990–1002. [DOI] [PMC free article] [PubMed] [Google Scholar]
- Pieper U.; Eswar N.; Stuart A. C.; Ilyin V. A.; Sali A. (2002) MODBASE, a database of annotated comparative protein structure models. Nucleic Acids Res. 30, 255–259. [DOI] [PMC free article] [PubMed] [Google Scholar]
- Shen M. Y.; Sali A. (2006) Statistical potential for assessment and prediction of protein structures. Protein Sci. 15, 2507–2524. [DOI] [PMC free article] [PubMed] [Google Scholar]
- Zhang Y.; Skolnick J. (2004) Scoring function for automated assessment of protein structure template quality. Proteins 57, 702–710. [DOI] [PubMed] [Google Scholar]
- Eramian D.; Eswar N.; Shen M. Y.; Sali A. (2008) How well can the accuracy of comparative protein structure models be predicted?. Protein Sci. 17, 1881–1893. [DOI] [PMC free article] [PubMed] [Google Scholar]
- Xu J.; Zhang Y. (2010) How significant is a protein structure similarity with TM-score = 0.5?. Bioinformatics 26, 889–895. [DOI] [PMC free article] [PubMed] [Google Scholar]
- Fan H.; Irwin J. J.; Webb B. M.; Klebe G.; Shoichet B. K.; Sali A. (2009) Molecular docking screens using comparative models of proteins. J. Chem. Inf. Model. 49, 2512–2527. [DOI] [PMC free article] [PubMed] [Google Scholar]
- Kuntz I. D. (1992) Structure-based strategies for drug design and discovery. Science 257, 1078–1082. [DOI] [PubMed] [Google Scholar]
- Shoichet B. K. (2004) Virtual screening of chemical libraries. Nature 432, 862–865. [DOI] [PMC free article] [PubMed] [Google Scholar]
- Schlessinger A.; Geier E.; Fan H.; Irwin J. J.; Shoichet B. K.; Giacomini K. M.; Sali A. (2011) Structure-based discovery of prescription drugs that interact with the norepinephrine transporter, NET. Proc. Natl. Acad. Sci. U.S.A. 108, 15810–15815. [DOI] [PMC free article] [PubMed] [Google Scholar]
- Baldwin I.; Bamborough P.; Haslam C. G.; Hunjan S. S.; Longstaff T.; Mooney C. J.; Patel S.; Quinn J.; Somers D. O. (2008) Kinase array design, back to front: biaryl amides. Bioorg. Med. Chem. Lett. 18, 5285–5289. [DOI] [PubMed] [Google Scholar]
- Wenglowsky S.; Moreno D.; Laird E. R.; Gloor S. L.; Ren L.; Risom T.; Rudolph J.; Sturgis H. L.; Voegtli W. C. (2012) Pyrazolopyridine inhibitors of B-Raf(V600E). Part 4: rational design and kinase selectivity profile of cell potent type II inhibitors. Bioorg. Med. Chem. Lett. 22, 6237–6241. [DOI] [PubMed] [Google Scholar]
- Dar A. C.; Das T. K.; Shokat K. M.; Cagan R. L. (2012) Chemical genetic discovery of targets and anti-targets for cancer polypharmacology. Nature 486, 80–84. [DOI] [PMC free article] [PubMed] [Google Scholar]
- Dar A. C.; Lopez M. S.; Shokat K. M. (2008) Small molecule recognition of c-Src via the Imatinib-binding conformation. Chem. Biol. 15, 1015–1022. [DOI] [PMC free article] [PubMed] [Google Scholar]
- Nazarenko I.; Hede S. M.; He X.; Hedren A.; Thompson J.; Lindstrom M. S.; Nister M. (2012) PDGF and PDGF receptors in glioma. Upsala J. Med. Sci. 117, 99–112. [DOI] [PMC free article] [PubMed] [Google Scholar]
- Notredame C.; Higgins D. G.; Heringa J. (2000) T-Coffee: a novel method for fast and accurate multiple sequence alignment. J. Mol. Biol. 302, 205–217. [DOI] [PubMed] [Google Scholar]
- Armougom F.; Moretti S.; Poirot O.; Audic S.; Dumas P.; Schaeli B.; Keduas V.; Notredame C. (2006) Expresso: automatic incorporation of structural information in multiple sequence alignments using 3D-Coffee. Nucleic Acids Res. 34, W604–608. [DOI] [PMC free article] [PubMed] [Google Scholar]
- Waterhouse A. M.; Procter J. B.; Martin D. M.; Clamp M.; Barton G. J. (2009) Jalview version 2—a multiple sequence alignment editor and analysis workbench. Bioinformatics 25, 1189–1191. [DOI] [PMC free article] [PubMed] [Google Scholar]
- Hamelryck T.; Manderick B. (2003) PDB file parser and structure class implemented in Python. Bioinformatics 19, 2308–2310. [DOI] [PubMed] [Google Scholar]
- Cock P. J.; Antao T.; Chang J. T.; Chapman B. A.; Cox C. J.; Dalke A.; Friedberg I.; Hamelryck T.; Kauff F.; Wilczynski B.; de Hoon M. J. (2009) Biopython: freely available Python tools for computational molecular biology and bioinformatics. Bioinformatics 25, 1422–1423. [DOI] [PMC free article] [PubMed] [Google Scholar]
- The PyMOL Molecular Graphics System, 1.6.0.0 ed., Schrödinger, LLC, New York.
- Chartier M.; Chenard T.; Barker J.; Najmanovich R. (2013) Kinome Render: a stand-alone and web-accessible tool to annotate the human protein kinome tree. PeerJ 1, e126. [DOI] [PMC free article] [PubMed] [Google Scholar]
- Sali A.; Blundell T. L. (1993) Comparative protein modelling by satisfaction of spatial restraints. J. Mol. Biol. 234, 779–815. [DOI] [PubMed] [Google Scholar]
- Durrant J. D.; de Oliveira C. A.; McCammon J. A. (2011) POVME: an algorithm for measuring binding-pocket volumes. J. Mol. Graphics Modell. 29, 773–776. [DOI] [PMC free article] [PubMed] [Google Scholar]
- OEDocking, 3.0.1; OMEGA, 2.5.1.4, OpenEye Scientific Software, Santa Fe, NM.
- Hawkins P. C.; Skillman A. G.; Warren G. L.; Ellingson B. A.; Stahl M. T. (2010) Conformer generation with OMEGA: algorithm and validation using high quality structures from the Protein Databank and Cambridge Structural Database. J. Chem. Inf. Model. 50, 572–584. [DOI] [PMC free article] [PubMed] [Google Scholar]
Associated Data
This section collects any data citations, data availability statements, or supplementary materials included in this article.