Abstract
Background
The aim of the study was to assess the correlation between computed tomography perfusion (PCT) parameters and PSA levels, Gleason score, and pTNM stage in patients with prostate cancer (PCa).
Material/Methods
One hundred twenty-five patients with localized PCa were prospectively enrolled in the study. All patients were diagnosed due to suspicious prostate findings and elevated PSA serum levels and underwent PCT followed by core biopsy and radical prostatectomy. Blood flow (BF), blood volume (BV), mean transit time (MTT), and permeability-surface (PS) area product were computed in the suspected PCa area and normal prostatic tissue. Core biopsy followed by prostatectomy was performed 2–4 weeks after PCT. Correlation between PCT findings and PSA levels, Gleason score, and pTNM stage were analyzed.
Results
The mean age of patients was 64 years. All patients had elevated PSA levels (mean value 6.2 ng/ml). Nineteen patients (15.9%) were at low risk of recurrence, 91 (76.5%) were at moderate risk, and 9 (7.6%) were at high risk according to National Comprehensive Cancer Network criteria. PCa was visible on PCT as focal peripheral CT enhancement in 119 out of 125 patients (sensitivity 95.2%). Significant correlations between BV, BF, and PS values and PSA level were found (p<0.05), as well as a trend for difference between BV, BF, and PS in poorly and moderately differentiated tumors (according to Gleason score) in comparison with highly differentiated PCa (p<0.08). The analysis also revealed a correlation between mean perfusion values and BV, MTT, PS, and pTNM cancer stage (p<0.04).
Conclusions
Our study suggests that in low- and intermediate- risk patients, PCT parameters correlate with PSA values, Gleason score, and pTNM stage and can be useful for initial tumor staging.
MeSH Keywords: Multidetector Computed Tomography, Perfusion Imaging, Prostatic Neoplasms
Background
Prostate cancer (PCa) is the second-leading cause of cancer death in men. Furthermore, imaging of localized PCa still remains limited [1]. Because the disease often develops without any symptoms, utilizing additional examinations (such as biochemistry or imaging) for early detection and definition of tumor aggressiveness is of great importance.
It has been estimated that approximately 20% of men will be diagnosed with PCa in their lifetime [2]. Since the advent of prostate specific antigen (PSA) screening, most of them are diagnosed with localized disease. While prostatectomy or radiation treatment is the standard therapy for early-stage PCa, 30–40% of patients will develop recurrent and/or metastatic disease. On the other hand, many non-advanced tumors have low potential for dissemination and progression. These patients probably do not benefit from radical treatment and observation only or conservative treatment should be considered; therefore, there is a need for new pretreatment PCa staging models.
The diagnosis and localization of PCa are based on a digital rectal examination (DRE) and assessment of serum (PSA) followed by a trans-rectal ultrasound (TRUS) [2,3]. Magnetic resonance imaging (MRI) has recently become a common tool in the local tumor extension definition. However, the contraindications for MRI (claustrophobia, metallic endoprosthesis, clips, and stents) must be considered. Moreover, MRI devices are not widespread in lower-middle income countries.
New functional imaging methods have come into use in recent years, using neovascularization of malignant tumors. Angiogenesis, the formation of new blood vessels from the pre-existing vascular bed, is an integral part of benign prostate hyperplasia; it is associated with prostatic intraepithelial neoplasia (PIN) and is a key factor in the growth and metastasis of PCa [4]. Increased neovascularity within the prostate is the marker of prostate malignancy and it is associated with an increased likelihood of metastasis, higher stage of the disease, and reduced survival [5]. Multidetector computed tomography (MDCT) is already widely used as a general imaging method for evaluating cancer angiogenesis. This technique is performed after intravenous administration of an exogenous contrast medium [6]. Perfusion computed tomography (PCT), or dynamic contrast-enhanced CT (DCE-CT), is the acquisition of serial images through the same volume over time after the administration of a bolus of iodinated contrast media. Thanks to the excellent linearity between tissue attenuation and iodine concentration, DCE-CT allows the analysis of blood flow and blood volume estimates in tumors. This technique was first used in the evaluation of patients with acute stroke, but has also been reported to be useful in the detection of tumor angiogenesis [7–12].
The observed tissue enhancement is related to blood flow (BF), blood volume (BV), mean transit time (MTT), and capillary permeability and surface area (PS). PCT has the advantage of high spatial resolution, involves little risk to patients, and data acquisition can be incorporated into routine patient studies [5]. Our previous study proved the high sensitivity of PCT in PCa imaging (Luczynska et al.). Perfusion CT is a valuable method for diagnosis of prostate cancer (see our previous prospective study in 94 patients, research grant no. NN403240837 of the Polish Ministry of Science and Higher Education, submitted for publication). Therefore, the question is whether PCT is more efficient, safe, and cost-effective than the standard methods. The aim of this study was to estimate the correlation between perfusion parameters and commonly used prognostic factors – PSA level, Gleason score, and pTNM stage – in PCa patients.
Material and Methods
The study protocol was approved by the Polish Ministry of Science and Higher Education, research grant no. NN403240837 titled “CT perfusion and biological markers in local staging and risk assessment in surgically treated prostate cancer patients”. The study was approved by the Ethics Committee of the Center of Oncology, M. Sklodowska-Curie Memorial Institute, Cracow Branch, and prior written informed consent was obtained from all patients. The study included 3 tasks, based on similar group of patients: 1) Imaging study: PCT in the visualization of PCa, 2) Pathological study: Correlation between PCT parameters and clinico-pathological features of PCa, and 3) Molecular study: Correlation between PCT parameters, immune-histological findings, and immune-histochemical expression of angiogenesis-related markers in non-advanced PCa.
The following report presents the data from Study 2, and data analysis of Studies 1 and 3 will be published separately.
Patients
We prospectively enrolled patients meeting these inclusion criteria: serum PSA level >4 ng/ml and suspicious imaging results at TRUS suggesting prostate malignancy, scheduled for prostate biopsy, and with serum creatinine level ≤1 mg/dL. We excluded patients with previous cancer at other sites, androgen deprivation prior to PCT, allergy to iodinated contrast media, serum creatinine ≥1 mg/dL, disqualification from surgery, or who refused to participate.
Study design
In brief, the study design included the prostate PCT, followed by prostate biopsy (performed 2–4 weeks after PCT). If prostate malignancy was proven, radical prostatectomy was performed in the following 2 weeks.
Study procedures included:
Prospective registration of the eligible patients and signing of informed consent.
Performing PCT.
Evaluation of PCT color maps and computation of the following perfusion parameters: blood flow (BF), blood volume (BV), permeability-surface area (PS), and mean transit time (MTT).
Performance of core biopsy.
Radical prostatectomy.
Analysis of correlation between BF, BV, PS, and MTT, and clinic-pathological findings.
Clinical staging was carried out according to the American Joint Committee on Cancer (AJCC) and the International Union Against Cancer staging system [13]. Pathological examination of prostate consists of microscopic evaluation of hematoxylin-eosin stained specimens. The slides were made by sectioning the gland every 5 mm, from apex to base. An experienced pathologist, blinded to the PCT results, evaluated the whole set of slides to assess the presence of malignancy and its grading according to Gleason score [14,15]. All diagnostic and treatment procedures were performed at the study Center, which was the M. Sklodowska-Curie Memorial Institute, Cracow Branch, Poland.
Imaging technique
CT examinations were performed using a 16-section multidetector (MDCT) CT scanner (LightSpeed 16: GE Healthcare, Milwaukee, WI, USA). Preliminary non-contrast CT of the pelvis (5-mm thickness) was performed to localize the prostate. The scanning range for the PCT was chosen to include 2 levels: upper level (≤2 cm above the center of the prostate gland) and lower level (2 cm below the center), which together covered an area of 4 cm (top-bottom dimension). A total of 100 ml (2×50 ml) of nonionic iodinated contrast material was injected at 1.5 mL/kg at an injection rate 2 mL/s (Ultravist 370 mg I/ml: Bayer Schering Pharma, Leverkusen, Germany). PCT scanning started 5 s after contrast administration; 80 kVp and 120 mA images were acquired every 1 s for 50 s. Immediately after completion of PCT scanning, diagnostic CT of the abdomen and pelvis was performed with 5-mm slices.
Image analysis
The images obtained were transferred to an image-processing workstation (Advantage Windows 4.2: GE Healthcare) and analyzed with commercially available software (CT Perfusion 4: GE Healthcare). The arterial input was obtained from a standardized region in the external iliac artery (EIA), with selection of the section that allowed best visualization to avoid partial-volume artifacts. A time-attenuation curve, expressed in Hounsfield units (HU) per s, was generated for the arterial input (Figure 1). For qualitative analysis, dynamic CT images and perfusion maps were assessed. The analysis of dynamic CT images was performed by means of the cine-loop tool used with perfusion CT 4.0 software. For quantitative analysis, a region of interest (ROI) was manually drawn by 2 experienced radiology consultants (EL and STD) along the visible margins of the suspicious PCa (identified as the fastest and strongest enhancement area in the gland) and for normal prostate tissue using an electronic cursor.
Figure 1.
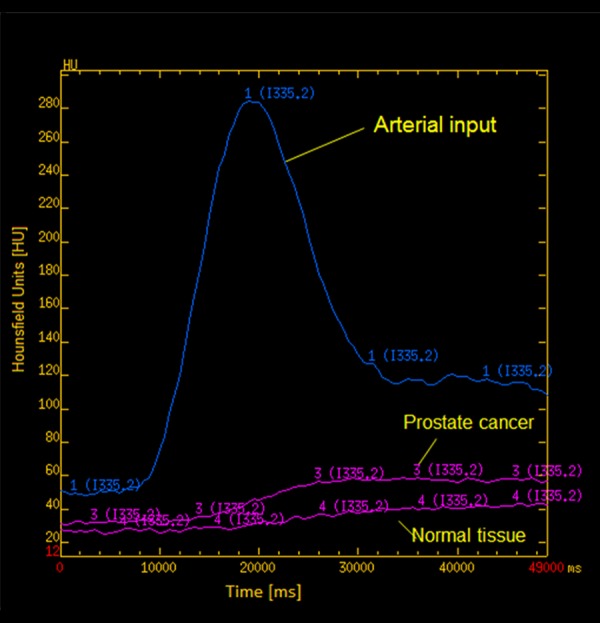
A time-attenuation curve – plots for prostate cancer and normal tissue.
ROIs were chosen so that on all images, they were drawn over regions of tumor throughout the image series, irrespective of motion (Figure 2). If excessive motion artifacts precluded drawing a region of interest that stayed within the tumour margins in all the images of the PCT scan, the patient was excluded from the study.
Figure 2.
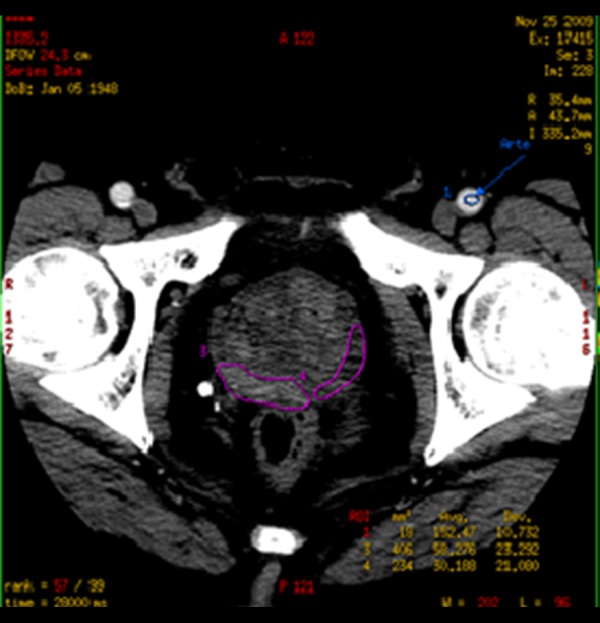
Region of interest (ROI) shown on a prostate perfusion CT image.
Functional maps of BF, BV, MTT, and PS were generated according to the deconvolution model, described in previous literature [16].
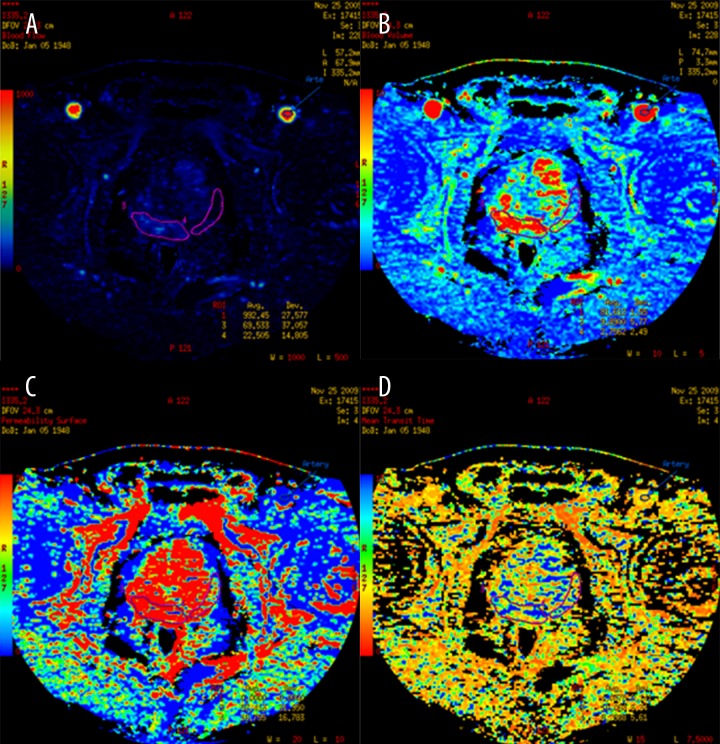
Tumor perfusion parameters were averaged over all sections of the ROIs drawn for each tumor and for normal gland. For display purposes, the functional maps were presented using a color scale with: pixel values of BF measured in ml/100 g wet tissue per min; BV in ml/100 g of wet tissue; MTT in s; and PS in ml per 100 g of wet tissue (Figure 3). The PCT evaluation was performed by 2 local radiology consultants with 10 years’ experience in CT oncology imaging (EL and STD) and then reviewed by experts in the PCT field.
Figure 3.
Functional maps of CT perfusion parameters: (A) Blood flow, (B) Blood volume, (C) Permeability surface, (D) Mean transit time for prostate cancer and the surrounding normal tissue.
Statistical analysis
Statistical analysis was performed with dedicated software (STATISTICA ver.. 9). The correlation between separated perfusion parameter values with PSA levels was also analyzed. The correlation between values of perfusion parameters, Gleason score, and pathological classification of PCa were examined using ANOVA, and Duncan’s test and the t-test were used for individual mean values. The Spearman rank order correlations were determined and its significance was studied using the t-test. A statistical significance level of p≤0.05 was accepted.
Results
Study population
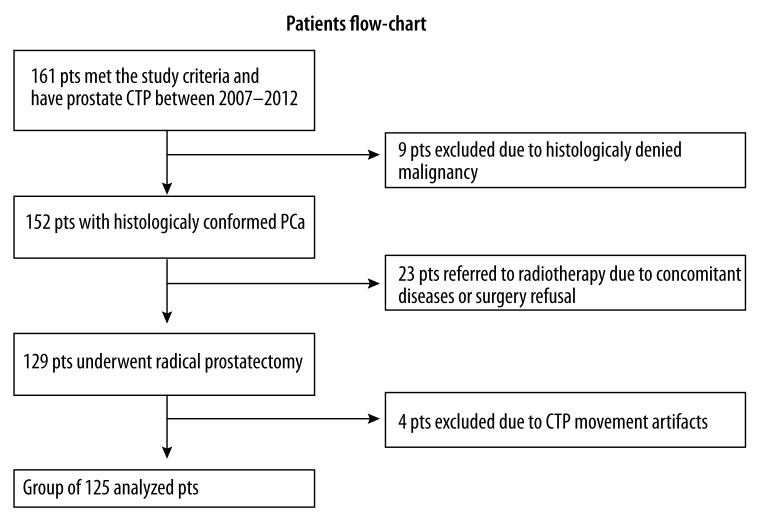
Between 2007 and 2012, abdominal and pelvic CT and prostate gland perfusion CT were performed in 161 patients who were eligible for the study protocol and signed informed consent. A total of 125 patients with PCa (median age, 64 years; range, 49–77) met the selection criteria and were enrolled in Study number 2 in the years 2007–2012 (Figure 4). The characteristics of the study population with confirmed PCa are shown in Table 1 [17].
Figure 4.
Flowchart of patients enrolled in the CTP study.
Table 1.
Baseline characteristics of 119 PCa patients diagnosed with PCT.
| Characteristics | n | % |
|---|---|---|
| Age (years) | ||
| ≤65 yrs | 73 | 61.3 |
| 65–70 yrs | 30 | 25.3 |
| 70–75 yrs | 15 | 12.6 |
| >75 | 1 | 0.8 |
|
| ||
| Initial PSA (ng/mL) | ||
| 4–10 | 76 | 63.9 |
| 10–20 | 37 | 31.1 |
| >20 | 6 | 5.0 |
|
| ||
| NCCN risk group (17) | ||
| Low | 19 | 15.9 |
| Intermediate | 91 | 76.5 |
| High | 9 | 7.6 |
|
| ||
| pT stage | ||
| T2 | 79 | 66.4 |
| T3 | 40 | 33.6 |
|
| ||
| pN stage | ||
| N0 | 114 | 95.8 |
| N1 | 5 | 4.2 |
|
| ||
| pTNM | ||
| I | 3 | 2.5 |
| IIA | 12 | 10.1 |
| IIB | 64 | 53.8 |
| III | 40 | 33.6 |
|
| ||
| Gleason score | ||
| ≤5 | 12 | 10.1 |
| 6 | 57 | 47.9 |
| 7 | 42 | 35.3 |
| 8–10 | 8 | 6.7 |
|
| ||
| Histological grade (acc. to Gleason score) | ||
| Low | 69 | 58.0 |
| Intermediate | 42 | 35.3 |
| High | 8 | 6.7 |
|
| ||
| Total | 119 | 100.0 |
Perfusion and PSA
Typical contrast enhancement of malignant lesions was visible in 119 out of the 125 patients (sensitivity 95.2%). A statistically significant correlation between BV, MTT, and PS values and PSA level was found: correlation coefficients (r) were equal to 0.18 ml/100 g, 0.2 s and 0.24 ml/min/100 g (p≤0.05), respectively (Table 2). These findings suggest that with an increase of PSA values, an increase of BV, MTT, and PS can be expected (Figure 5). No statistical significance of BF value was found.
Table 2.
Correlation between perfusion parameters and PSA.
| BV (ml/100 mg) | BF (ml/min/100 g) | PS (ml/min/100 g) | ||||
|---|---|---|---|---|---|---|
| r | p value | r | p value | r | p value | |
| PSA | 0.18 | 0.04 | 0.20 | 0.03 | 0.24 | 0.01 |
Figure 5.
Correlation between PSA level in prostate cancer and CTP parameters: blood volume (BV) (A), blood flow (BF) (B), and permeability surface (PS) (C). Red dashed line shows 95% confidence interval.
Perfusion and Gleason score
Mean values of perfusion parameters in malignant tissue were: BV 5.08±0.2 mL/100 g, BF 43.79±1.15 mL/min/100 g, MTT 8.24±0.15 s, and PS 31.47±1.2 mL/min/100 g. The mean values and range interval of perfusion parameters based on histological malignancy category of the tumors are presented in Table 3.
Table 3.
Mean values and range interval of perfusion parameters based on histological malignancy.
| Degree of histological malignancy (acc. to Gleason score) | BV (ml/100 g) | BF (ml/min/100 g) | MTT (s) | PS (ml/min/100 g) |
|---|---|---|---|---|
| Well differentiated (GS ≤6), n=69 | ||||
| Mean ±SE | 4.85±0.22 | 42.42±1.45 | 8.17±0.22 | 29.76±1.59 |
| Min | 1.88 | 17.01 | 5.11 | 5.49 |
| Max | 12.76 | 72.95 | 14.56 | 69.38 |
|
| ||||
| Moderately differentiated (GS=7), n=42 | ||||
| Mean ±SE | 5.22±0.22 | 44.21±1.73 | 8.34±0.22 | 32.72±1.59 |
| Min | 2.42 | 28.24 | 6.09 | 10.55 |
| Max | 19.62 | 73.85 | 12.65 | 68.43 |
|
| ||||
| Poorly differentiated (GS≥8), n=8 | ||||
| Mean ±SE | 6.37±1.13 | 53.36±6.74 | 8.32±0.41 | 39.77±4.86 |
| Min | 4.22 | 42.32 | 6.87 | 24.05 |
| Max | 14.00 | 98.74 | 10.20 | 64.69 |
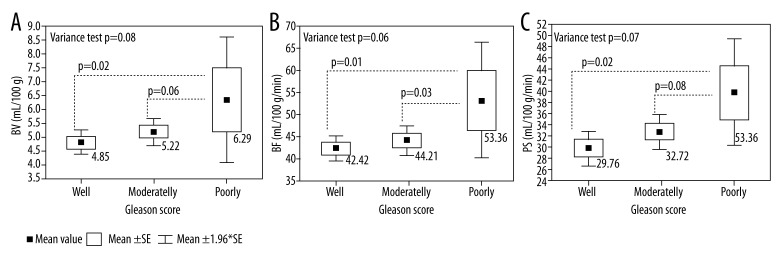
Figure 6 illustrates differences between mean perfusion values (BV, BF, and PS) for poorly, moderately, and well-differentiated tumors according to Gleason score. A statistically significant difference (p=0.02) was observed between BV values in well-differentiated tumors (4.85 ml/100 g) compared to poorly differentiated (6.37 ml/100 g) tumors. Similar results were obtained for BF and PS measurements. Mean value of BF increased from 42.42 ml/min/100 g in well-differentiated tumors to 53.36 ml/min/100 g in poorly differentiated tumors (p=0.01), whereas mean value of PS increased from 29.76 ml/min/100 g for well-differentiated tumors to 39.77 ml/min/100 g for poorly differentiated tumors and the difference between those values was also significant (p=0.02). Mean values of BV, BF, and PS were higher in poorly than in moderately differentiated tumors, but statistical significance was achieved only for BF values (p=0.03).
Figure 6.
Distribution of mean perfusion values – blood volume (BV) (A), blood flow (BF) (B), and permeability surface (PS (C) – depending on aggressiveness of the tumor.
Perfusion and pTNM stage of PCa
On the basis of variance analysis we found statistical correlation between mean perfusion values BV, MTT, PS and cancer stage, according to pTNM classification (p<0.03) (Table 4).
Table 4.
Mean values of evaluated perfusion parameters in stage IIA, IIB, and stage III cancers.
| Clinical stage | Parameter | |||
|---|---|---|---|---|
|
| ||||
| BV (ml/100 mg) | BF (ml/min/100 g) | MTT (s) | PS (Ml/min/100 g) | |
| IIA (n=12) | ||||
| Mean ±SE | 5.84±0.73 | 46.36±3.22 | 8.92±0.63 | 33.14±4.95 |
| Min | 3.45 | 23.79 | 6.81 | 9.09 |
| Max | 12.76 | 59.08 | 14.56 | 68.43 |
|
| ||||
| IIB (n=64) | ||||
| Mean ±SE | 4.62±0.17 | 41.70±1.42 | 7.93±0.20 | 28.89±1.47 |
| Min | 1.88 | 17.01 | 5.11 | 5.49 |
| Max | 8.83 | 69.78 | 14.09 | 60.14 |
|
| ||||
| III (n=40) | ||||
| Mean ±SE | 5.67±0.34 | 46.63±2.28 | 8.62±0.22 | 35.45±1.79 |
| Min | 2.42 | 28.24 | 6.03 | 18.87 |
| Max | 14.00 | 98.74 | 11.77 | 69.38 |
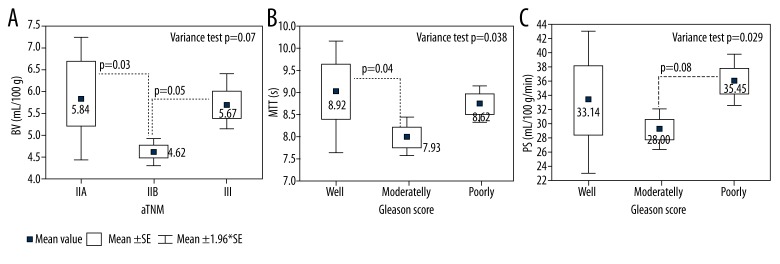
The analysis of individual tests comparing various averages revealed a significant difference between mean values of perfusion parameters (BV, MTT, and PS) for category IIB and other stages (Figure 7). We analyzed whether mean values of all the parameters were higher in stage III than in IIB. Mean value of BV in stage IIB (41.70 ml/100 g) was lower than in stage III (46.63 ml/100 g) (p=0.002). Additionally, mean value of BV in stage III (5.67 ml/100 g) was higher than in stage IIB (4.62 ml/100 g) (p=0.028). Similarly, MTT and PS were significantly higher in stage III than in IIB (p=0.014 and 0.003, respectively). Mean MTT ranged from 8.62 s to 7.93 s and PS from 35.45 ml/min/100 g to 28.89 ml/min/100 g in class III and IIB, respectively (Table 4). To conclude, perfusion values are higher in higher cancer stages according to AJCC.
Figure 7.
Distribution of mean perfusion values – blood volume (A), mean contrast agent transit time (B), and permeability surface in the studied area of tumor (C) – depending on pTNM stage.
Discussion
The aim of our study was to assess the correlation between CT perfusion parameters and PSA levels, Gleason score, pTNM, and AJCC stage in 125 patients with PCa. To the best of our knowledge, this is the largest published series of PCa patients examined with PCT. Results of our analysis confirm high sensitivity of the method in visualization of malignant tissue in the peripheral prostate zone (Luczynska et al.). Perfusion CT is a valuable method for diagnosis of prostate cancer (see our previous prospective study in 94 patients, research grant no. NN403240837 of the Polish Ministry of Science and Higher Education, submitted for publication), which suggests that PCT parameters correlate with PSA values, Gleason score, and pTNM stage and can be useful for initial tumor staging and the definition of tumor aggressiveness. A significant correlation between BV, BF, and PS values and PSA level was found, as well as a significant difference between BV, BF, and PS in poorly and moderately differentiated tumors in comparison with highly differentiated PCa (p<0.08). The analysis also revealed a correlation between mean perfusion values BV, MTT, and PS and pTNM cancer stage (p<0.04). All perfusion parameters were higher in stage III than in stage IIB tumors.
Digital rectal examinations, PSA levels with associated parameters (PSA density, PSA adjusted to age, excess PSA, and free-PSA transitional zone), and color Doppler TRUS-guided biopsies are the main diagnostic tools for evaluation of men at risk for carcinoma of the prostate. Many patients have elevated PSA level despite negative findings on biopsy. TRUS-guided biopsy is the best technique for detecting cancer in patients with elevated PSA or a positive digital rectal examination, but this procedure has some limitations (3). Only 20–40% of repeated biopsies are associated with positive findings in men with persistently elevated PSA serum levels [18].
MRI plays an important role in the diagnostic process of PCa. The method provides the best depiction of the contours of the prostate as well as its internal zonal anatomy. Morphologic techniques are based on T1- and T2-weighted images. MRI also allows functional assessment with techniques such as diffusion-weighted MRI (DWI), MR spectroscopy, and dynamic contrast-enhanced MRI (DCE-MRI) [19,20]. Although MRI currently seems to be the most valuable method of PCa imaging, it is necessary to keep in mind contraindications to this test as well as limitations in access to MRI devices in low-income countries. Therefore, other imaging methods, like PCT, should be considered in PCa imaging.
The development of PCa is a multi-step process, advancing consecutively from high-grade prostatic intraepithelial neoplasia (PIN) to focal carcinoma, invasive carcinoma, and finally to metastatic disease. It is therefore important to target the molecular events that accompany the progression of each step [4]. We were able to evaluate PCa angiogenesis with the latest multidetector tomography and acquisition of high-quality, color-coded perfusion maps, which correspond with the classic tomography imaging.
With the development of new multidetector CT scanners, quantitative CT imaging of angiogenesis has become possible over larger volumes of tissue [21]. Various algorithms have been developed to quantify perfusion based on contrast-enhanced CT imaging [22]. PCa, like other solid tumors, is also angiogenesis-dependent. Therefore, angiogenesis within soft-tissue neoplasms is related to contrast enhancement on CT [5,23,24]. Initial reports show that functional imaging in CT, such as PCT, is important for PCa staging before radical therapy. PCT makes it possible to reveal excessive pathological vessel density within the prostate gland due to the increase of BV and BF values and also because pathological increase of blood vessel permeability (PS) MTT is shortened, which confirms vascular abnormality in the area [25].
We previously proved the high sensitivity of PCT in visualization of PCa and confirmed this in the current study [26]. Correlations between PCT parameters and clinico-pathological findings also remains in accordance with previous published reports; for example, Prando et al. state that CT of the prostate may be useful in the following selected groups: patients with a rising PSA level and negative biopsies; patients with elevating PSA level after radical prostatectomy (suspicion of recurrence); and patients with routine helical CT pelvic examinations during which abnormal focal contrast enhancement in the peripheral zone is observed [27]. The correlation between serum PSA level and perfusion parameters was also described elsewhere [28].
In the present series, the difference between mean perfusion parameters in patients with low and high Gleason scores is clear. Ives et al. demonstrated that the positive correlation between PCT and malignancy was strongest in patients with high Gleason scores (≥8) [29]. Our findings suggest that quantitative perfusion measurements based on CT correlate with tumor values and may be useful in poorly differentiated tumors.
According to the analyzed material, perfusion values are correlated with PCa grade in clinical stage of PCa. Clinical stage of PCa division is based on 3 values: pTNM, PSA, and Gleason score [18,30]. Our findings suggest that higher TNM, PSA, and Gleason score are associated with higher perfusion parameters (BV, PS, and MTT).
PCa is not a well-vascularized tumor. It has been demonstrated, however, that pathological vessel density is significantly increased compared with normal prostate gland tissue [31].
Maximal vascular density was observed in poorly differentiated PCa; moreover, reports show that pathological density of vessels within PCa is one of the factors that can determine whether the neoplastic process is confined to the gland or extends beyond its “capsule”. It was previously determined that pathological vessel density is greater in patients with neoplastic process extending beyond the prostate gland [32]. However, no published data are available on the correlation between pTNM stage and PCT parameters in PCa. Consequently, our findings are also unclear, because PCT parameters were higher in stage III tumors than in stage IIB, but not higher than in IIA tumors, because of the relatively small number of IIA tumors.
Bostwick et al. also report the significance of blood vessel density within the tumor (in case of cancer confined to the gland) for PCa staging [33]. For example, in calculating the probability of cancer infiltration beyond the gland for a patient with PSA serum level 8 ng/ml, Gleason score after core needle biopsy and high vessel density in histopathological examination is about 93%.
We are aware of limitations of our study. These are the lack of a control group, which did not allow calculating the specificity of the method, and poor visibility of the anatomy of the prostatic capsule with conventional CT or additional exposure of patients to radiation, which, in our study was equal to 16.15 mSv. The dose is higher than that from a conventional CT scan but seems acceptable for whole-body examination [26].
Conclusions
In conclusion, our study confirms previous findings of the high sensitivity of PCT for differentiation of PCa from normal prostate tissue, and suggests that PCT parameters correlate with PSA values, Gleason score, and pTNM stage and can be useful for initial tumour staging. A significant correlation between BV, BF, and PS values and PSA level was found, as well as the trend for difference between BV, BF, and PS in poorly and moderately differentiated tumors in comparison with highly differentiated ones. The analysis also revealed a correlation between mean perfusion values (BV, MTT, and PS) and pTNM cancer stage. Our results may impact daily clinical practice, particularly for pretreatment staging of PCa in situations when routine access to MRI is not available.
Footnotes
Source of support: Departmental sources
References
- 1.Turkbey B, Albert PS, Kurdziel K, Choyke PL. Imaging localized prostate cancer: current approaches and new developments. Am J Roentgenol. 2009;192(6):1471–80. doi: 10.2214/AJR.09.2527. [DOI] [PMC free article] [PubMed] [Google Scholar]
- 2.Andriole GL, Levin DL, Crawford ED, et al. Prostate Cancer Screening in the Prostate, Lung, Colorectal and Ovarian (PLCO) Cancer Screening Trial: findings from the initial screening round of a randomized trial. J Natil Cancer Inst. 2005;97(6):433–38. doi: 10.1093/jnci/dji065. [DOI] [PubMed] [Google Scholar]
- 3.Applewhite JC, Matlaga BR, McCullough DL, Hall MC. Transrectal Ultrasound and Biopsy in the Early Diagnosis of Prostate Cancer. Cancer Control. 2001;8(2):141–50. doi: 10.1177/107327480100800204. [DOI] [PubMed] [Google Scholar]
- 4.Longoria RL, Cox MC, Figg WD. Antiangiogenesis: a possible treatment option for prostate cancer? Clin Genitourin Cancer. 2005;4(3):197–202. doi: 10.3816/CGC.2005.n.033. [DOI] [PubMed] [Google Scholar]
- 5.Padhani AR, Harvey CJ, Cosgrove DO. Angiogenesis imaging in the management of prostate cancer. Nat Clin Pract Urol. 2005;2(12):596–607. doi: 10.1038/ncpuro0356. [DOI] [PubMed] [Google Scholar]
- 6.Miles KA. Functional computed tomography in oncology. Eur J Cancer. 2002;38(16):2079–84. doi: 10.1016/s0959-8049(02)00386-6. [DOI] [PubMed] [Google Scholar]
- 7.Ma S-H, Le H-B, Jia B, et al. Peripheral pulmonary nodules: Relationship between multi-slice spiral CT perfusion imaging and tumor angiogenesis and VEGF expression. BMC Cancer. BioMed Central. 2008;8(1):186. doi: 10.1186/1471-2407-8-186. [DOI] [PMC free article] [PubMed] [Google Scholar]
- 8.Ippolito D, Sironi S, Pozzi M, et al. Hepatocellular carcinoma in cirrhotic liver disease: functional computed tomography with perfusion imaging in the assessment of tumor vascularization. Acad Radiol. 2011;10(1):919–27. doi: 10.1016/j.acra.2008.02.005. [DOI] [PubMed] [Google Scholar]
- 9.Sabir A, Schor-Bardach R, Wilcox CJ, et al. Perfusion MDCT enables early detection of therapeutic response to antiangiogenic therapy. Am J Roentgenol. 2008;191(1):133–39. doi: 10.2214/AJR.07.2848. [DOI] [PubMed] [Google Scholar]
- 10.Li Z-P, Meng Q-F, Sun C-H, et al. Tumor angiogenesis and dynamic CT in colorectal carcinoma: radiologic-pathologic correlation. World J Gastroenterol. 2005;11(9):1287–91. doi: 10.3748/wjg.v11.i9.1287. [DOI] [PMC free article] [PubMed] [Google Scholar]
- 11.Haider MA, Milosevic M, Fyles A, et al. Assessment of the tumor microenvironment in cervix cancer using dynamic contrast enhanced CT, interstitial fluid pressure and oxygen measurements. Int J Radiat Oncol Biol Phys. 2005;62(4):1100–7. doi: 10.1016/j.ijrobp.2004.12.064. [DOI] [PubMed] [Google Scholar]
- 12.Makari Y, Yasuda T, Doki Y, et al. Correlation between tumor blood flow assessed by perfusion CT and effect of neoadjuvant therapy in advanced esophageal cancers. J Surg Oncol. 2007;96(3):220–29. doi: 10.1002/jso.20820. [DOI] [PubMed] [Google Scholar]
- 13.Edition S. Cancer Staging Manual. In: Greene F, Page D, Fleming I, et al., editors. Cancer. 2010. pp. 20–22. [Google Scholar]
- 14.Gleason DF, Mellinger GT. Prediction of prognosis for prostatic adenocarcinoma by combined histological grading and clinical staging. J Urol. 2002;111(1):58–64. doi: 10.1016/s0022-5347(17)59889-4. [DOI] [PubMed] [Google Scholar]
- 15.Falzarano SM, Magi-Galluzzi C. Prostate cancer staging and grading at radical prostatectomy over time. Adv Anat Pathol. 2011;18(2):159–64. doi: 10.1097/PAP.0b013e31820cb506. [DOI] [PubMed] [Google Scholar]
- 16.Petralia G, Bonello L, Viotti S, et al. CT perfusion in oncology: how to do it. Cancer imaging Off Publ Int Cancer Imaging Soc. 2010;10(1):8–19. doi: 10.1102/1470-7330.2010.0001. [DOI] [PMC free article] [PubMed] [Google Scholar]
- 17.National Comprehensive Cancer Network guidelines, version 4.2013 [Internet] Available from: http://www.nccn.org/professionals/physician_gls/pdf/prostate.pdf.
- 18.Spencer JA, Chng WJ, Hudson E, et al. Prostate specific antigen level and Gleason score in predicting the stage of newly diagnosed prostate cancer. Br J Radiol. 1998;71(851):1130–35. doi: 10.1259/bjr.71.851.10434906. [DOI] [PubMed] [Google Scholar]
- 19.Gupta RT, Kauffman CR, Polascik TJ, et al. The state of prostate MRI in 2013. Oncology (Willist Park) 2013;27(4):262–70. [PubMed] [Google Scholar]
- 20.Schlemmer H-P, Merkle J, Grobholz R, et al. Can pre-operative contrast-enhanced dynamic MR imaging for prostate cancer predict microvessel density in prostatectomy specimens? Eur Radiol. 2004;14(2):309–17. doi: 10.1007/s00330-003-2025-2. [DOI] [PubMed] [Google Scholar]
- 21.Lee T-Y, Purdie TG, Stewart E. CT imaging of angiogenesis. Q J Nucl Med. 2003;47(3):171–87. [PubMed] [Google Scholar]
- 22.Miles KA. Perfusion CT for the assessment of tumour vascularity: which protocol? Br J Radiol. 2003;76(Spec No(Suppl_1)):S36–S42. doi: 10.1259/bjr/18486642. [DOI] [PubMed] [Google Scholar]
- 23.Miles KA. Tumour angiogenesis and its relation to contrast enhancement on computed tomography: a review. Eur J Radiol. 1999;30(3):198–205. doi: 10.1016/s0720-048x(99)00012-1. [DOI] [PubMed] [Google Scholar]
- 24.Shankar JJS, Woulfe J, Da Silva V, Nguyen TB. Evaluation of perfusion CT in grading and prognostication of high-grade gliomas at diagnosis: a pilot study. Am J Roentgenol. 2013;200(5):W504–9. doi: 10.2214/AJR.12.8967. [DOI] [PubMed] [Google Scholar]
- 25.Bellomi M, Viotti S, Preda L, et al. Perfusion CT in solid body-tumours. Part II: Clinical applications and future development. Radiol Med. 2010;115(6):858–74. doi: 10.1007/s11547-010-0545-9. [DOI] [PubMed] [Google Scholar]
- 26.Osimani M, Bellini D, Di Cristofano C, et al. Perfusion MDCT of prostate cancer: correlation of perfusion CT parameters and immunohistochemical markers of angiogenesis. Am J Roentgenol. 2012;199(5):1042–48. doi: 10.2214/AJR.11.8267. [DOI] [PubMed] [Google Scholar]
- 27.Prando A, Wallace S. Helical CT of Prostate Cancer: Early Clinical Experience. Am J Roentgenol. 2000;175(2):343–46. doi: 10.2214/ajr.175.2.1750343. [DOI] [PubMed] [Google Scholar]
- 28.Łuczyńska E, Anioł J, Stelmach A, Jaszczyński J. The value of perfusion CT in evaluating locoregional staging in post-radical prostatectomy patients with elevated serum PSA level. Pol J Radiol. 2008;73(2):13–17. [Google Scholar]
- 29.Ives EP, Burke MA, Edmonds PR, et al. Quantitative computed tomography perfusion of prostate cancer: correlation with whole-mount pathology. Clin Prostate Cancer. 2005;4(2):109–12. doi: 10.3816/cgc.2005.n.018. [DOI] [PubMed] [Google Scholar]
- 30.Verma S, Rajesh A. A clinically relevant approach to imaging prostate cancer: self-assessment module. Am J Roentgenol. 2011;196(3 Suppl):S11–S14. doi: 10.2214/AJR.10.7295. [DOI] [PubMed] [Google Scholar]
- 31.Miles KA, Charnsangavej C, Lee FT, et al. Application of CT in the investigation of angiogenesis in oncology. Acad Radiol. 2000;7(10):840–50. doi: 10.1016/s1076-6332(00)80632-7. [DOI] [PubMed] [Google Scholar]
- 32.Strohmeyer D, Rössing C, Strauss F, et al. Tumor angiogenesis is associated with progression after radical prostatectomy in pT2/pT3 prostate cancer. Prostate. 2000;42(1):26–33. doi: 10.1002/(sici)1097-0045(20000101)42:1<26::aid-pros4>3.0.co;2-6. [DOI] [PubMed] [Google Scholar]
- 33.Bostwick DG, Wheeler TM, Blute M, et al. Optimized microvessel density analysis improves prediction of cancer stage from prostate needle biopsies. Urology. 1996;48(1):47–57. doi: 10.1016/s0090-4295(96)00149-5. [DOI] [PubMed] [Google Scholar]


