

Abstract
Accumulating evidence indicates that polymorphisms in the CRP gene are important in the development of cancer. The current meta-analysis was performed to investigate the association between CRP polymorphisms 3407 A>G (rs2808630) and 29 A>T (rs1417938), and the risk of developing cancer. A search of the relevant literature was conducted using the PubMed database to identify eligible studies published up until March 25, 2014. Five case-control studies involving 888 cases and 3,167 controls for the 3407 A>G polymorphism, and six case-control studies involving 3,110 cases and 5,951 controls for the 29 A>T polymorphism were included in the current meta-analysis. The pooled odds ratios with 95% confidence intervals were calculated using the fixed- or random-effects model. Meta-analysis identified no association between the CRP 3407 A>G and 29 A>T polymorphisms, and overall cancer risk. Additional stratified analysis by cancer type did not reveal any significant associations in the genetic models investigated. The findings of the present study indicated that CRP 3407 A>G and 29 A>T polymorphisms are not associated with cancer risk.
Keywords: C-reactive protein, polymorphism, cancer, meta-analysis
Introduction
Chronic inflammation is important in the development of cancer at a number of sites in the body (1). C-reactive protein (CRP) belongs to the family of acute-phase proteins and, as a general marker for inflammation, is synthesized in hepatocytes. A major role of CRP is to bind phosphocholine, thereby permitting the recognition of foreign pathogens and the phospholipid constituents of damaged cells; thus, CRP is vital in host defense and the clearance of necrotic and apoptotic cells (2).
The CRP gene is located on chromosome 1q21-q23, and transcription is predominantly stimulated by interleukin (IL)-6 and IL-1β, which are produced in various cell types, including inflammatory cells (such as T cells and macrophages), endothelial cells, fibroblasts and esophageal cancer cells (3). In cancer patients, plasma CRP levels are typically high compared with healthy subjects (4).
Single nucleotide polymorphisms (SNPs) are the most common type of variation in the human genome and may influence disease susceptibility by affecting sequence coding and splicing (5). Previous studies have investigated the association between CRP 3407A>G and 29A>T polymorphisms, and cancer risk (6–10). However, association data determined from these independent studies is relatively powerless; therefore, the present study conducted a meta-analysis of all eligible published studies, and the effect of CRP 3407 A>G and 29 A>T polymorphisms on cancer risk was evaluated.
Materials and methods
Publication search
The PubMed database (http://www.ncbi.nlm.nih.gov/pubmed) was searched for relevant articles published prior to March 25, 2014. The following keywords were used: C-reactive protein or CRP, polymorphism and cancer. Additional studies were identified by conducting a manual search of the reference lists of reviews and the retrieved studies.
Inclusion and exclusion criteria
All of the included studies met the following criteria: i) The association between CRP 3407 A>G and 29 A>T polymorphisms, and cancer risk were evaluated; ii) the studies were case-control; and iii) the number of individual genotypes for CRP 3407 A>G and 29 A>T polymorphisms in cancer cases and controls, respectively, were stated. In addition, the exclusion criteria included: i) Original or insufficient data regarding the individual genotypes for CRP 3407A>G and 29A>T polymorphisms in cancer cases and controls; ii) review articles and case studies focused on the prognosis associated with genetic polymorphism and iii) duplicated publications.
Data extraction
Two independent researchers systematically extracted the relevant data from all of the studies that met the inclusion criteria using a standardized form. The following information was collected: First author’s name, publication year, country, ethnicity, cancer type and total number of genotyped cases and controls. If the study reported more than one ethnicity, the population was termed mixed.
Statistical analysis
Crude odds ratios (ORs) and their corresponding 95% confidence intervals (CIs) were used to assess the strength of association between the CRP 3407 A>G and 29 A>T polymorphisms, and the risk of developing cancer. The pooled ORs were determined for recessive (GG vs. GA + AA; TT vs. TA + AA), dominant (GG + GA vs. AA; TA+TT vs. AA), co-dominant [(GG vs. AA; GA vs. AA), (TT vs. AA; TA vs. AA)] and additive (G vs. A; T vs. A) models. Furthermore, between-study heterogeneity was assessed by calculating the Q-statistic using the χ2 test and Ph<0.05 was considered to indicate statistically significant heterogeneity. If the results were heterogeneous, the pooled ORs were calculated using the random-effect model; if the results were not heterogeneous, a fixed-effect model was used. In addition, a Begg’s funnel plot was constructed to examine any potential publication bias, and sensitivity analysis was performed to estimate the influence of excluding each individual study on the summary OR values. All statistical data were analyzed using Stata software (version 12.0; StataCorp LP, College Station, TX, USA).
Results
Study characteristics and quantitative synthesis
A flow chart of the study selection process is indicated in Fig. 1. A total of 52 studies regarding CRP polymorphisms with respect to cancer were identified; however, following a review of the titles, abstracts and articles, the inclusion and exclusion criteria identified five 3407 A>G polymorphism studies involving 888 cases and 3,167 controls, and six 29A>T polymorphism studies involving 3,110 cases and 5,951 controls for inclusion in the present meta-analysis (Table I).
Figure 1.

Flow chart of the study selection.
Table I.
Characteristics of eligible studies investigated in the present meta-analysis.
| A, rs2808630 (3407A>G) polymorphism | ||||||||||
|---|---|---|---|---|---|---|---|---|---|---|
|
| ||||||||||
| Case | Control | |||||||||
|
|
|
|||||||||
| Reference | Year | Country | Ethnicity | Cancer type | AA | AG | GG | AA | AG | GG |
| Pierce et al (6) | 2009 | USA | Caucasian | Prostate | 89 | 73 | 13 | 1026 | 760 | 148 |
| Pierce et al (6) | 2009 | USA | African | Prostate | 24 | 16 | 0 | 184 | 107 | 9 |
| Tsilidis et al (7) | 2009 | USA | Caucasian | Colorectal | 96 | 84 | 19 | 204 | 124 | 34 |
| Chaturvedi et al (8) | 2010 | USA | Mixed | Lung | 206 | 153 | 19 | 242 | 172 | 33 |
| Xu et al (9) | 2012 | China | Asian | Lung | 52 | 38 | 6 | 65 | 51 | 8 |
|
| ||||||||||
| B, rs1417938 (29A>T) polymorphism | ||||||||||
|
| ||||||||||
| Case | Control | |||||||||
|
|
|
|||||||||
| Reference | Year | Country | Ethnicity | Cancer type | AA | AT | TT | AA | AT | TT |
|
| ||||||||||
| Pierce et al (6) | 2009 | USA | Caucasian | Prostate | 83 | 69 | 23 | 921 | 830 | 183 |
| Pierce et al (6) | 2009 | USA | African | Prostate | 31 | 8 | 1 | 230 | 66 | 4 |
| Tsilidis et al (7) | 2009 | USA | Caucasian | Colorectal | 15 | 74 | 109 | 43 | 140 | 177 |
| Chaturvedi et al (8) | 2010 | USA | Mixed | Lung | 186 | 149 | 42 | 221 | 177 | 49 |
| Slattery (10) | 2011 | USA | Mixed | Colorectal | 186 | 918 | 1120 | 238 | 1175 | 1373 |
| Xu (9) | 2012 | China | Asian | Lung | 49 | 38 | 9 | 59 | 50 | 15 |
Evaluation of the association between CRP 3407 A>G and 29 A>T polymorphisms and cancer risk are indicated in Fig. 2 and Table II. Overall, when all of the eligible studies were pooled, no significant associations were observed between the CRP 3407 A>G polymorphism and overall cancer risk [GG vs. GA+AA, (OR, 0.86; 95% CI, 0.62–1.19; Ph=0.81); GG+GA vs. AA, (OR, 1.09; 95% CI, 0.93–1.28; Ph=0.61); GG vs. AA, (OR, 0.91; 95% CI, 0.65–1.27; Ph=0.71); GA vs. AA, (OR, 1.13; 95% CI, 0.95–1.34; Ph=0.66); and G vs. A, (OR, 1.03; 95% CI, 0.90–1.17; Ph=0.63)] or the 29 A>T polymorphism and overall cancer risk [TT vs. TA+AA, (OR, 1.07; 95% CI, 0.97–1.18; Ph=0.60; TA+TT vs. AA, OR, 1.03; 95% CI, 0.90–1.17; Ph=0.74); TT vs. AA, (OR, 1.11; 95% CI, 0.94–1.31; Ph=0.49); TA vs. AA, (OR. 1.00; 95% CI, 0.87–1.15; Ph=0.86); and T vs. A, (OR, 1.04; 95% CI, 0.97–1.12; Ph=0.64)]. In the subgroup analysis by cancer type, the results also indicated that CRP 3407 A>G and 29 A>T polymorphisms were not associated with prostate, lung and colorectal cancer.
Figure 2.
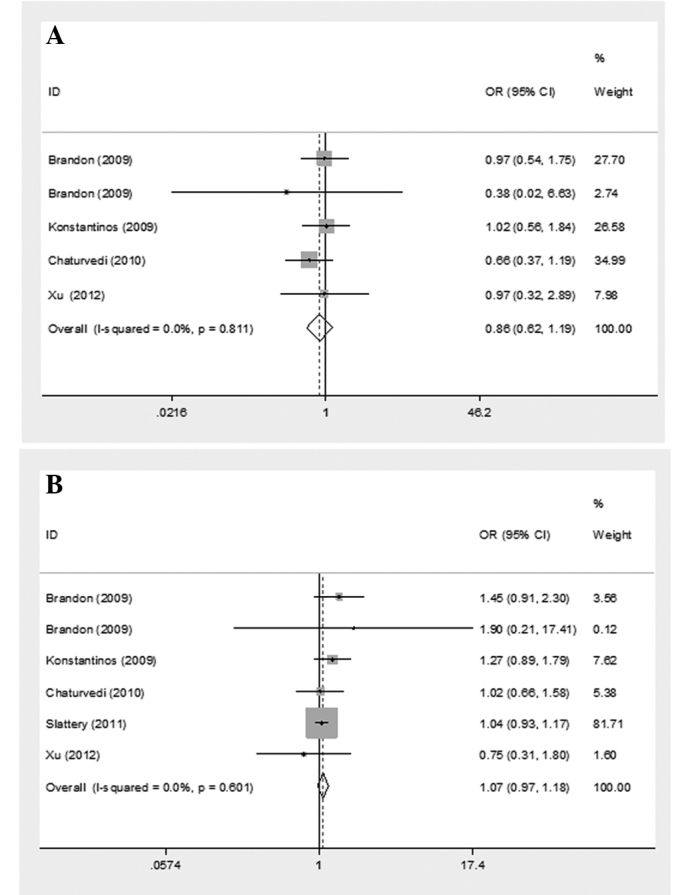
Forest plot describing the meta-analysis using the recessive model to determine the association between the CRP (A) 3407 A>G (GG vs. GA+AA) and (B) 29 A>T (TT vs. TA+AA) polymorphisms and the risk of developing cancer. ID, identification; OR, odds ratio; CI, confidence interval.
Table II.
Meta-analysis of the associations between the CRP gene polymorphisms and cancer risk in all of the possible genetic models.
| A, rs2808630 (3407 A>G) polymorphism | ||||||||||
|---|---|---|---|---|---|---|---|---|---|---|
|
| ||||||||||
| GG vs. GA+AA | GG+GA vs. AA | GG vs. AA | GA vs. AA | G vs. A | ||||||
|
|
|
|
|
|
||||||
| Cancer type | OR (95% CI) | Ph-value | OR (95% CI) | Ph-value | OR (95% CI) | Ph-value | OR (95% CI) | Ph-value | OR (95% CI) | Ph-value |
| Prostate | 0.92 (0.51–1.63) | 0.53 | 1.09 (0.82–1.44) | 0.93 | 0.96 (0.53–1.73) | 0.53 | 1.11 (0.83–1.49) | 0.93 | 1.03 (0.83–1.29) | 0.76 |
| Colorectal | 0.72 (0.43–1.20) | 0.55 | 0.97 (0.76–1.24) | 0.86 | 0.73 (0.43–1.23) | 0.61 | 1.02 (0.79–1.32) | 0.72 | 0.94 (0.77–1.14) | 0.93 |
| Lung | 1.02 (0.56–1.84) | 1.39 (0.98–1.96) | 1.19 (0.64–2.19) | 1.44 (1.00–2.08) | 1.22 (0.94–1.60) | |||||
| Total | 0.86 (0.62–1.19) | 0.81 | 1.09 (0.93–1.28) | 0.61 | 0.91 (0.65–1.27) | 0.71 | 1.13 (0.95–1.34) | 0.66 | 1.03 (0.90–1.17) | 0.63 |
|
| ||||||||||
| B, rs1417938 (29 A>T) polymorphism | ||||||||||
|
| ||||||||||
| TT vs. TA+AA | TA+TT vs. AA | TT vs. AA | TA vs. AA | T vs. A | ||||||
|
|
|
|
|
|
||||||
| Cancer type | OR (95% CI) | Ph-value | OR (95% CI) | Ph-value | OR (95% CI) | Ph-value | OR (95% CI) | Ph-value | OR (95% CI) | Ph-value |
|
| ||||||||||
| Prostate | 1.46 (0.93–2.30) | 0.82 | 1.00 (0.75–1.33) | 0.90 | 1.41 (0.88–2.27) | 0.81 | 0.92 (0.68–1.25) | 0.96 | 1.09 (0.87–1.35) | 0.85 |
| Colorectal | 1.06 (0.96–1.18) | 0.30 | 1.08 (0.89–1.30) | 0.15 | 1.10 (0.91–1.34) | 0.12 | 1.04 (0.85–1.27) | 0.23 | 1.05 (0.97–1.14) | 0.13 |
| Lung | 0.96 (0.65–1.41) | 0.54 | 0.97 (0.76–1.24) | 0.64 | 0.95 (0.63–1.43) | 0.51 | 0.98 (0.76–1.27) | 0.79 | 0.98 (0.81–1.18) | 0.52 |
| Total | 1.07 (0.97–1.18) | 0.60 | 1.03 (0.90–1.17) | 0.74 | 1.11 (0.94–1.31) | 0.49 | 1.00 (0.87–1.15) | 0.86 | 1.04 (0.97–1.12) | 0.64 |
Ph represents the difference in heterogeneity within each polymorphism. OR, odds ratio; CI, confidence interval.
Sensitivity analysis and publication bias
The OR was not statistically different when excluding each individual study by sequence, demonstrating that no individual study significantly affected the pooled OR and clarifying the stability of the results of the present meta-analysis. The shapes of the Begg’s funnel plots, constructed to assess possible publication biases of the included studies, did not reveal any evidence of obvious asymmetry, which indicates a lack of publication bias (Fig. 3).
Figure 3.

Funnel plot describing the meta-analysis of the association between the CRP (A) 3407A>G (GG vs. GA+AA) and (B) 29A>T (TT vs. TA+AA)polymorphisms and the risk of developing cancer.
Discussion
To the best of our knowledge, the present study is the first meta-analysis to comprehensively assess the association between CRP 3407 A>G and 29 A>T polymorphisms and cancer risk. In the present study, no association was identified between CRP 3407 A>G and 29 A>T polymorphisms and the overall cancer risk in all of the genetic models investigated. In the subgroup analysis based on cancer types, no association was identified between these polymorphisms, and prostate, lung and colorectal cancer. These findings indicate that CRP 3407 A>G and 29 A>T polymorphisms may not be risk factors for the development of cancer.
However, a number of limitations should be considered when interpreting the results of the present analysis. Firstly, the present results were based on unadjusted estimates, whereas a more precise analysis may have been conducted if individual data were available. Secondly, the relatively small subpopulation samples may have reduced the statistical power of the analysis; therefore, additional studies with a larger sample size are required to fully understand the association. Thirdly, the present analysis did not consider the possibility of gene-environment interactions, which may have influenced the effect of the polymorphisms on cancer risk.
In conclusion, the present meta-analysis indicates that CRP 3407 A>G and 29 A>T polymorphisms are not associated with cancer risk, particularly in prostate, lung and colorectal cancer.
References
- 1.Coussens LM, Werb Z. Inflammation and cancer. Nature. 2002;420:860–867. doi: 10.1038/nature01322. [DOI] [PMC free article] [PubMed] [Google Scholar]
- 2.Volanakis JE. Human C-reactive protein: expression, structure, and function. Mol Immunol. 2001;38:189–197. doi: 10.1016/S0161-5890(01)00042-6. [DOI] [PubMed] [Google Scholar]
- 3.Kushner I, Jiang SL, Zhang D, Lozanski G, Samols D. Do post-transcriptional mechanisms participate in induction of C-reactive protein and serum amyloid A by IL-6 and IL-1? Ann NY Acad Sci. 1995;762:102–107. doi: 10.1111/j.1749-6632.1995.tb32318.x. [DOI] [PubMed] [Google Scholar]
- 4.Trichopoulos D, Psaltopoulou T, Orfanos P, Trichopoulou A, Boffetta P. Plasma C-reactive protein and risk of cancer: a prospective study from Greece. Cancer Epidemiol Biomarkers Prev. 2006;15:381–384. doi: 10.1158/1055-9965.EPI-05-0626. [DOI] [PubMed] [Google Scholar]
- 5.Gao X, Zhang S, Qiao X, et al. Association of cytotoxic T lymphocyte antigen-4 +49A/G polymorphism and cancer risk: An updated meta-analysis. Cancer Biomark. 2014;14:287–294. doi: 10.3233/CBM-140403. [DOI] [PubMed] [Google Scholar]
- 6.Pierce BL, Biggs ML, DeCambre M, et al. C-reactive protein, interleukin-6, and prostate cancer risk in men aged 65 years and older. Cancer Causes Control. 2009;20:1193–1203. doi: 10.1007/s10552-009-9320-4. [DOI] [PMC free article] [PubMed] [Google Scholar]
- 7.Tsilidis KK, Helzlsouer KJ, Smith MW, et al. Association of common polymorphisms in IL10, and in other genes related to inflammatory response and obesity with colorectal cancer. Cancer Causes Control. 2009;20:1739–1751. doi: 10.1007/s10552-009-9427-7. [DOI] [PMC free article] [PubMed] [Google Scholar]
- 8.Chaturvedi AK, Caporaso NE, Katki HA, et al. C-reactive protein and risk of lung cancer. J Clin Oncol. 2010;28:2719–2726. doi: 10.1200/JCO.2009.27.0454. [DOI] [PMC free article] [PubMed] [Google Scholar]
- 9.Xu M, Zhu M, Du Y, et al. Serum C-reactive protein and risk of lung cancer: a case-control study. Med Oncol. 2013;30:319. doi: 10.1007/s12032-012-0319-4. [DOI] [PubMed] [Google Scholar]
- 10.Slattery ML, Curtin K, Poole EM, et al. Genetic variation in C-reactive protein in relation to colon and rectal cancer risk and survival. Int J Cancer. 2011;128:2726–2734. doi: 10.1002/ijc.25721. [DOI] [PMC free article] [PubMed] [Google Scholar]