

Abstract
We have identified a rare coding mutation, T835M (rs137875858), in the Netrin receptor UNC5C that segregated with disease in an autosomal dominant pattern in two families enriched for late-onset Alzheimer’s disease (LOAD), and was associated with disease across four large case/control cohorts (OR = 2.15, Pmeta= 0.0095). T835M alters a conserved residue in the hinge region of UNC5C, and in vitro studies demonstrate that this mutation leads to increased cell death in several cell types, including neurons. Furthermore, neurons expressing T835M UNC5C are more susceptible to multiple neurodegenerative stimuli, including β-Amyloid (Aβ). Based on these data and the enriched hippocampal expression of UNC5C in the adult nervous system, we propose one possible mechanism in which T835M UNC5C contributes to the risk of Alzheimer’s disease is by increasing susceptibility to neuronal cell death, particularly in vulnerable regions of the Alzheimer’s brain.
While progress has been made in defining the genetic basis of AD, much of the heritability of AD remains to be discovered1–12. A large pedigree in which LOAD appeared to segregate in an autosomal dominant pattern and lacked known early-onset Alzheimer’s disease pathogenic variants was selected for study3,13 (Fig. 1a). Within this family, there were eight LOAD cases including six autopsy confirmed cases, age of onset ranged from 58–85 y (Supplementary Table 1), fifteen unaffected family members, and four individuals of unknown LOAD status. Parametric linkage analysis using a rare dominant model of inheritance was performed, and several regions that segregated with disease in the pedigree were identified, including a broad peak on chromosome 4 (Fig. 1b).
Figure 1. Identification of T835M UNC5C as a candidate variant for LOAD.

(a) A large family with a propensity for developing LOAD was selected for study. Linkage arrays were run on the indicated sixteen individuals with available DNA. An affected individual (indicated by *) was whole genome sequenced and a second case was exome sequenced (indicated by **). (b) Linkage results from the pedigree in (a) using a parametric (rare dominant) model. Five regions segregated with LOAD with a LOD score >1.0. (c) A second pedigree in which T835M segregates with LOAD. Heterozygous carriers of T835M are indicated. (d–f) Additional LOAD enriched pedigrees with at least one member heterozygous for UNC5C T835M (rs137875858). Hollow and filled diamonds indicate healthy family members and those diagnosed with AD respectively. A Taqman assay was used to confirm genotype at T835M (rs137875858) and heterozygous carriers are indicated by “+” and non-carriers a “−”. Individuals with an age at last visit of <70 are shaded in blue.
The DNA from one affected individual (sample III, 1) was whole-genome sequenced (WGS) to develop a catalog of variation (Fig 1a). Filters and exclusion criteria were then applied to identify candidate variants within the pedigree. A total of 3,827,979 variants were detected in the WGS sample. We limited the search interval to the five regions with evidence of linkage within the pedigree (Fig. 1b, regions with LOD score >1.0 provided in Supplementary Table 2). We next applied a series of exclusion criteria to the remaining 98,817 variants (see Supplementary Results), resulting in a total of 141 variants (Supplementary Fig. 1).
The most distantly related affected individual (sample II, 7) to the originally sequenced case was exome sequenced (ES) to further narrow the number of candidate variants (Fig 1a). Four variants were present in both affected individuals (Supplementary Table 3). These four candidate variants included two missense, one synonymous, and a 3′ UTR variant.
Among the two candidate missense variants is rs1063242 that resides in A-kinase anchoring protein 9 (AKAP9, P2979S). Genotyping of rs1063242 in 4,533 LOAD cases and 20,325 controls showed no evidence for enrichment (P=0.54, Supplementary Table 4). The remaining candidate missense allele in UNC5C alters an evolutionarily conserved amino acid in UNC5C (T835M, rs137875858, Supplementary Fig. 2a) and was located in the broad chromosome 4 linkage peak. Genotype of rs137875858 was confirmed within the pedigree by a Taqman assay, and the variant was present in all LOAD cases and in two unaffected carriers (ages 75–81 y). UNC5C is a Netrin receptor, homologous to a protein in C. elegans implicated in Netrin signaling and contributes to axon guidance during development14–16. UNC5C is expressed in neurons in both the developing and adult brain15,16, and the protein contains a “death domain” that has been proposed to influence apoptotic signaling. We therefore advanced the T835M UNC5C variant for validation in additional LOAD pedigrees and case/control populations.
A cohort of 863 unrelated individuals from pedigrees enriched with familial LOAD was screened for the presence of T835M to identify additional pedigrees for segregation analysis3,17. A total of four pedigrees were identified with at least one T835M heterozygous carrier (Fig. 1c–f) and their family members were genotyped for T835M. In one pedigree, the T835M variant completely segregated with disease, (Fig. 1c) and the family showed evidence of linkage to chromosome 4. Two pedigrees were uninformative for linkage analysis, since there was only a single carrier in the pedigree and no informative offspring. In the remaining pedigree, the variant was inherited by three offspring from an unaffected parent but was excluded from the linkage analysis since the three offspring were less than 70 y old. A possible explanation for the variable penetrance in the pedigrees is the influence of genetic background, which has been observed in both animal models and well-described human risk variants, including APOE418,19.
A case-control analysis was performed to test whether T835M UNC5C was enriched in LOAD individuals. The UNC5C variant was genotyped in a total of 8,050 LOAD cases and 98,194 control individuals from four independent datasets (as described in Online Methods). Using a fixed effects model, T835M UNC5C conferred an odds ratio of 2.15 (95% C.I. = 1.21–3.84) with a P value = 0.0095 (Fig. 2), supporting the hypothesis that this allele is present at a low frequency in the European population and confers risk for disease.
Figure 2. Association of T835M UNC5C (rs137875858) in AD case and control cohorts.
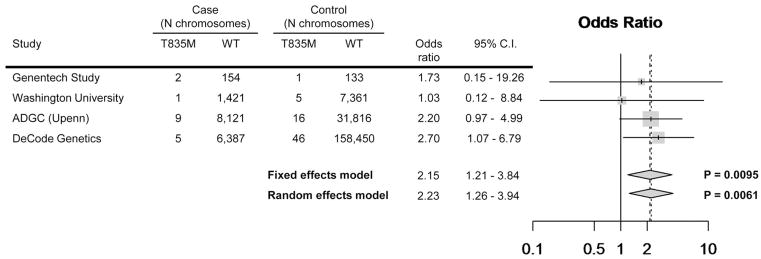
The association of T835M UNC5C (rs137875858) is shown in four independent case and control cohorts totaling 8,050 LOAD cases and 98,194 control individuals. The ADGC cohort includes 12,789 additional controls as described in the supplementary information.
To dissect the cellular function of the T835M UNC5C mutation we investigated protein expression, cellular localization, and cell surface levels by transfecting HEK293T cells. We found little difference between T835M and WT UNC5C, indicating that the T835M mutation is likely not altering protein expression or localization (Supplementary Fig. 3a–c). To next test if the T835M UNC5C mutation may directly alter AD-associated biology20–22, we examined the effect of UNC5C expression on the generation of Aβ and extracellular Tau (eTau). We found that Aβ levels in WT and T835M UNC5C-expressing cells were similar to control, indicating that neither WT nor T835M affects APP cleavage (Supplementary Fig. 3d–f). Additionally, expression of T835M or WT UNC5C led to roughly equivalent increases in eTau levels (Supplementary Fig. 3g, h), which coincided with the presence of additional cytosolic proteins in the conditioned medium (Supplementary Fig. 3i), suggesting that UNC5C expression is likely toxic and inducing cell death.
UNC5 family members may drive cell death through their conserved C-terminal death domain23,24 (Supplementary Fig. 2b). Based on the crystal structure of UNC5B25, a related family member, and on the analogous residue, T835M alters a residue in the “hinge” of the closed conformation of UNC5C, suggesting an affect on the death domain of UNC5C. Since we observed that UNC5C expression led to increased cell death in the eTau experiments, we further explored the cell death phenotype using live-cell imaging. WT and T835M UNC5C expressing cells were longitudinally monitored and growth curves were generated for each group (Fig. 3a, b, Supplementary Fig. 4,). Based on the specific growth calculations, we found that WT growth was reduced by 25% compared to βgal, whereas T835M UNC5C growth was diminished to nearly 50% (Fig. 3a–c, Supplementary Fig. 4,). Furthermore, dose-ranging DNA concentration experiments revealed that WT and T835M UNC5C consistently showed decreased growth compared to βgal, and T835M UNC5C grew less than WT UNC5C for all expression levels (Supplementary Fig. 5a–d). Differences in cell cycle profiles were not detected between WT and T835M-expressing cells (Supplementary Fig. 6). Taken together, these data indicate that T835M either decreased cell growth or increased cell death beyond that of WT UNC5C even at low expression levels.
Figure 3. T835M UNC5C increases cell death beyond that induced by WT UNC5C.

Representative growth curves of (a) GFP+ cells (transfected only) and (b) total cells (transfected and non-transfected) (c) Growth of βgal-, T835M-, or WT-expressing cells. GFP+ specific growth was normalized to total growth, and slopes of the best-fit lines were calculated. Data represents four independent transient transfection experiments with n=6 randomly plated technical replicates per condition for each experiment. ***p=0.007, ** p=0.0011, *p=0.0259. (d) Representative flow cytometry plots of βgal-, WT- and T835M UNC5C-transfected cells analyzed for GFP and AnnexinV-APC; untransfected cell population (orange), GFP+ AnnexinV- cell population (green), and GFP+ AnnexinV+ population (black). (e) Percentage of AnnexinV+ cells within the GFP+ population representing four independent transient transfection experiments with 100,000 cells analyzed per condition. ***p< 0.0001, ** p=0.0014, *p=0.0111. (f) Representative overlay of fluorescent and bright field images from time-lapse imaging experiments; transfected cells (red), caspase-3/7 activity (green); Scale bar = 50 μM (g) Average lifetime of cells expressing βgal (n=919), WT UNC5C (n=687), or T835M UNC5C (n=590) at movie start or that initiated expression during first 20 h of imaging. (h) Kaplan-Meier survival curves of cells expressing βgal (grey, n=1696), WT (blue, n=1085), or T835M UNC5C (red, n=751) analyzed by Wald test for p-values. (g–h) Data represent three independent transient transfection experiments with n=6 randomly plated technical replicates per experiment and 24 movies per genotype, ***p< 0.0001. Data was analyzed with experimenter blinded to samples, represents the mean ± SEM, and was analyzed by two-tailed unpaired t-test.
To address the question of a cell death phenotype, we analyzed AnnexinV, an early apoptotic marker, and caspase activation. We found the percentage of AnnexinV+ cells within the WT expressing population was significantly increased over that of βgal expressing cells, while T835M UNC5C displayed the highest percentage of AnnexinV+ cells (Fig 3d, e, Supplementary Fig. 7a–e). Assaying caspase-3/7 activation in real-time revealed that WT was more likely to undergo apoptosis marked by caspase activity than the βgal control cells, yet T835M UNC5C showed an even higher propensity for cell death (Fig. 3f, Supplementary Fig. 8a, and Supplementary Movies 1a–c, Supplementary Fig. 8b–d). Correspondingly, T835M UNC5C decreased the average cell lifetime and substantially reduced survival compared to WT (Fig. 3g, h, Supplementary Fig. 8b–d). Collectively, these data show that the T835M UNC5C AD-linked variant induces cell death more rapidly and to a higher degree than WT UNC5C in a heterologous cell system.
UNC5C is expressed in the rodent adult nervous system15 (Fig. 4a) and appears to be enriched in neurons of the CA3 hippocampal pyramidal layer (Fig. 4b, c, Supplementary Fig. 9a, b), suggesting that UNC5C may be playing a functional role in these neurons. Moreover, UNC5C expression is present in normal human temporal lobe cortical neurons and neurons of the hippocampal pyramidal layer in control and AD patients (Supplementary Fig. 10a, b). Notably, the hippocampus is one of the first regions to degenerate in AD and is required for many types of learning and memory26–28. Neuroinflammation may also contribute to AD risk, such as implicated by the recently described TREM2 variants1,6. To determine if UNC5C is expressed by microglia in the brain or by peripheral blood mononuclear cells (PBMCs), we profiled UNC5C expression of adult mouse brain and in sub-populations of mouse and human PBMCs (Fig. 4c, d, Supplementary Fig. 9). Unlike TREM2, which is expressed by CD11b+ microglia or monocytes/ macrophages, we found little evidence that UNC5C is expressed by microglia or PBMCs, suggesting that UNC5C is unlikely to play a role in the inflammatory response during AD.
Figure 4. UNC5C is expressed in the adult hippocampus and T835M variant generally sensitizes hippocampal neurons to neurodegenerative cues.

(a) Unc5c in situ hybridization (red) Unc5c+/+ and Unc5c−/− adult mouse hippocampal coronal sections counterstained with hematoxylin (blue) (b) Unc5c quantitative PCR (qPCR) of Unc5c+/+ and Unc5c−/− mouse hippocampus (Hipp), cortex (Ctx), and cerebellum (Cbm), fold change normalized to Unc5c−/−, n=3 mice per genotype. (c, d) qPCR of adult Unc5c+/+ mouse hippocampi flow cytometry sorted for: neurons (NeuN), astrocytes (GFAP), microglia/ macrophages (CD11b) or a non-enriched negative population (c) Unc5c (d) Trem2, fold change normalized to negative population, n=3 Unc5c+/+ mice. (e) Representative images of cultured hippocampal neuron expression of βgal-, WT- and T835M UNC5C-IRES-GFP vectors at plateau of expression (48 h) and terminal time point (116 h). (f) Representative plot of GFP+ expression over time βgal (gray), WT (blue) and T835M UNC5C (red) (g) n=5 independent experiments with 60 images per condition, WT vs. T835M UNC5C by two-tailed unpaired t-test *p=0.0394, or two-tailed one sample t-test with βgal (theoretical mean) vs. WT *p=0.0319, or vs. T835M **p=0.002, respectively. (h–j) βgal gray), WT (blue) and T835M (red) UNC5C-IRES-GFP vector expressing hippocampal neurons were challenged with (h) Aβ1–42 or scrambled Aβ1–42 (i) glutamate (j) staurosporine. Surviving neurotoxin-treated cells normalized to their respective untreated vector controls (h) n=4 independent neuronal culture experiments, βgal (n=120 images) vs. WT (n=120 images) p=0.0609, WT vs. T835M UNC5C (n=120 images) ****p=1.77×10⁻⁹(j) n=3 independent experiments, βgal (n=90 images) vs. WT (n=90 images) p=0.6032, WT vs. T835M UNC5C (n=90 images) **p=0.001446 (i) n=3 independent experiments, βgal (n=90 images) vs. WT (n=90 images) p=0.323, WT vs. T835M UNC5C (n=90 images) **p=0.0005545. (b–d, g–j) data presented as mean ± SEM, (h–j) P value is from a likelihood-ratio test comparing two linear mixed models for growth curve analysis (fit using function lmer in the R package lme4): 1. model with the Dose: Treatment interaction term and 2. model without that term.
Based on the neuronal expression of UNC5C, we next asked whether expression of T835M UNC5C would alter neuronal sensitivity to cell death in cultured primary rat hippocampal neurons. We utilized a live-cell imaging approach monitoring the time-course of expression and basal cell death, which revealed that WT UNC5C expressing neurons were more likely to undergo basal cell death than βgal, yet T835M showed an even higher propensity for cell death (Fig. 4e–g, Supplementary Fig. 11a–c).
To determine if T835M UNC5C expression may predispose hippocampal neurons to toxic insults like those that occur in AD, UNC5C variant expressing rat hippocampal neurons were exposed to increasing concentrations of Aβ1–42 or scrambled Aβ1–42 for 48 h. Quantification of immunocytochemistry (Supplementary Fig. 12) revealed that T835M expressing neurons were more vulnerable to Aβ-induced neurotoxicity than neurons expressing UNC5C WT (Fig. 4h), while no difference was observed between conditions treated with scrambled Aβ1–42. To establish whether T835M UNC5C expression confers a more broad vulnerability, we challenged UNC5C variant expressing hippocampal neurons to increasing concentrations of glutamate, an excitotoxic neurotransmitter, or staurosporine, a toxic kinase inhibitor. Interestingly, T835M expressing neurons were indeed more vulnerable to glutamate or staurosporine-induced neurotoxicity than neurons expressing WT UNC5C (Fig. 4i, j, Supplementary Fig. 13 and 14). These data indicate that neurons expressing T835M UNC5C are predisposed to multiple neurodegenerative stimuli in vitro and that T835M represents a general risk factor for neurotoxins; however, enriched hippocampal expression of UNC5C in the nervous system may result in T835M’s dominantly inherited risk of neurodegeneration as a result of amyloid accumulation, which is a relatively common pathology. What remains to be determined is if T835M is also a risk factor for other neurodegenerative diseases in the context of additional neuronal insults.
Previous AD genetic studies have identified several major pathways implicated in disease, including the β-amyloid cascade, lipid metabolism, and neuroinflammation1–12. There are, however, few examples of genetically linked pathways related to neuronal cell death, a hallmark feature of AD. In the present study we provide evidence that the T835M UNC5C variant increases AD risk. Of interest, a recent manuscript examined the frequency of coding variants in an exon of UNC5C in an AD case/control cohort from China. T835M UNC5C was not present in their population, however there was an aggregation of UNC5C rare and predicted deleterious missense variants in AD cases relative to controls29.
Our cellular data support a mechanism in which T835M enhances the susceptibility of neurons to Aβ-mediated cell death. We also observed a general increase in risk to neuronal insults, suggesting that T835M UNC5C may be a risk factor for other neurodegenerative diseases. Nevertheless, the enriched expression in the hippocampus may place T835M carriers at particular risk for AD. We propose that modulation of the UNC5C pathway may represent a new approach to the treatment of AD.
Online Methods
Human subjects
All human samples used in this study have been included in previous publications30,31. All patients were recruited after providing informed consent and with approval by the relevant institutional review boards, and the study was conducted according to the principles expressed in the Declaration of Helsinki. Regardless of the source (NIA-LOAD Family Study or NCRAD), patients and families were required to meet the same study criteria30. The ADGC assembled a discovery dataset (stage 1, 8,309 individuals with LOAD (cases) and 7,366 cognitively normal elders (CNEs) as controls) using data from eight cohorts and a ninth newly assembled cohort from the 29 National Institute on Aging (NIA)-funded Alzheimer Disease Centers (ADCs), with data coordinated by the National Alzheimer Coordinating Center (NACC) and samples coordinated by the National Cell Repository for Alzheimer Disease (NCRAD)31. Written informed consent was obtained from study participants or, for those with substantial cognitive impairment, from a caregiver, legal guardian or other proxy, and the study protocols for all populations were reviewed and approved by the appropriate institutional review boards.
Linkage Analysis
A pedigree (Fig. 1a) from a previously described cohort30,32 with apparent autosomal dominant inheritance of LOAD was selected for study and screened for known pathogenic variants in APP, PSEN1, PSEN2, MAPT, GRN and TREM2.
DNA was available for 16 members of the family described in Fig. 1a. Samples were genotyped using Illumina InfiniumLinkage24 SNP array (5,913 SNPs). Using this SNP data, relationships between the individuals were verified by examining kinship coefficients between each sample-pair estimated using PLINK using “ -- genome option” 33. For computational feasibility, this large pedigree was split into two subgroups using the software PedCut34 and the ‘maxbit 23’ option. SNPs that showed Mendelian errors were identified and removed using Pedwipe software35. Parametric linkage analysis was performed on these data using Merlin35 and a rare disease with partially-dominant inheritance model with penetrance probabilities: 0.0001, 0.8 and 0.8 and disease prevalence of 0.0001.
Sequencing data analysis
Whole genome sequencing followed by data quality control (QC), short-read alignment and variant calling was performed on an affected individual III, 1 (Fig. 1a) by “unchained combinatorial probe anchor ligation sequencing”, as described previously36. Agilent based exome capture and short read sequencing using Illumina Hi-Seq was performed on a second affected individual (II,5) from the pedigree (Fig. 1a). Resulting reads were aligned to reference genome using BWA37. QC of this data was performed using GATK38 and involved removal of PCR duplicates, quality recalibration, and realignment around short indels. Variant calling was also performed using GATK. Variants from both samples were annotated for potential function using Annovar39.
Samples and genotyping: LOAD pedigree collection
An additional 863 samples selected from the LOAD family cohort30,32 were genotyped for UNC5C T835M using an Illumina Golden Gate Assay. Family members of individuals heterozygous for UNC5C T835M were then genotyped via Kompetitive Allele Specific PCR (KASPar) technology, as previously described40–42. Primers available on request.
LOAD association study sample information
A total of 4 independent LOAD case/control collections were genotyped for UNC5C T835M. 1) A cohort of 78 APOE4+ cases and 67 APOE4+ population matched controls with no evidence of disease with a minimum age of 75 years and genotype was determined at UNC5C T835M from whole genome and exome sequencing data. 2) A previously described collection of 711 LOAD cases and 3,683 aged matched controls using KASPar as described above40–42 3) A collection of 4,065 LOAD cases and 3,127 age-matched controls were genotyped and passed QC using the Illumina exome array v1.
The NIA ADC Samples (ADC)
The NIA ADC cohort, assembled by the Alzheimer’s Disease Genetics Consortium (ADGC) included subjects ascertained and evaluated by the clinical and neuropathology cores of the 29 NIA-funded ADCs. Data collection is coordinated by the National Alzheimer’s Coordinating Center (NACC). NACC coordinates collection of phenotype data from the 29 ADCs, cleans all data, coordinates implementation of definitions of AD cases and controls, and coordinates collection of samples. The ADC cohort consists of 2,499 autopsy-confirmed and 1,748 clinically-confirmed AD cases, and 175 cognitively normal elders (CNEs) with complete neuropathology data who were older than 60 years at age of death, and 2,669 living CNEs evaluated using the Uniform dataset (UDS) protocol43,44 who were documented to not have mild cognitive impairment (MCI) and were between 60 and 100 years of age at assessment. Among cases, the average age at onset was 71.6 years (±9.0 years), and APOE genotypes were 0.1% e22, 3.5% e23, 31.6% e33, 2.8% e24, 44.3% e34, and 14.7% e44. Among controls, the average age at last exam was 76.6 years (± 9.4 years), and APOE genotypes were 0.7% e22, 13.0% e23, 56.8% e33, 2.1% e24, 21.4% e34, and 2.2% e44. Based on the data collected by NACC, the ADGC Neuropathology Core Leaders Subcommittee derived inclusion and exclusion criteria for AD and control samples. All autopsied subjects were age ≥ 60 years at death. AD cases were demented according to DSM-IV criteria or Clinical Dementia Rating (CDR) ≥ 1. Neuropathologic stratification of cases followed NIA/Reagan criteria explicitly, or used a similar approach when NIA/Reagan criteria45 were coded as not done, missing, or unknown. Cases were intermediate or high likelihood by NIA/Reagan criteria with moderate to frequent amyloid plaques and neurofibrillary tangle (NFT) Braak stage of III–VI43,44. Persons with Down’s syndrome, non-AD tauopathies and synucleinopathies were excluded. All autopsied controls had a clinical evaluation within two years of death. Controls did not meet DSM-IV criteria for dementia, did not have a diagnosis of mild cognitive impairment (MCI), and had a CDR of 0, if performed. Controls did not meet or were low-likelihood AD by NIA/Reagan criteria, had sparse or no amyloid plaques, and a Braak NFT stage of 0–II. ADCs sent frozen tissue from autopsied subjects and DNA samples from some autopsied subjects and from living subjects to the ADCs to the National Cell Repository for Alzheimer’s Disease (NCRAD). DNA was prepared by NCRAD and sent either by NCRAD or by the University of Pennsylvania and sent to the North Shore Medical Center for genotyping. An additional 12,789 controls were genotyped using the Illumina exome array v1.0. Genetic outliers were removed based on Eigenvectors from Principal Component Analysis using Eigenstrat (sigma >6)46. 4). 3,196 LOAD cases and 79,248 control individuals from Iceland (DeCode Genetics) were genotyped and imputed for T835M as described47.
Meta-Analysis
Association and meta analysis of case-control data (Figure 1d) was performed using the function metabin in the R package meta using the default parameters, which apply the Mantel-Haenszel inverse variance weighting method for pooling48,49. Using this function we compared risk allele counts in cases and controls in the four genotyped cohorts and performed fixed as well as random-effect meta analyses.
Genotyping
A custom Taqman SNP genotyping assay for UNC5C T835M with two allele-specific TaqMan® MGB probes containing distinct fluorescent dyes (Probe1 - VIC CCCGTGACCGTGGTGA and Probe2- FAM CCCGTGACCATGGTGA) and a PCR primer pair (Forward Primer GGGAGAGGGATGCTGAAAGC and Reverse Primer TGCTGGATCCTGCGAACAC) was designed and used to genotype all 16 members of the pedigree (Fig. 1a).
Plasmid constructs
UNC5C-IRES-GFP or UNC5C-IRES-DsRed vector containing human UNC5C full-length coding sequence was used as template for insertion of the T835M mutant allele using the Quick-change site-directed mutagenesis kit (Stratagene, Agilent Technologies). Primer sequences are available upon request. Either βgal-IRES-GFP or βgal-IRES-DsRed was used as negative control vector. To assay tau release into extracellular medium, human wild-type Tau 441-amino acid-IRES-GFP was used.
Cell cultures and transfections
Cell lines
Human embryonic kidney 293T cells (HEK293T) were maintained in high glucose DMEM supplemented with 10%FBS (Sigma), 1%Glutamax (Gibco, Life technologies), and 1%penicillin/ streptomycin (Gibco). Transient transfections of HEK293T were performed using X-tremeGENE 9 DNA transfection reagent according to manufacturer’s instructions (Roche Diagnostics). HEK293 cells stably expressing wild-type human APP695 were maintained as previously described (PMID:24069330), in DMEM supplemented with 10%FBS (Sigma), 1%glutamax (Gibco), and 1%penicillin/ streptomycin (Gibco) and 400 μg mL−1 G418 (Cellgro®, Corning). Transient transfections of HEK293 wild-type human APP695 stable cell line were performed using Lipofectamine reagent according to manufacturer’s instructions (Invitrogen, Life Technologies).
Immunocyctochemistry (ICC)
HEK293T cells or primary rat hippocampal neurons were fixed with 4%PFA and 4%sucrose in PBS. The cells were permeabilized, blocked, incubated with appropriate primary antibodies (anti-UNC5C (MAB1005, R&D systems)17, anti-GFP (Aves Labs, Inc), detected with anti-mouse Alexa 568 and anti-chicken Alexa 488 secondary antibodies (Invitrogen), and then mounted with Prolong gold medium with DAPI nuclear dye (Invitrogen). All digital image acquisition was performed using Leica software linked to a Leica wide-field fluorescent microscope (DM5500; Leica) and CCD camera (DFC360).
Western Blot
HEK293T or HEK293 cells stably expressing wild-type human APP695 cells were plated into 6-well plates at 75% confluency and transfected as previously indicated. At 24 h post-transfection, cells were split into triplicate. 48 h later, the cells were lysed using RIPA buffer with Complete Protease Inhibitor Cocktail (Roche) and Phospho-stop (Roche). Cell lysates were run on 4–12%NuPage Bis-Tris gels (Invitrogen) for SDS-PAGE analysis. The gels were transferred using iblot (Invitrogen), and the respective membrane was blocked with 5%Blotto (Bio-Rad Laboratories, Hercules, CA) in TBS-T and incubated with anti-UNC5C antibodies (MAB1005, R&D systems) and anti-HRP secondaries (mouse-HRP (Thermo Fisher Scientific), rabbit-HRP (EMD Millipore). Protein was visualized with Supersignal Western Dura extended duration substrate (Thermo Fisher Scientific), Versa Doc Imaging System (Bio-Rad Laboratories), and quantitated using ImageJ software (NIH).
UNC5C expression on cell surface using flow cytometry
To determine cell surface expression of WT or T835M UNC5C, 293Ts cells were transiently transfected for 72 h as previously indicated. Live cells were removed from the culture dish with 5 mM EDTA. Subsequently UNC5C present at the cell surface was labeled with anti-UNC5C antibody, which recognizes the UNC5C extracellular domain (MAB1005, R&D systems), followed by goat-anti-mouse biotin (Jackson ImmunoResearch), and detected with streptavidin-APC (Invitrogen). Samples were analyzed using a FACScan (Becton Dickinson, Franklin Lakes, NJ) and FlowJo software (Tree Star, Inc). Propidium Iodide (PI, 1 μg mL−1, Sigma) was used as a viability marker to allow for initial gating on live, single cells.
Aβ Enzyme Linked Immunosorbent Assay
HEK293 cells stably expressing wild-type human APP695 cells were transfected as previously indicated. At 72 h post-transfection, the conditioned media was collected to assay for APP cleavage products, and cells were lysed using RIPA buffer with Mini-complete Protease Inhibitor Cocktail (Roche) and Phospho-stop (Roche). Aβx–40 and Aβx–42 peptides were measured from cell supernatants by sandwich ELISAs. Briefly, rabbit polyclonal antibody specific for the C-terminus of Aβ40 or Aβ42 (EMD Millipore) was coated onto plates, and biotinylated anti-Aβ monoclonal antibody 6E10 (Covance, Dedham, MA) was used for detection. The 6E10 epitope lies within amino acids 3–8 of Aβ. Cell lysates were used to confirm equivalent expression levels UNC5C, βgal, and APP (22C11, EMD Millipore), and actin was used as a loading control for each individual experiment.
Extracellular tau assay
HEK293T cells were transiently co-transfected with a human wild-type Tau 441aa construct and βgal, WT UNC5C, or UNC5C T835M vector as previously outlined. The conditioned media was collected 72 h post-transfection and assayed for extracellular p-tau or total tau using the MSD 96-Well MULTI-SPOT Alzheimer’s disease assay with phospho-tau (Thr231)/ total tau with purified neuronal tau calibrators (Mesoscale Discovery). Cell lysates were used to confirm equal expression levels of UNC5C, βgal, and tau, and actin was used as a loading control for each individual experiment.
Time-lapse live-cell imaging
HEK293T cells were transfected as described above. Transfections were incubated for 18 h at 37 °C followed by trypsinization and re-plating into a 96-well plate at 1×10⁴ cells well−1. Each sample consisted of six replicates, and the experiment was conducted on four separate occasions. Starting at 22 h post-transfection, cells were imaged for GFP or DsRed fluorescence and bright field at 2–4 h intervals over a 44–64 h period using the IncuCyteFLR or IncucyteZOOM live cell imaging system (Essen Bioscience). At 66 h post-transfection, total well confluency and GFP confluency were calculated over time using IncuCyte 2011A software (Essen Bioscience). The confluency for each sample was calculated by averaging 3–6 replicates containing at least twelve fields of view. To analyze specific growth of the GFP+ cells, GFP confluency was divided by total confluency for all time points and best fit lines were created. The slopes of these lines represent specific GFP or DsRed growth. The slope of each sample was then normalized to the respective control within a given experiment.
Cell cycle profile analysis using flow cytometry
HEK293T cells were transfected as previously indicated. The next day, cells were serum starved in media containing 1% serum for 24 h to synchronize. Following this, fresh medium containing full serum (10%) was added to the cells for 24 h. Subsequently, cells were harvested by TrypLE™ (Gibco) and then washed with PBS containing 5 mM EDTA. Next cells were fixed with ice cold 70% ethanol while vortexing and allowed to incubate on ice for 20 min. Cells were then pelleted and washed with PBS with 5 mM EDTA and 1% BSA. Next cells were treated with PBS containing 5 mM EDTA, 0.5% Tween, 5% goat serum, and 2 μg mL−1 RNase (Sigma) for 15min. Following block and permeabilization, cells were incubated for 30 min with anti-UNC5C primary antibody (1:500, Santa Cruz Biotechnology) in staining buffer (PBS with 5 mM EDTA, 0.5%Tween, and 1%BSA) and then washed once with staining buffer. Cells were then resuspended in staining buffer plus goat anti-rabbit biotin (1:500, Jackson ImmunoResearch Laboratories) and incubated for 30 min on ice. After a single wash with staining buffer, cells were then treated with streptavidin-conjugated APC (1:200, Invitrogen) and 50 μg mL−1 PI (Sigma) in staining buffer for 15 min on ice. Subsequently, cells were washed a final time and resuspended in PBS with 5 mM EDTA, 1% BSA, and PI. Samples were analyzed on a BD LSR-II (BD Biosciences) for DNA content of the UNC5C APC+ population using FlowJo software (Tree Star, Inc.).
AnnexinV apoptosis assay using flow cytometry
HEK293T cells were transiently transfected as previously described. At 24 h post-transfection, cells were harvested by TrypLE™ (Gibco) and washed in FACS buffer (PBS containing 1% BSA and 5 mM EDTA). Following this, cells were resuspended in FACS buffer containing 10 μM Calcein Blue-AM (Invitrogen) and incubated for 15 min. Cells were then pelleted by spinning at 1400 rpm for 5 min at 4 °C and incubated in AnnexinV binding buffer (10 mM HEPES, 140 mM NaCl, 2.5 mM CaCl2 pH 7.4) containing PI 1 μg mL−1 (Sigma) and AnnexinV-APC (Invitrogen) for 15 min at room temperature. Subsequently, cells were spun down and resuspended in AnnexinV binding buffer with 1 μg mL−1 PI. Samples were run on a BD LSR Fortessa cell analyzer (BD biosciences) for the percentage of live, single, GFP+ cells that showed AnnexinV staining and analyzed using FlowJo software (Tree Star, Inc.).
Live-cell imaging
HEK293T cells were transiently transfected with βgal, WT or T835M UNC5C IRES-DsRed constructs as previously described for 24 h, the cells were split into 6 wells of a 96-well pre-coated poly-d-lysine plate. Caspase activity was monitored by the addition of Cellplayer, caspase-3 or -7activity, reagent (1:2000, Essen Bioscience) to the culture medium. Time-lapse images of HEK293Ts were collected on a Nikon Ti-E inverted microscope with a 20× 0.45 NA objective and Nikon Qi1 camera Nikon Elements software (Nikon Instruments). 293T cells were imaged at 1 h interval for a minimum of 44 h. Individual cells were identified and tracked over time using the Spots Tracking function in Imaris (Bitplane, Inc). Fluorescence intensities for both the red and green channel for each cell were exported to Excel (Microsoft). Red cells were tracked based on red fluorescent intensity and considered dead upon showing either green fluorescent signal or by loss of red signal. Data represents three independent experiments with six replicates and 24 fields-of-view per genotype for each experiment.
In situ hybridization murine and human samples
Non-isotopic in situ hybridization (ISH) was performed on 4μm formalin-fixed paraffin-embedded sections using QuantiGene® ViewRNA ISH Tissue Assay (Affymetrix/Panomics) following the manufacturer’s protocol.
Murine
Gene-specific probe sets were used for detection of Unc5c mRNA in mouse (VB1-14659) brain samples, with a probe set to Bacillus subtilis dihydropicolinate reductase (dapB) (VF1-11712) used as a negative control, and probe sets specific to mouse Ubiquitin C (VB1-10202) used as a positive control for comparing overall mRNA levels. Alkaline phospatase (AP) conjugated label probe was used for mouse samples, with Fast Red substrate for chromogenic detection, and hematoxylin was used as a nuclear counter stain.
Human
A gene-specific probe set for detection of human UNC5C mRNA (VA1-14551) target region 503–3132 & 7910–8980, in GenBank accession NM_003728 was used on tissue samples. A probe set to Bacillus subtilis dihydropicolinate reductase (dapB) (VF1-11712)—target region 1363–2044 in GenBank accession L38424 was used as a negative control. A probe set to human UBC (VA1-10203) target region 342–1275 in in GenBank accession NM_021009 was used as a positive control to pre-select tissues with good RNA quality. Deparaffinization was carried out on a Leica stainer XL and after the boiling step in a Thermo Scientific PT module the slides were briefly dipped in ethanol and dried before assembling the ISH chamber for the Tecan platform. Warp Fast Red substrate (Biocare) was used for chromogenic detection, and hematoxylin was used as a nuclear counter stain. Hybridized target mRNAs were visualized using bright field microscopy.
Murine and human mRNA expression
Three adult age-matched Unc5c+/+ and three Unc5c−/− mice18 were euthanized by CO2 followed by cervical dislocation. Hippocampi, cerebellum, cerebral cortices were dissected. Peripheral blood mononuclear cells (PBMCs) were isolated from adult murine spleens and digested with ACK lysis buffer (Invitrogen) to remove red blood cells. Tissue was processed to generate single cell suspension, labeled with antibodies to cell surface markers: PECy7-anti-CD3 (Invitrogen), APC-anti-CD11b (Invitrogen), APC-Cy7-anti-CD11c (Invitrogen), FITC-anti-CD19 (Invitrogen). SYTOX blue (Invitrogen) was used as a viability indicator and samples with single channel fluorescence markers were used to properly set the gates for fluorescent- activated cell sorting (FACSAria, Beckton Dickson) and collecting live, fluorescent positive cells within each indicated PBMC population. Adult human whole blood was acquired from the Genentech Employee Donation Program. PBMCs were isolated using Lymphoprep™ and SepMate™-50 tube (STEMCELL™ Technologies, Vancouver, BC, Canada), processed to a single cell suspension, labeled with antibodies to the following cell surface markers PECY5- anti-CD3 (Invitrogen), FITC-anti-CD14 (Invitrogen), AlexaFluor 700-anti-CD11c (Invitrogen), PE-anti-CD19 (Invitrogen), and sorted in a similar manner to the murine PBMCs samples. RNA was extracted from sub-dissected regions of murine adult brain or sorted populations of murine or human PBMCs, using RNeasy mini plus kit (Qiagen, Valencia CA), cDNA was synthesized using cDNA high capacity reverse transcription kit (Applied Biosystems, Life Technologies, Grand Island, NY), and semi-quantitative PCR was performed using TaqMan® Gene Expression Master Mix (Applied Biosystems) on a 7500 Real-Time PCR System (Applied Biosystems). PCR primers were murine Unc5c (Mm00494093_m1, Invitrogen), murine Trem2 (Mm04209424_g1, Invitrogen) murine β-actin (4352341E, Applied Biosystems); human Unc5c (Hs00186620_m1, Invitrogen), human Trem2 (Hs00219132_m1, Invitrogen), human β-actin (4310881E, Applied Biosystems).
Flow cytometry sorting of adult mouse hippocampi and cortex: both hippocampi or one cortical hemisphere per animal (n=3 matched pairs of Unc5c+/+ and Unc5c−/−) was minced, dissociated with accutase for 20 min at 4 °C. The cells were triturated to single suspension in Hibernate (BrainBits, LLC), passed thru a percoll gradient and then fixed on ice. Cells were blocked in Hibernate and labeled with primary antibodies: NueN-488 (1:1000, Chemicon), GFAP-PE (1:50, BD Biosciences), CD11b-APC (1:250, BD Biosciences) for 30 min at 4 °C. DAPI was added to gate on single cells. The cell-specific sub-types were isolated by FACS and collected for qPCR analysis as described above.
Primary embryonic hippocampal neuron cultures
The Animal Care and Use Committee at Genentech approved this study, and use was in accordance with their guidelines. Timed-pregnant Sprague Dawley rats were euthanized by CO2 followed by cervical dislocation. Hippocampi were dissected from embryonic day 18 (E18d) rats and enzymatically dissociated using the papain dissociation system following the manufacturer’s instructions (Worthington Biochemical Corp, Lakewood, NJ). Dissociated hippocampal cells were placed in nucleofector solution with βgal, WT or T835M UNC5C IRES-GFP constructs and transduced using the nucleofection method with Amaxa electroporation (Lonza). Following nucleofection, the cells were plated on to pre-coated poly-d-lysine/ laminin plates in NB4Activ medium (BrainBits) supplemented with 1% penicillin/ streptomycin (Gibco). The neuronal cultures were challenged with: no treatment vehicle (DMSO) control, Aβ1–42 (rPeptide), scrambled Aβ1–42 peptide (rPeptide), glutamate (Tocris), or staurosporine (Sigma). For Aβ1–42, immediately prior to addition to the culture medium, lyophilized Abeta was resuspended in DMSO then diluted further in neuronal growth media. The neuronal cultures were incubated with Aβ for 48 h and processed for ICC to visualize the GFP positive transduced neurons. With the experimenter blinded to condition, within three randomly plated wells, ten fields-of-view were captured per well, the number of GFP+ cells were determined by ImageJ automated analysis. In order to compare across conditions and between experiments in which the number of GFP+ transduced cells varied between individual nucleofected vectors, the number of surviving neurotoxin-treated cells were normalized to their respective untreated vector controls.
Time-lapse live-cell imaging: hippocampal neurons were dissociated and nucleofected as described above. Cells were allowed to attach to poly-d-lysine coated 96-well plate at 37°C for 3 h prior to initiating imaging. Each vector condition consisted of three technical replicates with four-fields-of-view acquired per replicate and the experiment was conducted on six separate occasions. Five of the independent experiments displayed similar variation. One experiment experienced a technical error of remaining in neucleofector solution too long, and this experiment was discard due to increased variation within the experiment. Data shown was combined from five experiments that displayed consistent variation across experiments. Starting at 3 h post-nucleofection, cells were imaged for GFP fluorescence and bright field at 4 h intervals for 116 h period using the IncuCyte™ Zoom live cell imaging system (Essen Bioscience). After 116 h of imaging, number of GFP+ cells per well overtime was obtained using IncuCyte™ Zoom 2013A software (Essen Bioscience). The number of cells per well for each sample was calculated by averaging three replicates containing at least twelve fields of view per sample. To determine nucleofection efficiency, the slopes of the best-fit lines for each condition from 0 h to plateau were created. The slopes of these lines represent the rate of vector expression or nucleofection efficiency. To calculate ongoing basal cell death for each vector, the number of cells remaining at 116 h was divided by the number of cells present at 48 h. Survival of each vector was then normalized to βgal, to capture vector specific cell death.
Statistical analysis
All results are shown as mean ± standard error of the mean. For every in vitro experiment, all samples collected were included in the final analyses. Statistical analysis was performed using either a one-way analysis of variance (ANOVA) or two-tailed T-test as indicated using Prism6 software (Graphpad). Data sets were tested for normality using D-Agostino and Pearson omnibus normality test. If data sets did not meet normality, then a non-parametric test was chosen to determine statistical significance. Differences determined to be p < 0.05 were considered statistically significant.
Supplementary Material
Acknowledgments
This work was partially supported by grants from the US National Institutes of Health (R01-AG044546), and the Alzheimer Association (NIRG-11-200110). This research was conducted while CC was a recipient of a New Investigator Award in Alzheimer’s disease from the American Federation for Aging Research. CC is a recipient of a BrightFocus Foundation Alzheimer’s Disease Research Grant (A2013359S). Samples from the National Cell Repository for Alzheimer’s Disease (NCRAD), which receives government support under a cooperative agreement grant (U24 AG21886) awarded by the National Institute on Aging (NIA), were used in this study. NIALOAD samples were collected under a cooperative agreement grant (U24 AG026395) awarded by the National Institute on Aging. We thank Karí Steffansøn and DeCode Genetics for genotype counts of UNC5C variants in the Icelandic population, the Alzheimer’s Disease Centers who collected samples used in this study, as well as patients and their families, whose help and participation made this work possible, C. Nelson, Neuroscience Department, (HEK293 wild-type human APP695 stable cell line), K. Hoyte, Y. Lu, M. Sagolla, L. Gilmor, J. Borneo, E. Ladi, J. Grogan, J. Larson, J. Kaminker, Genentech for the technical assistance, and Sue Ackerman, The Jackson Laboratory/ HHMI for the generous gift of Unc5c−/− mice.
Footnotes
Authors Contributions
M.K.W.-S. designed, conducted, analyzed biological experiments, and wrote manuscript, J.H. designed, conducted, analyzed biological experiments, and wrote manuscript, T.R.B. performed linkage, case-control association, survival, growth-curve and sequencing data analysis, K.S. developed method for isolating, sorting cell-type specific adult brain for qPCR, J.A.M. generated vectors and contributed to in vitro experiment, J.K.A. supervised project, S.M.S. performed Unc5c ISH, M.B.Y. performed UNC5C ISH, O.F. contributed to ISH experiments and generated images, N.R. performed sample genotyping, sample handling, and contributed to manuscript, W.O. coordinated DNA sample collection, sequencing, and data management, D.V.H supervised development of method for isolating, sorting cell-type specific adult brain for qPCR, M.T.-L. contributed to manuscript, ADGC provided AD case and control cohorts, R.M. provided sample material, and contributed to manuscript, M. P.-V. provided sample material and contributed to manuscript, J. Ha provided sample material and contributed to manuscript, L.A.F. provided sample material and contributed to manuscript, G.D.S. provided sample material and contributed to manuscript, A.G. provided sample material and contributed to manuscript, T.W.B. supervised project and contributed to manuscript, C.C. supervised project and contributed to manuscript, R.J.W. supervised project and wrote manuscript, R.R.G supervised project and wrote manuscript.
References
- 1.Coppola G, et al. Evidence for a role of the rare p.A152T variant in MAPT in increasing the risk for FTD-spectrum and Alzheimer’s diseases. Human molecular genetics. 2012;21:3500–3512. doi: 10.1093/hmg/dds161. [DOI] [PMC free article] [PubMed] [Google Scholar]
- 2.Corder EH, et al. Gene dose of apolipoprotein E type 4 allele and the risk of Alzheimer’s disease in late onset families. Science. 1993;261:921–923. doi: 10.1126/science.8346443. [DOI] [PubMed] [Google Scholar]
- 3.Cruchaga C, et al. Rare variants in APP, PSEN1 and PSEN2 increase risk for AD in late-onset Alzheimer’s disease families. PloS one. 2012;7:e31039. doi: 10.1371/journal.pone.0031039. [DOI] [PMC free article] [PubMed] [Google Scholar]
- 4.Cruchaga C, et al. Rare coding variants in the phospholipase D3 gene confer risk for Alzheimer’s disease. Nature. 2014;505:550–554. doi: 10.1038/nature12825. [DOI] [PMC free article] [PubMed] [Google Scholar]
- 5.Genin E, et al. APOE and Alzheimer disease: a major gene with semi-dominant inheritance. Molecular psychiatry. 2011;16:903–907. doi: 10.1038/mp.2011.52. [DOI] [PMC free article] [PubMed] [Google Scholar]
- 6.Guerreiro R, et al. TREM2 variants in Alzheimer’s disease. The New England journal of medicine. 2013;368:117–127. doi: 10.1056/NEJMoa1211851. [DOI] [PMC free article] [PubMed] [Google Scholar]
- 7.Harold D, et al. Genome-wide association study identifies variants at CLU and PICALM associated with Alzheimer’s disease. Nature genetics. 2013;45:712. doi: 10.1038/ng.440. [DOI] [PMC free article] [PubMed] [Google Scholar]
- 8.Hollingworth P, et al. Common variants at ABCA7, MS4A6A/MS4A4E, EPHA1, CD33 and CD2AP are associated with Alzheimer’s disease. Nature genetics. 2011;43:429–435. doi: 10.1038/ng.803. [DOI] [PMC free article] [PubMed] [Google Scholar]
- 9.Jonsson T, et al. A mutation in APP protects against Alzheimer’s disease and age-related cognitive decline. Nature. 2012;488:96–99. doi: 10.1038/nature11283. [DOI] [PubMed] [Google Scholar]
- 10.Jonsson T, et al. Variant of TREM2 associated with the risk of Alzheimer’s disease. The New England journal of medicine. 2013;368:107–116. doi: 10.1056/NEJMoa1211103. [DOI] [PMC free article] [PubMed] [Google Scholar]
- 11.Lambert JC, et al. Meta-analysis of 74,046 individuals identifies 11 new susceptibility loci for Alzheimer’s disease. Nature genetics. 2013;45:1452–1458. doi: 10.1038/ng.2802. [DOI] [PMC free article] [PubMed] [Google Scholar]
- 12.Naj AC, et al. Common variants at MS4A4/MS4A6E, CD2AP, CD33 and EPHA1 are associated with late-onset Alzheimer’s disease. Nature genetics. 2011;43:436–441. doi: 10.1038/ng.801. [DOI] [PMC free article] [PubMed] [Google Scholar]
- 13.Harms M, et al. C9orf72 hexanucleotide repeat expansions in clinical Alzheimer disease. JAMA neurology. 2013;70:736–741. doi: 10.1001/2013.jamaneurol.537. [DOI] [PMC free article] [PubMed] [Google Scholar]
- 14.Leonardo E, et al. Vertebrate homologues of C. elegans UNC-5 are candidate netrin receptors. Nature. 1997;386:833–838. doi: 10.1038/386833a0. [DOI] [PubMed] [Google Scholar]
- 15.Ackerman S, et al. The mouse rostral cerebellar malformation gene encodes an UNC-5-like protein. Nature. 1997;386:838–842. doi: 10.1038/386838a0. [DOI] [PubMed] [Google Scholar]
- 16.Przyborski S, Knowles B, Ackerman S. Embryonic phenotype of Unc5h3 mutant mice suggests chemorepulsion during the formation of the rostral cerebellar boundary. Development (Cambridge, England) 1998;125:41–50. doi: 10.1242/dev.125.1.41. [DOI] [PubMed] [Google Scholar]
- 17.Wijsman EM, et al. Genome-wide association of familial late-onset Alzheimer’s disease replicates BIN1 and CLU and nominates CUGBP2 in interaction with APOE. PLoS Genet. 2011;7:e1001308. doi: 10.1371/journal.pgen.1001308. [DOI] [PMC free article] [PubMed] [Google Scholar]
- 18.Lee JH, Cheng R, Graff-Radford N, Foroud T, Mayeux R. Analyses of the National Institute on Aging Late-Onset Alzheimer’s Disease Family Study: implication of additional loci. Archives of neurology. 2008;65:1518–1526. doi: 10.1001/archneur.65.11.1518. [DOI] [PMC free article] [PubMed] [Google Scholar]
- 19.Nadeau JH. Modifier genes and protective alleles in humans and mice. Current opinion in genetics & development. 2003;13:290–295. doi: 10.1016/s0959-437x(03)00061-3. [DOI] [PubMed] [Google Scholar]
- 20.Goedert M, Spillantini MG, Cairns NJ, Crowther RA. Tau proteins of Alzheimer paired helical filaments: abnormal phosphorylation of all six brain isoforms. Neuron. 1992;8:159–168. doi: 10.1016/0896-6273(92)90117-v. [DOI] [PubMed] [Google Scholar]
- 21.Glenner GG, Wong CW. Alzheimer’s disease: initial report of the purification and characterization of a novel cerebrovascular amyloid protein. Biochemical and biophysical research communications. 1984;120:885–890. doi: 10.1016/s0006-291x(84)80190-4. [DOI] [PubMed] [Google Scholar]
- 22.Masters CL, et al. Neuronal origin of a cerebral amyloid: neurofibrillary tangles of Alzheimer’s disease contain the same protein as the amyloid of plaque cores and blood vessels. EMBO J. 1985;4:2757–2763. doi: 10.1002/j.1460-2075.1985.tb04000.x. [DOI] [PMC free article] [PubMed] [Google Scholar]
- 23.Llambi F, Causeret F, Bloch-Gallego E, Mehlen P. Netrin-1 acts as a survival factor via its receptors UNC5H and DCC. EMBO J. 2001;20:2715–2722. doi: 10.1093/emboj/20.11.2715. [DOI] [PMC free article] [PubMed] [Google Scholar]
- 24.Thiebault K, et al. The netrin-1 receptors UNC5H are putative tumor suppressors controlling cell death commitment. Proceedings of the National Academy of Sciences of the United States of America. 2003;100:4173–4178. doi: 10.1073/pnas.0738063100. [DOI] [PMC free article] [PubMed] [Google Scholar]
- 25.Wang R, et al. Autoinhibition of UNC5b revealed by the cytoplasmic domain structure of the receptor. Mol Cell. 2009;33:692–703. doi: 10.1016/j.molcel.2009.02.016. [DOI] [PubMed] [Google Scholar]
- 26.Braak H, Braak E, Bohl J. Staging of Alzheimer-related cortical destruction. European neurology. 1993;33:403–408. doi: 10.1159/000116984. [DOI] [PubMed] [Google Scholar]
- 27.Ball MJ. Neuronal loss, neurofibrillary tangles and granulovacuolar degeneration in the hippocampus with ageing and dementia. A quantitative study. Acta neuropathologica. 1977;37:111–118. doi: 10.1007/BF00692056. [DOI] [PubMed] [Google Scholar]
- 28.Squire LR. Memory and the hippocampus: a synthesis from findings with rats, monkeys, and humans. Psychological review. 1992;99:195–231. doi: 10.1037/0033-295x.99.2.195. [DOI] [PubMed] [Google Scholar]
- 29.Jiao B, et al. Investigation of TREM2, PLD3, and UNC5C variants in patients with Alzheimer’s disease from mainland China. Neurobiology of aging. 2014 doi: 10.1016/j.neurobiolaging.2014.04.025. [DOI] [PubMed] [Google Scholar]
- 30.Wijsman EM, et al. Genome-wide association of familial late-onset Alzheimer’s disease replicates BIN1 and CLU and nominates CUGBP2 in interaction with APOE. PLoS genetics. 2011;7:e1001308. doi: 10.1371/journal.pgen.1001308. [DOI] [PMC free article] [PubMed] [Google Scholar]
- 31.Naj AC, et al. Common variants at MS4A4/MS4A6E, CD2AP, CD33 and EPHA1 are associated with late-onset Alzheimer’s disease. Nature genetics. 2011;43:436–441. doi: 10.1038/ng.801. [DOI] [PMC free article] [PubMed] [Google Scholar]
- 32.Cruchaga C, et al. Rare variants in APP, PSEN1 and PSEN2 increase risk for AD in late-onset Alzheimer’s disease families. PLoS One. 2012;7:e31039. doi: 10.1371/journal.pone.0031039. [DOI] [PMC free article] [PubMed] [Google Scholar]
- 33.Purcell S, et al. PLINK: a tool set for whole-genome association and population-based linkage analyses. Am J Hum Genet. 2007;81:559–575. doi: 10.1086/519795. [DOI] [PMC free article] [PubMed] [Google Scholar]
- 34.Liu F, Kirichenko A, Axenovich TI, van Duijn CM, Aulchenko YS. An approach for cutting large and complex pedigrees for linkage analysis. European journal of human genetics EJHG. 2008;16:854–860. doi: 10.1038/ejhg.2008.24. [DOI] [PubMed] [Google Scholar]
- 35.Abecasis GR, Cherny SS, Cookson WO, Cardon LR. Merlin--rapid analysis of dense genetic maps using sparse gene flow trees. Nature genetics. 2002;30:97–101. doi: 10.1038/ng786. [DOI] [PubMed] [Google Scholar]
- 36.Drmanac R, et al. Human genome sequencing using unchained base reads on self-assembling DNA nanoarrays. Science. 2010;327:78–81. doi: 10.1126/science.1181498. [DOI] [PubMed] [Google Scholar]
- 37.Li H, Durbin R. Fast and accurate short read alignment with Burrows-Wheeler transform. Bioinformatics. 2009;25:1754–1760. doi: 10.1093/bioinformatics/btp324. [DOI] [PMC free article] [PubMed] [Google Scholar]
- 38.DePristo MA, et al. A framework for variation discovery and genotyping using next-generation DNA sequencing data. Nature genetics. 2011;43:491–498. doi: 10.1038/ng.806. [DOI] [PMC free article] [PubMed] [Google Scholar]
- 39.Wang K, Li M, Hakonarson H. ANNOVAR: functional annotation of genetic variants from high-throughput sequencing data. Nucleic acids research. 2010;38:e164. doi: 10.1093/nar/gkq603. [DOI] [PMC free article] [PubMed] [Google Scholar]
- 40.Benitez BA, et al. TREM2 is associated with the risk of Alzheimer’s disease in Spanish population. Neurobiology of aging. 2013;34:1711, e1715–1717. doi: 10.1016/j.neurobiolaging.2012.12.018. [DOI] [PMC free article] [PubMed] [Google Scholar]
- 41.Cruchaga C, et al. GWAS of cerebrospinal fluid tau levels identifies risk variants for Alzheimer’s disease. Neuron. 2013;78:256–268. doi: 10.1016/j.neuron.2013.02.026. [DOI] [PMC free article] [PubMed] [Google Scholar]
- 42.Jin SC, et al. Pooled-DNA sequencing identifies novel causative variants in PSEN1, GRN and MAPT in a clinical early-onset and familial Alzheimer’s disease Ibero-American cohort. Alzheimer’s research & therapy. 2012;4:34. doi: 10.1186/alzrt137. [DOI] [PMC free article] [PubMed] [Google Scholar]
- 43.Braak H, Braak E. Neuropathological stageing of Alzheimer-related changes. Acta neuropathologica. 1991;82:239–259. doi: 10.1007/BF00308809. [DOI] [PubMed] [Google Scholar]
- 44.Nagy Z, et al. Assessment of the pathological stages of Alzheimer’s disease in thin paraffin sections: a comparative study. Dementia and geriatric cognitive disorders. 1998;9:140–144. doi: 10.1159/000017038. [DOI] [PubMed] [Google Scholar]
- 45.Hyman BT, Trojanowski JQ. Consensus recommendations for the postmortem diagnosis of Alzheimer disease from the National Institute on Aging and the Reagan Institute Working Group on diagnostic criteria for the neuropathological assessment of Alzheimer disease. Journal of neuropathology and experimental neurology. 1997;56:1095–1097. doi: 10.1097/00005072-199710000-00002. [DOI] [PubMed] [Google Scholar]
- 46.Price AL, et al. Principal components analysis corrects for stratification in genome-wide association studies. Nature genetics. 2006;38:904–909. doi: 10.1038/ng1847. [DOI] [PubMed] [Google Scholar]
- 47.Jonsson T, et al. A mutation in APP protects against Alzheimer’s disease and age-related cognitive decline. Nature. 2012;488:96–99. doi: 10.1038/nature11283. [DOI] [PubMed] [Google Scholar]
- 48.Schwarzer G. meta: Meta-Analysis with R. R package version 2.1–0. 2012 [Google Scholar]
- 49.Team, R.D.C. A language and environment for statistical computing. 2012 [Google Scholar]
Associated Data
This section collects any data citations, data availability statements, or supplementary materials included in this article.