

Abstract
Purpose
Retinitis pigmentosa (RP) typically results from individual mutations in any one of >70 genes that cause rod photoreceptor cells to degenerate prematurely, eventually resulting in blindness. Gene therapies targeting individual RP genes have shown efficacy at clinical trial; however, these therapies require the surviving photoreceptor cells to be viable and functional, and may be economically feasible for only the more commonly mutated genes. An alternative potential treatment strategy, particularly for late stage disease, may involve stem cell transplants into the photoreceptor layer of the retina. Rod progenitors from postnatal mouse retinas can be transplanted and can form photoreceptors in recipient adult retinas; optimal numbers of transplantable cells are obtained from postnatal day 3–5 (P3–5) retinas. These cells can also be expanded in culture; however, this results in the loss of photoreceptor potential. Gene expression differences between postnatal retinas, cultured retinal progenitor cells (RPCs), and rod photoreceptor precursors were investigated to identify gene expression patterns involved in the specification of rod photoreceptors.
Methods
Microarrays were used to investigate differences in gene expression between cultured RPCs that have lost photoreceptor potential, P1 retinas, and fresh P5 retinas that contain significant numbers of transplantable photoreceptors. Additionally, fluorescence-activated cell sorting (FACS) sorted Rho-eGFP-expressing rod photoreceptor precursors were compared with Rho-eGFP-negative cells from the same P5 retinas. Differential expression was confirmed with quantitative polymerase chain reaction (q-PCR).
Results
Analysis of the microarray data sets, including the use of t-distributed stochastic neighbor embedding (t-SNE) to identify expression pattern neighbors of key photoreceptor specific genes, resulted in the identification of 636 genes differentially regulated during rod specification. Forty-four of these genes when mutated have previously been found to cause retinal disease. Although gene function in other tissues may be known, the retinal function of approximately 61% of the gene list is as yet undetermined. Many of these genes’ promoters contain binding sites for the key photoreceptor transcription factors Crx and Nr2e3; moreover, the genomic clustering of differentially regulated genes appears to be non-random.
Conclusions
This study aids in understanding gene expression differences between rod photoreceptor progenitors versus cultured RPCs that have lost photoreceptor potential. The results provide insights into rod photoreceptor development and should expedite the development of cell-based treatments for RP. Furthermore, the data set includes a large number of retinopathy genes; less-well-characterized genes within this data set are a resource for those seeking to identify novel retinopathy genes in patients with RP (GEO accession: GSE59201).
Introduction
Inherited retinal degeneration (RD) damages light-sensing photoreceptors, resulting in loss of vision. RD is an umbrella term covering diseases that range in severity from Leber hereditary amaurosis (LCA), in which vision is severely affected from birth, to milder forms of RP that can leave central vision intact until old age, and macular degeneration, which affects central vision only. RD represents the most common cause of visual dysfunction in people of working age in developed economies. Therefore, these conditions have significant adverse effects on patient quality of life and on the broader economy. Genetic linkage studies, functional genomics, and next-generation sequencing (NGS) technologies have provided opportunities to elucidate the pathways of retinal development and homeostasis, in addition to the molecular pathogenesis of disease. A notable feature of inherited retinopathies is their genetic heterogeneity; multiple mutations in any one of more than 200 genes can cause RD. Retinitis pigmentosa (RP), a form of RD that results from rod photoreceptor defects, affects approximately 1 in 3,000 adults and can result from mutations in any one of more than70 genes [1-3] (RetNet). Regardless of the genetic mutation underlying individual forms of RD, however, photoreceptor cell death occurs gradually via apoptosis.
Gene therapies for some forms of RD have been investigated; gene replacement therapies for diverse recessive retinopathies have shown promise in clinical trials [1,3-11]. With the exception of optogenetic-based gene therapies [1,12], gene therapy requires significant photoreceptor survival and therefore may not represent an optimal therapeutic strategy for advanced disease. Furthermore, gene therapies targeted to the primary genetic defect underlying each form of RD potentially will require approximately 200 individual therapeutics due to the significant genetic heterogeneity in RD. Therefore, gene therapies for rarer forms of RD may be challenging, given timelines and costs associated with clinical trials.
Transplantation of stem cell–derived photoreceptor precursors into retinas with advanced disease may provide a complementary approach. A significant advantage of cell therapy should be the potential to treat diverse and advanced forms of RD, irrespective of genetic etiology or stage of degeneration. However, for stem cell approaches to be effective, expandable sources of cells that can be routinely differentiated into the required cell types are required. The most abundant source of transplantable photoreceptors is currently the postnatal mouse retina. Freshly dissected early postnatal mouse retinal cells, when dissociated and transplanted into recipient eyes immediately, can integrate into host retinas and form functional photoreceptors [13-18]. The same cells can be expanded in culture, but cultured retinal progenitor cells (RPCs) switch off rhodopsin in the first 3–7 days of culture at the protein and RNA levels. Moreover, cultured RPCs do not form photoreceptors after transplantation; these cells are probably glial precursors [15,19]. Recent studies have indicated oligodendrocytic potential in RPCs, which is not present in native retinal cells. Growth factors commonly used in serum-free neural stem cell culture, epidermal growth factor (EGF) and fibroblast growth factor 2 (FGF2), may influence RPC potential; EGF in particular is known to promote gliogenesis [19].
The human developmental stage equivalent to early postnatal mouse retinas is a mid-gestation embryo, which makes donor transplantation ethically and logistically difficult [20]. Advances have been made in differentiating transplantable photoreceptors from embryonic stem (ES) cells [21-25], using three-dimensional embryoid body–based culture techniques that produce laminated optic cups with differentiating photoreceptors. ES cell use presents ethical barriers, which in principle can be overcome using induced pluripotent stem (iPS) cells that are similarly capable of photoreceptor differentiation [23,26,27]. However, the number of cells obtained from current ES and iPS cell differentiation protocols is still small. Protocol development may be enhanced by more detailed knowledge of gene expression cascades during photoreceptor development.
This study investigates differences in gene expression profiles between postnatal retinas, cultured RPCs, and rod photoreceptor precursors to identify genes involved in rod photoreceptor development and maturation. Genes upregulated during rod development have been identified via microarray, comparing FACS-purified enhanced green fluorescent protein (eGFP0-positive rod cells from postnatal day 5 (P5) Rho-eGFP retinas to eGFP-negative cells from the remainder of the retina. Comparison of whole P1 and P5 retinas to cultured RPCs (which have lost the ability to become photoreceptors) was also undertaken. Use of t-distributed stochastic neighbor embedding (t-SNE) [28,29] allowed identification of closest expression “neighbors” to a subset of well-characterized genes with key photoreceptor functions. We have identified 636 genes that are potentially important in rod photoreceptor development and differentiation. Forty-four are previously identified RD disease genes (RetNet), while 207 have been highlighted as important to retinal and/or photoreceptor development in other retinal gene expression studies [16,30-42]. The retinal function of 61% of the gene list is unknown. These results represent a resource for elucidating rod photoreceptor developmental biology. The data set also contains a large number of genes known to cause retinopathy; less-well-characterized genes within this data set represent a resource for those seeking to identify novel retinopathy genes in patients with RP.
Methods
Mice
Animals were housed and cared for under license from the Irish Medicines Board/Department of Health and Children according to Irish and European Union (EU) legislation. Animals were housed and cared for under license from the Irish Medicines Board/Department of Health and Children according to Irish and European Union (EU) legislation. This legal framework is equivalent to guidelines published by the Institute for Laboratory Animal Research or the U.S. Public Health Service. Animal care adhered to the ARVO Statement for Use of Animals in Research. This legal framework is equivalent to guidelines published by the Institute for Laboratory Animal Research or the U.S. Public Health Service.
Retinas were extracted from postnatal day 1 and day 5 (P1 and P5) rhodopsin-eGFP (Rho-eGFP [43]) heterozygote mice, maintained on a 129Sv/J background. These mice express a human Rho-eGFP fusion protein that is visible in rod outer segments following transplantation. Heterozygotes were used as homozygotes show symptoms of retinal degeneration [43]. Rho-eGFP retinas were also used as a source of cultured RPCs, to minimize possible gene expression differences arising from varying genetic background.
Dissociation for FACS
Rho-eGFP P5 retinas were dissected and placed in 1 ml Hank’s Balanced Salt Solution (HBSS; Lonza Biologics Ltd., Tewkesbury, UK). The ciliary margin was removed from the retinas before dissociation. Retinas were placed in 1 ml HBSS (Lonza), and 100 μl of 10 mg/ml trypsin (Sigma-Aldrich, Arklow, Ireland) was added. Retinas were incubated for 10 min at 37 °C, after 5 min, 10 μl of 10 μg/ml DNase1 + 100 μl 20 mg/ml trypsin inhibitor were added, and the samples were triturated. Cells were spun for 5 min at 350 ×g, resuspended in 1 ml PBS (Dulbecco’s Phosphate Buffered Saline, -CaCl2, -MgCl2, Catalogue number: 14190-094, Life Technologies, Paisley, UK) with 10 μl DNase1, and then analyzed with FACS. Cells were sorted based on GFP expression on an Aria Fusion cell sorter (Becton Dickinson, Oxford, UK) [15,44]. Following FACS analysis, cells were spun at 350 ×g for 5 min and resuspended in 100 μl PBS. Cells were then subjected to RNA extraction.
Retinal dissociation for subsequent cell culture
Rho-eGFP P4–5 retinas were placed in 1 ml PBS or HBSS following dissection. The ciliary margin was removed from the retinas before dissociation to avoid contamination by ciliary epithelial (CE) cells in subsequent cultures. Two hundred microliters of Accutase (Sigma-Aldrich) was added, the retinas were incubated for 5 min at 37 °C, allowed to settle to the bottom of the tube, and most of the supernatant aspirated away, 1 ml growth medium (Dulbecco’s modified Eagle’s medium nutrient mixture, F12 Ham, D8437, Arklow medium [DME/F12], (Sigma), supplemented with B27 without vitamin A (Invitrogen), 1× L-glutamine (Lonza), 1× penicillin/streptomycin (Lonza), 5 μg/ml heparin (Sigma), 20 ng/ml FGF2 (Peprotech, London, UK), and 20 ng/ml EGF (Peprotech) were added, and the retinas were dissociated by trituration with a fire-polished Pasteur pipette. Following dissociation, cells were counted four times using a hemocytometer and plated for culture.
Cell culture
RPCs were grown in T25 flasks (Sarstedt, Drinagh, Wexford, Ireland) in 5 ml growth medium and incubated at 37 °C and 5% CO2. After initial plating, the medium was replaced after 5–7 days initially, and then every 2–7 days depending on cell density. Initial platings contained 1/1,000 gentamycin, which was not added to the medium after 7 days of culture. Cells were passaged when 80–90% confluent. About 0.5 ml 0.25% trypsin/EDTA (Lonza) or Accutase (Sigma-Aldrich) were added to each T25 flask, following the removal of medium and rinsing with 1× PBS. Flasks were incubated for 5–10 min until the cell monolayers lifted off. Cells were resuspended in 3 ml DMEM/F12, counted four times, and spun at 100 g. The supernatant was removed, and the pellets were resuspended in growth medium, replated, frozen, or treated with TRI reagent (Sigma-Aldrich). Early passage cells (P2–P5) were used for the array. Previous data [15] indicate that P0 cells plated for 7 days or longer have completely lost Rho-eGFP protein expression; cells of passage 2 or greater have largely lost all RNA expression of rhodopsin as well (no doubt reflecting the loss of post-mitotic cell types from the cultures). All cultures used for the array were morphologically similar and had attained the maximum growth rate at the point of harvest, thus minimizing variation in gene expression. Cells older than P9–10 are increasingly likely to have reached a Hayflick limit and/or to have become spontaneously immortalized, and were therefore excluded from the study. Cells older than P9–10 are increasingly likely to have reached a Hayflick limit and/or to have become spontaneously immortalized, and were therefore excluded from the study. The Hayflick limit is the point at which, after a certain number of cell divisions, normal somatic cells stop dividing, in association with critical levels of telomere shortening.
RNA extraction
Cell pellets were resuspended in 1 ml TRI reagent (Sigma-Aldrich) and triturated using a P1000 pipetter, while the retinas were homogenized in 1 ml TRI reagent using a 100 μl mini Dounce homogenizer (Fisher Scientific, Dublin, Ireland). RNA was prepared according to the manufacturer’s protocol, and then repurified using the RNeasy kit (Qiagen, Manchester, UK), incorporating the DNase step according to the manufacturer’s instructions. The RNA samples were assayed for concentration and quality using a Nanodrop ND1000 (NanoDrop Technologies, Wilmington, DE) spectrophotometer and a Qubit (Invitrogen, Paisley, UK). One to fifty dilutions of FACS-sorted samples were assessed with qPCR (see below) for enrichment of rhodopsin in the eGFP-positive samples.
Microarray experiments
RNAs passing quality control (OD 260/280, OD 230) were outsourced to Source BioScience GmbH (Berlin, Germany) for the array. The samples were reanalyzed for quality using a BioAnalyser 2100 (Agilent G2938A, Santa Clara, CA). The FACS-derived samples were amplified before labeling to increase the amount of input RNA, using the Ovation Pico WTA system (NuGen) and then labeled using the Encore Biotin module (NuGen, Leek, the Netherlands). Unamplified samples were labeled using the IVT Express kit (Affymetrix, High Wycombe, UK), according to the manufacturer’s protocol. Amplified RNA was purified and hybridization cocktails prepared and hybridized to Affymetrix mouse A430_2 whole genome arrays, using the GeneChip Hybridization, Wash, and Stain Kit (Affymetrix), according to the manufacturer’s protocol. Arrays were scanned using a GeneChip Scanner 3000 (Affymetrix). Four biological replicates of each sample type were arrayed.
Array analysis
Expression analysis
Raw array data were loaded and normalized using the Affymetrix package for R [45-47]. Expression across different conditions, together with associated significance tests, were performed using R and Limma [48,49].
Dimensionality reduction for visualization
Dimensionality reduction was performed using the Barnes-Hut-SNE implementation [28] of the t-SNE algorithm [29]. Each probe was represented as a 20-dimensional vector, with each vector component representing its normalized expression in a single sample and condition. The set of all probe vectors was passed as input to the Barnes-Hut-SNE algorithm, which generated a two-dimensional output mapping designed to preserve the local and global structure from the 20-dimensional data set (inclusive of all replicates for all sample types). Due to the large size of the output and consequent difficulty finding individual genes by manual inspection or traditional image-editing tools, a web interface was programmed in Python that allows searches for individual genes and identifies nearest expression neighbors. The resulting t-SNE expression map for each gene is searchable. The Python code for this database is listed in Appendix 1. The nearest expression neighbors of key retinal disease genes (listed on RetNet) were mapped in relation to the whole data set. The closest neighbors of three clusters of disease genes were listed and investigated further.
Bioinformatic analysis
Initial analysis of Rho-eGFP-positive cells (immature rod photoreceptors) versus Rho-eGFP-negative cells was performed. More than 1,000 genes were found to be upregulated in the Rho-eGFP-positive cells, and another similarly sized cohort of genes was found to be downregulated, with fold changes of less than −2 or greater than 2, and p values of 0.01 or less (Appendix 2). Following the initial analysis, differentially regulated genes (adjusted p value <0.001, fold change >2 or < −2) from two-way comparisons of the five data sets (RPCs, P1 retinas, P5 retinas, Rho-eGFP +ve, and Rho-eGFP –ve retinal cells) were sorted. Genes differentially regulated in at least three comparisons were retained for bioinformatic analysis. RNA amplification can introduce significant error [50]; comparison of the FACS eGFP+ve versus eGFP-ve gene list with those from unamplified retinas or tissue culture cells increases the likelihood of identifying robust changes. Initial bioinformatic analysis was performed using the Gene, Online Mendelian Inheritance in Man (OMIM) and PubMed databases (NCBI), and the RetNet database (RetNet). Gene lists were submitted to the Database for Annotation, Visualization and Integrated Discovery (DAVID) v6.7 [51,52] to identify functional categories that were overrepresented in each gene list. Functional categories that gave a Benjamini-Hochberg procedure corrected p value of <0.01 are presented as significantly overrepresented in each of the gene lists compared to what would be expected from the same number of randomly selected genes by chance.
Gene density calculations (gene location analysis)
Gene positions were translated into ranks along the chromosomes to allow to detect clustering without bias from varying intergenic distances. The differences in ranks were calculated for the genes located on each chromosome and averaged using the median. The medians were compared against the median averages of 1,000 randomly selected sets of genes, with the gene sets the same size as the up- and downregulated lists. Box plots were generated in R to visually compare the average distance of the genes from the two lists with the average distances from the random lists [47]. One sample t test was performed in R to check for significance in the differences between the mean of the random averages and the averages obtained from the retinal gene lists.
Promoter analysis
The Affymetrix probe IDs were taken from the lists of genes upregulated or downregulated in the Rho-eGFP FACS +ve versus Rho-eGFP –ve samples. The probe list was matched via the Biomart to Ensembl transcripts. These transcript IDs were used to extract the 2,000 bp upstream region of the transcription start site (TSS) via Biomart. With a tool called find_pssm_dna provided by the EBI, these sequences were searched for the Crx and Nr2e3 binding sites, which were retrieved as positional frequency matrices from Jaspar [53]. A probability of p<0.001 against an empirical estimate of nucleotide frequency background distribution [54] for 2,000 bp upstream of the TSS in mouse was used to refine the results. The p value of <0.001 is related to the low probability of these nucleotides occurring by chance. For each gene listed, the top-scoring site from all of the transcripts was extracted to an Excel spreadsheet (Appendix 3). A combined score for both transcription factors (TFs) was calculated by simple adding the top scores from each TF (an exact match to the consensus sequence gives a score of 100%). Using the composite 75% score as the cutoff identified 365 upregulated genes and 385 downregulated genes as likely to be regulated by Crx and Nr2e3 (supplementary data file 3). The cutoff value of 75% was chosen since the recommended value of 80% resulted in the loss of rhodopsin (known to be regulated by Crx and Nr2e3) from the data set and was therefore considered overly stringent.
GEO
All data have been submitted to GEO ([55]) in accordance with MIAMI standards [56,57]. The GEO accession number for this data set is GSE59201. Finally, the listed genes of interest from this study were compared with those obtained from other relevant retinal gene expression studies [16,32-42].
Q-PCR
Primers were designed to amplify fragments of 120–250 bp, with shorter fragments preferred. Introns were included in amplified segments where possible, to prevent amplification of genomic DNA. Primers were designed using PrimerBlast with an optimal Tm of over 60 °C (the temperature of the amplification step). RNAs were diluted 1/100 fold for the RPC and whole retinal samples, and 1/50–1/25 fold for the FACS-derived RNA samples (depending on the starting concentrations). Q-PCRs were performed using RNA with the two-step QuantiTect kit (Qiagen) as described previously [15,58]. Q-PCRs were assembled on 96 well plates (Applied Biosystems, Paisley, UK) and run on 7300 and 7500 series q-PCR machines (Applied Biosystems). The ΔΔCt method was used to calculate fold changes, using beta-actin as a housekeeping standard and the P1 retina as the calibrator. The q-PCRs of the retinopathy genes (Crx, Nrl, Nr2e3, Rho) were included in analysis to check that our qPCRs accurately represented their known expression patterns. Primer sequences are noted in Table 1. The samples were run in triplicate, and at least three biologic replicates were performed, giving total replicates of at least nine. Adult retinal samples were also included in q-PCRs as positive controls; water blanks and no-RT controls were also run. Error bars were calculated via standard error of the mean (SEM). Results were also analyzed using Student t tests.
Table 1. Primer sequences for primers used in q-PCR.
| Primer name | Sequence | Primer name | Sequence |
|---|---|---|---|
| A530058N18RikR: |
CCACCTTGACACAGGCTGGA |
Lrp4F |
TTCCAGTGCTGGTGTGAAGC |
| A530058N18RikF: |
CCGCAGGAGGAACAGACACA |
Lrp4R |
CGGTGATGAAAGTCGAGGGC |
| Arr3F |
CTGGATGGCAAACTCAAGCA |
MitfF |
GATGGACGATGCCCTCTCAC |
| Arr3R |
AGGAGATGGCTTTGGATGGA |
MitfR |
CTGGGCTACTGATAAAGCACGAA |
| B9d1F |
GTACGGCAAGCACTGGTGTG |
Neurog2F |
GCAGCGCATCAAGAAGACCC |
| B9d1R |
GAGAGAGGGGCACATGCACT |
Neurog2R |
GTAATTGTGGGCGAAGCGCA |
| BC022687F |
AGGGTCATGTCCTGGAAGGT |
NfiaF |
TCACCGACCTACTCGACACC |
| BC022687R |
AGGTAATCAGGCTGCCCTGT |
NfiaR |
GGTTGAGGTTGCGTCCATGT |
| BC027072F |
GTCCCGCTCAGACTGGGAAT |
Nr2e3F |
TTGGGAAATTGCTCCTCCTG |
| BC027072R |
CCCTGCAGTTCTGGGACTCT |
Nr2e3R |
CCTGTGGACACTTGGCACTC |
| B-actin F |
CCACCATGTACCCAGGCATT |
Nr6a1F |
TCCTGCTCTCCTCCCTCACA |
| B-actin R |
ACAGTGAGGCCAGGATGGAG |
Nr6a1R |
GCATGCGTACTCCTCGTTGC |
| Bin1F |
GGCGATGTGGTGTTGGTGAT |
NrlF |
ATGCAAGTGGATTGGAGGAG |
| Bin1R |
TCTTCACACTCGGGAAGGCT |
NrlR |
CATGGCAACTGTGAGACCTG |
| Cdk2ap2F |
TCCCTACAGCCGGGAGTGTC |
NsfF |
TCCCTGCAGATGGATCCTGA |
| Cdk2ap2R |
ACAGCAGGTCCGTGTAGGTG |
NsfR |
CATCTGCACCTTGGTCGCTT |
| Chx10F: |
AAGGAGCCATGTTGGACTGA |
Otx2F |
GGTCCATCAACCAGCAACCT |
| Chx10R: |
GCCTGGGAATACAGGAGCAG |
Otx2R |
ACACCGGATCACCTCTGCTT |
| Cnga1F |
TTGGGAGAAAGAGTCGTCTG |
Pax6F |
GAGAAATGGCGGTTAGAAGCA |
| Cnga1R |
GAACATCGGTGGGGAAGAAA |
Pax6R |
CAACCACATGAGCAACACAGA |
| CrxF |
TCTTCCGTAAAGGTGCTGAGA |
Plagl1F |
CGAAGGCTGAGTGTGGCAAA |
| CrxR |
TGCTGGGATTATGACCATTGA |
Plagl1R |
TCGTCACACGCGTAGGAGAT |
| Dleu2F |
CTGGAGAGCTCGCCCAGAC |
Ppargc1aF |
TACACCTGTGACGCTTTCGC |
| Dleu2R |
CCAATGCATTACATGGGCATTCA |
Ppargc1aR |
TCTTGGTGGAAGCAGGGTCA |
| Eno2F |
AGGAGTTCATGATCCTCCCAGT |
PtgdsF |
GCATCCACTCCGTGTCAGTG |
| Eno2R |
TGGCTTCCTTCACCAGCTCC |
PtgdsR |
CTGGGCCTTGCTAAAGGTGG |
| Epb4.1l2F |
GTCGGTCACAAGGGTGGTAG |
RhoF |
CTGAGGGCATGCAATGTTCA |
| Epb4.1l2R |
TGGAGTAGTGGTACGGCGTT |
RhoR |
CATAGCAGAAGAAGATGACG |
| Fgf9F |
GAAAGACCACAGCCGCTTCG |
RtbdnF |
TGGAGAGAGAGGCTGTGAGC |
| Fgf9R |
AGAGGTTGGAAGAGTAGGTGTTGT |
RtbdnR |
TGGAGACGTTGAGGCAGTGA |
| Fgf13F |
CTACCGTCAGCAGCAATCCG |
SamD11F |
CTAGGGCCTGCCCTCAAGAT |
| Fgf13R |
CCAGATCGGGAGAACTCCGT |
SamD11R |
CCTTCATACGGGGAGGTGGT |
| Fgf15F |
GCGGACGGCAAGATATACGG |
Sema7aF |
GGCTTCTGCTGGTGTTCTGG |
| Fgf15R |
TCCTGGAGCTGTTCTCTGGG |
Sema7aR |
CGGCTCATGGAAAAGCACGG |
| Foxo1F |
GCCACTCGCGGGACAG |
Shisa2F |
CAGACCGAGAAGGCCCAGA |
| Foxo1R |
AGTAGGGCACGCTCTTCACC |
Shisa2R |
TCTGCTGGGGATCCTGCTTT |
| Glo1F |
TGGGATTGCCGTTCCTGATG |
Slc25a33F |
CTCCTGCATCGCTTACCCAC |
| Glo1R |
CCTCAAAGGCACATTCTCCCG |
Slc25a33R |
CAGTCCTCGGTAGAAGGCGA |
| Igsf9F |
GGCCAGGGTCAGGTGCAA |
Sox2F |
CTAGACTCCGGGCGATGAAA |
| Igsf9R |
AGTTGACTGTACTGTTGCTGGG |
Sox2R |
TGCCTTAAACAAGACCACGAA |
| Kcnk1F |
CGTGTTCTCTGTGCTGGAGG |
Stx3F |
GGATGAAGGACCGGCTGGAG |
| Kcnk1R |
CAACCAGCATGGCGATGAGT |
Stx3R |
AGCCGTGTTTCCTCGATCTCA |
| Kif9F |
CATGACAGGGGCAACGGAGA |
Vopp1F |
GCCACCACTCATTGAGGAGC |
| Kif9R: |
AGGGCAGAGTGGACAGGAGA |
Vopp1R |
GCCTCCGTGAGGTGAATTGG |
| Klc3F |
AACAACCTGGCCTCAGCCTA |
Vsx2F |
CTGTGCCCCATGGCTACTG |
| Klc3R | TCCTCGCCTGATGGATTCCC | Vsx2R | CCGTTCCTCCTGCTCCATCT |
Results
Transplantable photoreceptor precursors, which peak in transplantation efficiency from P3–6, are post-mitotic [15-18,20]. To assay gene expression changes leading to photoreceptor differentiation, microarray analysis was used, with comparisons of P5 retinal Rho-eGFP-positive and -negative cells, whole retinal samples at P1 and P5, and cultured RPCs, which have lost the potential to become photoreceptors [15,20]. Rho-eGFP-positive cells represent rod photoreceptor precursors, while Rho-eGFP-negative cells represent other differentiated neuroretinal cell types and any remaining unspecified cells. Up- and downregulated gene lists (Appendix 2) were derived from the Rho-eGFP-positive and -negative array data, giving a comprehensive list of genes significantly differentially regulated in recently specified rod precursors. Given the potential error associated with RNA amplification [50], this gene list was compared with lists derived from two-way comparisons of array data from unamplified RPCs, P1 and P5 retinal RNA. Genes differentially regulated in at least three out of four comparisons (Rho-eGFP positive versus Rho-eGFP negative, RPCs versus P1 retinas, RPCs versus P5 retinas, P1 versus P5 retinas) were prioritized (Table 2, Table 3, Table 4, Table 5). Notably, these data represent a unique comparison of retinal samples around the time of rod genesis with cultured RPCs, which have lost photoreceptor potential [15-18,20]. However, FACS-purified Nrl-eGFP, Crx-eGFP, and Rho-eGFP cells have previously been arrayed [16,33,34], to identify cell surface proteins suitable for antibody-based FACS of non-genetically modified cells, or to establish cone precursor expression patterns.
Table 2. Genes upregulated in rods, as determined by upregulation in FACSed Rho-eGFP positive cells and expression changes in at least 2/3 other comparisons (RPC versus pn1, RPC versus pn5, pn1 versus pn5).
| Upregulated genes. | Upregulated + Neighbours | ||||
|---|---|---|---|---|---|
| 0610010O12Rik |
Epn2 |
Pax7 |
Abcg4 [32] |
Lztfl1 |
Samd11 [31,35] |
| Abhd5 |
Eps8 [32] |
Pcdh15 [16,32,38,42] |
Acsl1 |
Mak [31,34,35] |
Sec14l2 [34] |
| Abhd14b |
Fam107b |
Pias3 [31,34] |
Agtpbp1 [31,32] |
Mdm1 |
Sema7a [16] |
| Acadvl |
Fam60a |
Pip4k2c |
Aipl1 [35-38] |
Mpp4 [32,35] |
Shisa2 [42] |
| Aco2 [31] |
Galnt4 |
Pla2g5 |
Amy1 |
Mrpl49 [31] |
Slc12a5 |
| Ahr [37] |
Galt |
Pla2r1 [16,32,42] |
Ankrd33 [31,37] |
Mtfp1 |
Slc19a1 |
| Akap1 [31] |
Gdpd5 |
Plagl2 [32], |
Arl6 [38], |
Mthfr |
Slc25a33 |
| Aldoc |
Glmn [31] |
Plekha2 [16] |
Bbs9 [16,32,38], |
Ndrg1 [31,37] |
Slc27a2 |
| Alpl |
Hif1a [32] |
Plekhf2 |
BC027072 [35], |
Nr2e3 [31,34-36,38,40] |
Snap25 [16,31,36,38] |
| Apobec2 |
Hsp90aa1 [31] |
Plxna2 |
C1ql3 |
Nrl [31] |
Spint2 |
| Arhgap24 |
Hspa41 [31] |
Ppargc1a |
Cdhr1 [34] |
Nsf |
St6galnac2 |
| Arl4a |
Htra1 [38] |
Ppargc1b [32] |
Cdk5r2 |
Nxnl2 [35] |
Stx3 [31,42] |
|
BC022687 |
Ift80 |
Ppp2r5c |
Cep290 [38] |
Pdc 31 [30,36,38] |
Stxbp1 [31] |
| Bcar3 |
Ift88 [31] |
Prr14 |
Chga [31] |
Pde6b [16,30,31,34-38,40] |
|
| Bicd2 |
Laptm4b |
Rbpms |
Ckmt1 [32] |
Pde6g [16,31,32,34-36,38,40] |
|
| Bin1 [33] |
Lass4 [31] |
Reep6 [36,40] |
Clstn1 [16,42] |
Pitpnm1 [31] |
Syngr1 |
| C1qtnf4 |
Lmo1 |
Rpl31 |
Cnga1 [16,34,36,38,40,42] |
Podxl [16,31,34,42] |
|
| Cadm1 |
Lrp4 [16,34,42] |
Scamp5 |
Cplx3 |
Ppef2 |
Sys1 |
| Camk1d [31] |
Madd |
Sh3bgrl2 |
Crx [33,35,38,40] |
Prickle1 [31] |
Tbc1d8 [34] |
| Camkk1 |
Map4k3 [31] |
Slc25a5 [31], |
Crxos1 [39] |
Prkab1 [31,32] |
Tob2 |
| Capn7 |
Mat2a [31] |
Slc44a1 |
Dalrd3 |
Prom1 [16,31,34,38,40,42] |
Ttc8 [16,38,40] |
| Ccdc72 |
Me1 |
Slc4a7 |
Doc2b [31] |
Ptp4a3 [16,31] |
Tub [31,32] |
| Ccng1 [31] |
Med16 |
Snca [16] |
Elovl4 [31,38] |
Ptpn21 [31,32] |
Tulp1 [31,33,35,38,40] |
| Cd276 |
Mef2d [31,33] |
Snrk [31] |
Eml3 |
Rab28 [16,31] |
Uckl1 [32] |
| Cdh13 [16], |
Mlf1 |
Ssx2ip [31] |
Eml5 |
Rbp3 [31,34-36,38-41] |
|
| Cdk2ap2 |
Mmd |
Strbp |
Eno2 [16,31] |
Rcvrn [16,31,36,37] |
|
| Cltb//LOC100046457 |
Mtap7 |
Sugp2 |
Flcn |
Rd3 Sie [32] |
Unc119 [31,32,36,38,40] |
|
Cngb1 [35,36], |
Mtch2 |
Supt16h |
Frmd4b [31] |
Rdh12 [32,34,35,38,40] |
|
|
Cngb3 [16,32,36,38,40,42], |
Mtfr1 [16] |
Suv39h2 |
Gnat1 [31,32,36-38,40] |
Rho [16,30-32,34-38,40,42] |
|
| Cnnm2 |
Mylk [31] |
Syp [31,36,38] |
Gnb3 [31,32,36] |
Rhpn1 |
Vldlr [31] |
| Cpt1a |
Myo6 |
Tdrd7 [31] |
Gngt1 [16,31,34-36] |
Rom1 [31,35-38,40] |
|
| Crnkl1 |
Naaa |
Tle2 |
Gulo [36,40] |
Rp1 |
Vopp1 |
| Cst3 [31] |
Nap1l1 |
Tmem135 |
Hcn1 [38] |
Rpgr [32] |
Zranb1 |
| Ctbp2 [31] |
Napg |
Tmem216 |
Icmt [31] |
Rpgrip1 [31, 32, 34, 38-40] |
|
| Dctn1 [31] |
Nfic [37] |
Tmem30a [31] |
Impdh1 [32,38] |
Rraga |
|
| Dhrs3 |
Npnt |
Tmem42 |
Kcnb1 [31,37] |
Rs1 [31,32,34,35,38,40] |
|
| Dlg4 [16,37] |
Nt5e [16,34] |
Tmem9 [31] |
Klc3 [31] |
Rtbdn |
|
| Dnm1 |
Nxnl1 [40] |
Tpp1 |
Krt18 |
Rxrg [30] |
|
| Dnmt3a [31] |
Oat [38,40] |
Trim3 |
Llgl2 [34] |
Sag [31,34-36,38,40] |
|
| Ebpl |
Osgep [40] |
Uqcr11 |
Lpgat1 [31,37] |
|
|
| Epb4.1l2 [31] | Paqr4 | Vamp2 | Lrrc48 | ||
Genes in bold and italic are listed in RetNet, those identified in other studies are indicated by the relevant reference number in red. Overlaps with the Neighbors data set are listed separately
Table 3. Genes downregulated in rods, as determined by downregulation in FACSed Rho-eGFP positive cells and expression changes in at least 2/3 other comparisons (RPC versus pn1, RPC versus pn5, pn1 versus pn5).
| Downregulated genes. | ||||
|---|---|---|---|---|
| 1110002B05Rik |
Dbn1 |
Itgb1 |
Pip4k2a |
Spred1 |
| 1190002N15Rik |
Dkk3 [31] |
Itm2c |
Pkia [31] |
Srgap3 |
| 2700094K13Rik |
Dpysl4 |
Kcnmb4 |
Plagl1 [37] |
Sri [32] |
| 41160 |
Dpysl5 |
Kctd17 |
Ppap2b |
St14 |
| 6330527O06Rik [31] |
Ebf1 |
Kdr |
Ppic |
St6galnac5 |
| Abcd2 [39] |
Epdr1 |
Khdrbs3 |
Ppp1r14b [31] |
St8sia2 |
| Adam12 |
Epha3 |
Klhl13 |
Pros1 |
Stmn2 |
| Agap1 |
Evl |
Laptm4a |
Ptgds |
Stmn4 |
| Aif1l |
F2r |
Ldb1 [32] |
Ptn |
Sulf2 |
| Aldh2 |
Fads1 |
Lgr5 |
Ptprk |
Tcf7l1 |
| Ank3 [32] |
Fam19a5 |
Limk1 |
Ptprz1 |
Tcf7l2 |
| Ankrd43 |
Fbxw7 |
Litaf [31] |
Qk |
Tcfap2a |
| Anxa5 |
Fezf2 |
Lrp1 |
Rab31 |
Tcfap2b |
| Arhgdia |
Fgf13 |
Lrrn1 |
Rai14 |
Tcfap2c |
| Arrb1 |
Fgf15 |
Magt1 |
Rap2b |
Tiam1 |
| Ass1 |
Fgf9 |
Map4k4 [31] |
Rftn2 |
Timp2 [31] |
| Astn1 |
Fgfr1 |
Mapk6 [31] |
Rgl1 |
Tmeff2 |
| Atp2b2 |
Fgfrl1 LOC100046239 |
Marveld1 |
Rgs2 |
Tmem43 |
| Auts2 [32] |
Fjx1 |
Mdk |
Rnasel [31] |
Tmtc4 |
| B2m |
Fkbp7 |
Mfge8 |
Rnd3 |
Tnfrsf21 |
| Basp1 LOC100045716 |
Fkbp9 |
Mllt11 |
Rrh |
Tor1aip2 |
| Bcl11a |
Foxn4 |
Mmp2 |
Rrm2 |
Tpbg |
| Bhlhe22 |
Ftl1/2/Gm10116 |
Mpp3 |
Rsu1 |
Traf4 |
| Cadps [31] |
Fuca1 |
Msn |
Rtn4 [31] |
Tspan14 |
| Capn2 |
Fyn |
Mt1 |
Sash1 |
Vim |
| Cartpt |
Gad2 |
Mtap6 |
Sat1 [31] |
Ywhag [37] |
| Cat |
Gm3932 |
Myadm |
Scd2 [37] |
Zbtb12 |
| Cbx2 |
Gng3 |
Myb [30,37] |
Sema4d |
|
| Ccng2 [31] |
Gp1bb |
Ncan |
Sepp1 |
Downregulated |
| Cd151 [39] |
Gpc1 [31] |
Ndrg4 |
Serpine2 |
+ Neighbours |
| Cd9 |
Gpc3 |
Neurod4 [30,33,37] |
Serping1 |
Cmtm7 |
| Cdc42se1 |
Gpr37 [31] |
Nfia |
Serpinh1 |
Darc |
| Cfl1 [30] |
Gpr56 |
Nfib [35] |
Serpini1 |
Ebf3 |
| Chn2 |
Gprc5c |
Nfix [31,35] |
Sfxn1 |
Efnb2 [37] |
| Chodl |
Grb10 |
Ngfr |
Sgk3 |
Elavl3 |
| Cnot2 [35] |
Grn |
Nhsl1 |
Sh3bp4 |
Hmx1 |
| Cntnap2 [32] |
Gstm1 |
Nme2 |
Six3 |
Kcnk1 |
| Col18a1 |
H19 [35] |
Notch2 |
Skap2 |
Kif5c [32] |
|
Col2a1 [38,40] |
H2afy2 |
Npc2 |
Slc1a3 |
Klc1, LOC100047609 |
| Crabp1 |
Hbb-b1/Hbb-b2 |
Olfm1 [32] |
Slc1a4 |
Meg3 |
| Crmp1 |
Hkdc1 |
Olig2 |
Slc32a1 |
Pmepa1 |
| Crym [41] |
Hmgb2 [37] |
Pak1 |
Smad2 |
Rian |
| Csnk1e |
Ier5 |
Pax6 [30,31] |
Smarce1 |
Stmn1 |
| Csrp1 [37] |
Igfbp2 |
Pbxip1 |
Socs2 |
Tbx2 |
| Ctsc |
Il17ra |
Pcp4 |
Sox5 |
Vsx2 |
| Cyp26a1 |
Ina |
Pcyox1 |
Sox6 |
Zfp532 |
| Dag1 |
Isl1 [31,37] |
Pdlim5 |
Sparc [31] |
|
| Dbi | Itgav | Phlpp1 | Spc25 | |
Genes in bold and italic are listed in RetNet, those identified in other studies are indicated by the relevant reference number in red. Overlaps with the Neighbors data set are listed separately
Table 4. Genes differentially regulated in all comparisons of RPC versus pn1, RPC versus pn5, pn1 versus pn5 (but not significantly changed between FACS positive and negative samples).
| Differentially regulated genes | ||
|---|---|---|
| ENSMUSG00000063277 |
Grina |
Rbpms |
| 1200009O22Rik |
H3f3b [31] |
Rffl |
| 1700020C11Rik [31] |
Hba-a1, Hba-a2 [31] |
Rnmt |
| 1810009A15Rik |
Hist2h2aa1, Hist2h2aa2, Hist2h2ac, Hist2h3c1 |
Rpl19 |
| 2310028O11Rik |
Hmgn1 |
Sdha |
| 2310044H10Rik |
Hsd17b4 |
Sfrs14 [31] |
| 2410017P09Rik |
Hspe1 |
Snrnp40 |
| Acadl |
Jam2 [31] |
Snrpn /// Snurf [37] |
| Ak3l1 /// LOC100047616 |
Lhx9 |
Sox6 |
| Asf1a |
LOC100044115, Rin2 |
Sub1 |
| Atp5k |
LOC100044139, Snrpn, Snurf |
Tspan31 |
| Banf1 |
LOC100045551, Ppm1d |
Tspan7 |
|
BC016201 [31] |
LOC100046232, Nfil3 |
Tuba1a |
| Cadm3 |
LOC100046704, Nras |
Txn1 |
| Calb1 |
LOC100047393, Nae1 |
Uba2 |
| Chrna6 |
LOC677317, Me1 |
Ube2d2 |
| Cox6b1 |
Mcm7 [30] |
Ube2e1 |
| Cox7c, LOC100047065, LOC100048613 |
Mdfic |
Vsnl1 [31] |
| Cplx3 |
Med19 |
|
| D0H4S114 |
Ndrg1 [37] |
Diff regulated + Neighbours |
| Dab2ip |
Ndrg4 |
Otx2 [30,34] |
| Deb1 |
Ndufa6 [31] |
Stxbp1 [31] |
| Dohh |
Nlk [31] |
|
| Eef1b2 |
Notch4 |
|
| Eef1g, LOC100047986 |
P4hb |
|
| Extl3 |
Pcdhga1-12, Pcdhgb1-8, Pcdhgc3-5 [31] |
|
| Fam108a |
Phactr1 [31] |
|
| Fam125a |
Phb |
|
| Fkbp3 |
Pip5k1a |
|
| Gba2 |
Pkig [31] |
|
| Gdpd5 |
Pnkd |
|
| Glo1 [31] |
Polr2e |
|
| Hist1h2bc, Hist1h2be, Hist1h2bl, Hist1h2bm, Hist1h2bp, LOC100046213 |
Prdx3 |
|
| Gm5256, Gm5529, Slc25a5 |
Prkar1b [31] |
|
| Gm6293, Uqcr10 |
Prnp [31] |
|
| Gm9800, Ptma | Psrc1 |
Genes in bold and italic are listed in RetNet, those identified in other studies are indicated by the relevant reference number in red. Overlaps with the Neighbors data set are listed separately
Table 5. Expression “neighbours” of well-known retinal and eye specification genes, as determined by t-SNE.
| Expression pattern neighbours of selected retinopathy genes | |||||
|---|---|---|---|---|---|
| 1110051M20Rik |
Crx [32,33,35,38,40] |
Gnat1 [31,36-38,40] |
Mpp7 |
Pstk |
Smarcd2 [31] |
| A530058N18Rik |
Crxos1 [39] |
Gnb1 [36,38,40] |
Mrpl49 [31] |
Ptp4a3 [16,31,32] |
Smpd2 |
| Abcg4 [32] |
D0Kist5 |
Gnb3 [31,36] |
Mtfp1 |
Ptpn21 [31,32] |
Snap25 [16,31,36,38] |
| Acsl1 |
D2Ertd63e |
Gngt1 [16,31,34-36] |
Mthfr |
Rab27a |
Snta1 [16,31] |
| Adcy7 |
Dalrd3 |
Grk1 [32,34,38] |
Ndrg1 [37] |
Rab28 [16,31] |
Spint2 |
| Agtpbp1 [31,32] |
Darc |
Gucy2e [42] |
Ndufv1 |
Rbks |
St3gal3 [32] |
|
Aipl1 [31,32,35-38] |
Dgke |
Guk1 |
Neurog2 [30] |
Rbp3 [31,35,36,38-41] |
St6galnac2 |
| Amy1 |
Dleu2 |
Gulo [36,40] |
Nme5 |
Rcvrn [16,30,31,36,37] |
Stk39 [31] |
| Ankrd33 [31,37] |
Dnaja4 |
Hcn1 [38] |
Nr2e3 [31,34-36,38,40] |
Rd3 40 |
Stmn1 |
| Ap1b1 [31] |
Doc2b [31] |
Heph |
Nr6a1 |
Rdh12 [32,34,35,38,40] |
Stx3 [31,42] |
| Ap2m1 [31] |
Dusp26 |
Hmx1 |
Nrl [31,34-36,38,40] |
Rho [16,30-32,34-38,40,42] |
Stxbp1 [31] |
|
Arl6 [38], |
Ebf3 |
Icmt [31] |
Nsf |
Rhpn1 |
Suv39h2 |
| B9d1 |
Efnb2 [31] |
Ift81 |
Nxnl2 [35] |
Rian |
Syngr1 |
|
Bbs9 [16,35,38], |
Elavl3 |
Igsf9 |
Otud7b |
Rnf157 |
Sys1 |
|
BC027072 [35], |
Elovl2 |
Impdh1 [38] |
Otx2 [33,38] |
Rom1 [30,31,35,36,38,40] |
Syt1 [16,32] |
| Btc [16,31,42] |
Elovl4 [31,38] |
Impg1 [35] |
Pax6 [30,31] |
Rp1 |
Tbc1d8 [34] |
| C1ql3 |
Eml3 [31] |
Itfg2 [31] |
Pdc [30,34,36,38] |
Rpgr [32] |
Tbx2 |
| Calml4 |
Eml5 |
Kcnb1 [31,37] |
Pde6a [30,32,35,36,38,40] |
Rpgrip1 [31,34,35,38-40] |
Tmeff1 |
| Camk2d [31] |
Endod1 |
Kcnk1 |
Pde6b [16,30-32,35-38,40] |
Rraga |
Tmem229b |
| Camsap1 [31,32] |
Eno2 [16,31] |
Kif5c |
Pde6g [16,30-32,34-36,38,40] |
Rs1 [31,34,35,37,38,40] |
Tob2 |
|
Cdhr1 [34] |
Eno3 |
Kif9 |
Pex11a |
Rsph9 |
Tox |
| Cdk5r2 |
Epb4.1l3 [31] |
Klc1 |
Pex5l |
Rtbdn |
Ttc8 [16,38,40] |
| Cep250 |
Ezh1 |
Klc3 [31] |
Pitpnm1 [31] |
Rxrg [36] |
Tub [31] |
|
Cep290 [32,38] |
Fabp4 |
Krt18 |
Pja1 |
Sag [31,34,36,38,40] |
Tuba4a |
| Chchd10 |
Fam132a |
Llgl2 [34] |
Pmepa1 |
Samd11 [31,35] |
Tulp1 [31,33,35,38,40] |
| Chga [31] |
Fam161a |
Lpgat1 [31,37] |
Podxl [16,31,34,42] |
Sec14l2 [34] |
Uckl1 |
| Chrna5 [16,42] |
Fam89a |
Lrp2 |
Ppef2 |
Sema7a [16] |
Unc119 [31,36,38,40] |
| Ckmt1 |
Fance |
Lrrc48 |
Ppm1b [31] |
Sez6 [16,42] |
Unc13b |
| Clstn1 [16,31,42] |
Fbrs |
Lztfl1 |
Ppp3cc |
Shisa2 [42] |
Vldlr [31] |
| Cmtm7 |
Flcn |
Magi2 16 |
Prdm9 |
Slc12a5 |
Vopp1 |
|
Cnga1 [16,34,36-38,40,42] |
Foxo1 [31] |
Mak [31,34,35] |
Prickle1 [31] |
Slc19a1 |
Vsx2 |
| Cplx3 |
Frmd4b [31] |
Mdm1 |
Prkab1 [31] |
Slc25a33 |
Vtn [31,32] |
| Cplx4 [16,34], |
Fyco1 |
Meg3 |
Prom1 [16,31,34,38,40,42] |
Slc27a2 |
Zfp532 |
| Crmp1 | Gdpd3 | Mpp4 [35] | Prr14 | Slc7a8 [16] | Zranb1 |
SGenes in bold and italic are listed in RetNet, those identified in other studies are indicated by the relevant reference number in red.
A shortlist of genes differentially regulated in at least three out of four comparisons was generated. These genes were divided into categories: 228 genes were upregulated in eGFP+ve samples, and differentially regulated in at least two other comparisons (Table 2), and 235 genes were downregulated in eGFP+ve samples, and differentially regulated in at least two other comparisons (Table 3). A further 92 genes were differentially regulated in all comparisons of RPCs and P1 and P5 retinas, but showed no differences between the two FACS-sorted samples, implying even expression across the neural retina at P5 (Table 4). Thirty-six retinal disease genes were contained in the upregulated gene set, while three appeared in the downregulated or differentially regulated gene lists. Disease genes listed in RetNet are highlighted in bold italics (Table 2, Table 3, Table 4, Table 5). Searches of the Gene, OMIM, and PubMed databases for each gene revealed that 61% of the total gene list remains unconnected with the retinal literature; a retinal function for 39% was noted.
To identify genes with expression patterns similar to those of known importance in the developing retina (e.g., Nrl, Crx, Rho), a further analysis method was deployed. Replicates for all genes represented on the array were used to generate a t-SNE probe plot, which reduced the 20-dimensional expression data for five sample sets (for which there are four replicates each) into a two-dimensional diagram (Figure 1). This allows visualization of the data set in such a way that neighbors of a given gene are those that show similar expression patterns in terms of their expression across 20 sets of array results. Key retinal genes (disease genes derived from RetNet) were mapped against the entire data set; RetNet genes are shown as black dots while others are noted in gray. Although some RetNet genes appear to be randomly distributed, a significant number are present in three clusters, which notably contain many disease genes known to be preferentially retinally expressed or to be retinal specific. Other genes within these clusters, which had not previously been associated with retinopathy, were listed. To enrich this list for genes specifically involved in rod development, those that did not show an up- or downregulated fold change of 2 or greater in the FACS comparison data set were then eliminated; the remaining 204 genes were selected for bioinformatic analysis (t-SNE neighbors, Table 5). Of these genes, 123 were also identified via differential regulation in at least three samples, while 81 genes were highlighted with t-SNE. Our t-SNE database is publicly available and searchable via input of a gene name (Entrez Gene ID; e.g., Rho for rhodopsin). A plot of its expression neighbors is then shown (t-SNE).
Figure 1.
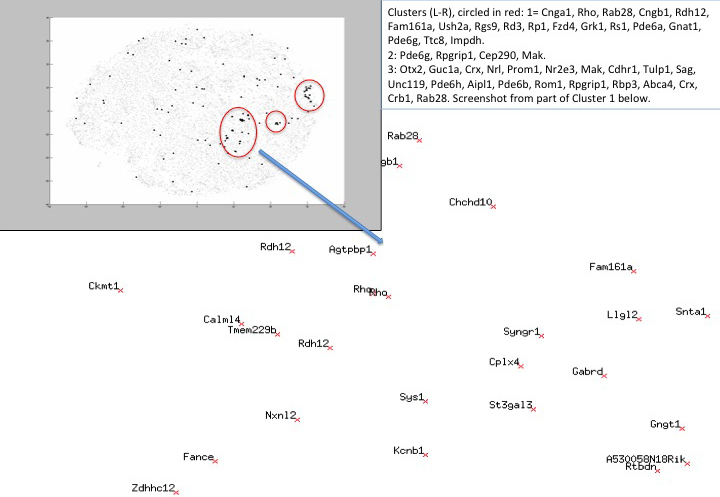
t-SNE map of gene expression patterns per gene for the whole data set. Retinal disease genes (RetNet) are highlighted in black; other genes are shown in gray (top left-hand corner). Three clusters of retinal disease genes are highlighted; the closest neighbors of the listed genes were selected for further study. The background shows a close-up of the cluster containing Rhodopsin and its closest neighbors. Some genes are represented by multiple probes. These genes are usually clustered close to each other (e.g., Rho is shown twice at the center of the image). Any gene of interest can be located within the data set using the following link: t-SNE.
Confirmation of gene expression patterns
Retinal expression patterns indicated by the array were investigated in 42 genes via qPCR. Genes selected for qPCR included those with well-characterized roles in retinal development and disease (Rho, Nrl, Crx, Nr2e3), characterized genes with as yet unknown retinal functions, and relatively uncharacterized ESTs. The qPCR gene list included upregulated, downregulated, and differentially regulated genes and a number from the t-SNE neighbors list (Table 2, Table 3, Table 4, Table 5). The direction of expression change was confirmed in 94% of cases where unamplified RNA was used (P1 and P5 retinas, cultured RPCs), and in 90% of cases where amplified RNA was arrayed (Rho-eGFP-positive and -negative FACS samples), suggesting that the data set is robust. Notably, the amplified FACS samples showed a lower validation rate than the unamplified samples, thus supporting the approach of comparing the FACS-derived gene lists with unamplified retinal samples for gene prioritization. Representative q-PCR results are shown in Figure 2; complete q-PCR results are given in Appendix 4.
Figure 2.
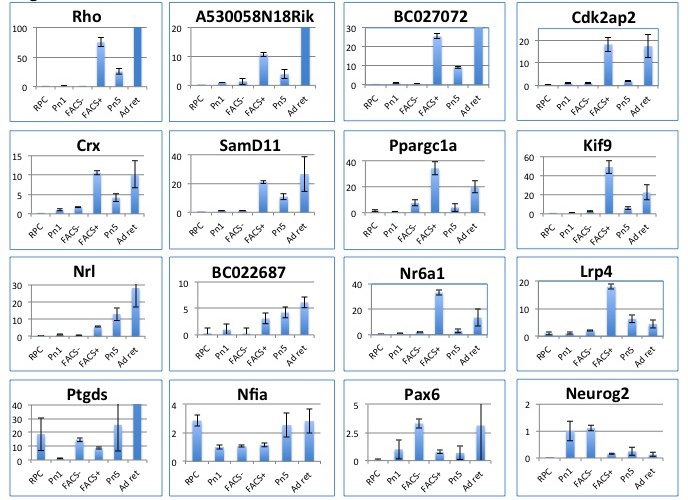
Q-PCR confirmation of expression pattern changes, selected genes. X-axis: samples; RPC=RPCs, P1=P1 retina, FACS-=Rho-eGFP negative cells, FACS+=Rho-eGFP positive cells, P5=P5 retina, Ad ret=adult retina. Y-axis: normalized fold changes where P1 is set at 1. Since Rho-eGFP-negative cells are derived from all non-retinal cells other than rod photoreceptors, and do not represent a pure cell type, we have shown more genes upregulated in Rho-eGFP-positive cells; these are also more likely to be involved in retinitis pigmentosa (RP). This is not representative of the data set as a whole; numbers of up- and downregulated genes are approximately equal. The q-PCR data for all genes tested are shown in Appendix 4.
In silico analysis
The genes listed in Table 2, Table 3, Table 4, Table 5 were analyzed for known function, known disease-causing mutations in humans and model organisms, and possible retinal functions, using the Gene, OMIM, and PubMed databases on NCBI and RetNet. Forty-four of the genes identified were listed in RetNet as causing a retinopathy, the majority of which were present in the upregulated and neighbors data sets (Table 2, Table 3, Table 4, Table 5). Sixty-one percent of the genes in our data set have no known retinal function as assessed with a PubMed search; these genes present a significant resource for RD gene discovery, and for the understanding of retinal development. Further analysis was undertaken using DAVID [51,52] to identify overrepresented functional categories within our gene lists (see Figure 3). The upregulated and neighbors gene sets showed overrepresentation of a significant number of categories related to visual perception, and photoreceptor differentiation. Notably, genes relating to cilia were also overrepresented, suggesting that upregulation of ciliary genes occurs during the time period under investigation. Genes involved in cell projection and neuronal differentiation were also upregulated. The most significant categories in the downregulated list included developmental genes, transcriptional regulators, those involved in neurogenesis, axon guidance, cell-cell adhesion, cell motion, regulation of cell proliferation, and signal transduction. Genes differentially regulated between RPCs and whole retinas at P1 and P5 (but unchanged between Rho-eGFP-positive and -negative cells) show a different functional overrepresentation list, methylation, acetylation, chromosomal DNA binding, mitochondrial biology and cell adhesion, possibly reflecting differences between actively dividing precursors in culture (RPCs) and neurons gradually ceasing cell division, then maturing and generating greater connectivity between three-dimensional retinal layers.
Figure 3.
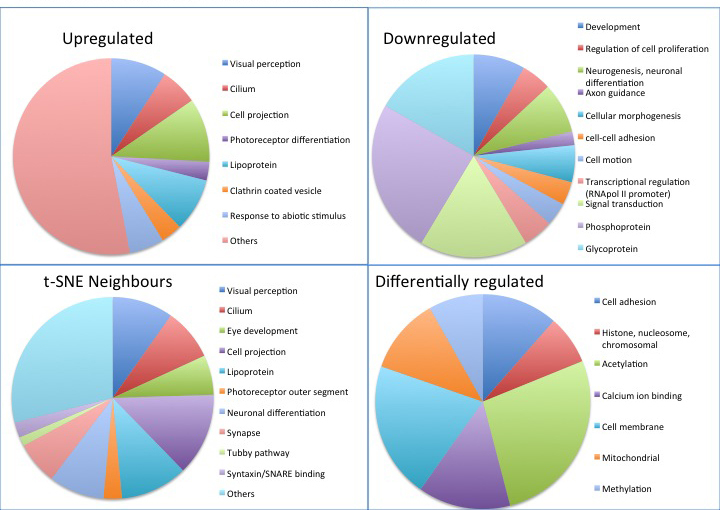
Functional breakdown of upregulated, downregulated, differentially regulated, and “neighbors” data sets. The differentially regulated data set represents genes differentially regulated in all comparisons of retinal progenitor cells (RPCs) versus P1, RPCs versus P5, P1 versus P5 but not significantly changed between fluorescence-activated cell sorting (FACS) positive and negative samples. Pie charts were generated in MS Excel from the categories most significantly overrepresented in each gene list (Benjamini corrected p value <0.01) as assessed with DAVID.
Promoter analysis
Promoter regions of genes upregulated in rod precursors were analyzed for common transcription factor motifs, using 2 kb immediately upstream of the TSS. Results indicate that motifs for 116 transcription factors are overrepresented in the data set, including Nr2e3 (Gene ID: 23958, OMIM: 604485; a nuclear receptor and rod photoreceptor transcription factor), Pax6 (Gene ID: 18508, OMIM: 607108) and Sox2 (Gene ID: 20674, OMIM: 184429; genes involved in eye specification that can cause anophthalmia and microphthalmia when mutated). A further study was undertaken, searching for the consensus binding sites for the photoreceptor transcription factors Crx and Nr2e3 in the 2 kb region upstream of the TSS of all genes either up- or downregulated in FACS-sorted photoreceptors. Crx controls expression in both rods and cones, while Nr2e3 is rod specific. These two transcription factors were chosen because their consensus binding sites were most amenable to analysis. Five hundred thirty-eight upregulated genes and 582 downregulated genes were identified as containing 75% of the maximum score for presence of Nr2e3 (rod-specific) and Crx (photoreceptor-specific) transcription factor binding sites in the 2 kb immediately upstream of the TSS (p<0.001 for each binding site, using the lower 75% limit suggested by oPOSSUM v2.0 [59] since the default 80% cutoff resulted in the loss of Rho and other genes known to be regulated by these transcription factors). This list represents genes more likely to be regulated by Crx and Nr2e3 (Appendix 3); those upregulated in Rho-eGFP-positive cells are likely to be preferentially expressed in rod photoreceptors. This data set was compared with a previously published study of genes dysregulated in Crx, Nr2e3, and Nrl null mice and containing Crx binding sites as determined with CHIP-seq. The prior study identified 6,000 genes with possible Crx binding sites, of which 734 were dysregulated in various retinal mutant mouse lines [32]. A comparison of that data set with this one shows an overlap of 68 genes in the upregulated list and 25 in the downregulated list [32], an overlap that comprises 13% of their data set and 8% of ours.
Genomic location of differentially regulated genes
The genomic locations of the genes in the FACS upregulated and FACS downregulated data sets (Appendix 2) were examined, to determine if there was any evidence for gene clustering in specific areas of the genome, suggesting some form of coordinated regulation, or whether the expression control mechanisms are coordinated irrespective of location. The median distance between neighboring genes on the same chromosome was calculated for the current data sets, and compared with the medians generated from 1,000 randomly generated data sets comprising the same numbers of genes. The results are provided in box plot format in Figure 4; the location of the genes in the up- and downregulated gene sets is outside the 95% confidence interval, suggesting non-random arrangement of genes in up- and downregulated gene sets. A one-sample t test yielded p values <2.2e-16 for the up- and downregulated lists. The 95% confidence intervals are Up: 22.43 to 22.53, Down: 19.1 to 19.18. In comparison, the eGFP-positive and -negative gene lists are at 17 and 15, respectively, clearly well outside the 95% confidence interval. These results are therefore unlikely to have occurred by chance and are probably the result of some degree of functional clustering or clustering as a result of ancestral gene duplication events.
Figure 4.

Gene location box plot: Randomly chosen gene sets of 1,175 genes (up) and 1,387 (down) were run 1,000 times, and a median intergenic distance across all of these runs was calculated. Intergenic distances are measured in terms of the average number of genes between any two neighboring genes located on the same chromosome (y-axis). The median and interquartile range (IQR) for the randomly selected gene sets are shown in the center of the box plots, with the whiskers showing 1.5× IQR. Outliers from the randomly generated gene sets are shown as black circles; our real data sets are indicated via red diamond and are more tightly clustered than would be expected by chance. A one-sample t test yielded p values <2.2e-16 for the up- and downregulated lists. The 95% confidence intervals are Up: 22.433 to 22.525, Down: 19.103 to 19.175.
Overlaps with other studies
Several previously published array and/or next-generation sequencing studies have been identified, aspects of which should theoretically overlap with the current study. These studies include developmental time courses using c57Bl6/J or Balb/C wild-type mouse retinas [30,31], genes that varied in expression between mouse strains during retinal development [39], expression profiles in the adult retina and in various adult retinal cell types [38,40], comparisons of the Otx2 null retina (which lacks photoreceptors) [35] and the RD1 retinal degeneration model, with wild-type [37], comparisons between Notch1 conditional knockouts, which overproduce rods, with wild-type retinas [41], comparisons of the “cone only” Nrl knockout retina with wild-type [36], CHIP-seq analysis of genes containing Crx binding sites [32], expression profiles of Rho-eGFP-positive and -negative retinal cells at P4 [16,42], comparisons of Nrl-eGFP-positive and -negative cells at P4 [34] and Crx-eGFP-positive and -negative cells at E17.5 [33]. The significantly differentially regulated gene lists from these papers were compared with those generated in this study to highlight genes identified in multiple experiments. Four hundred twenty-nine genes are uniquely identified in the current study, while 121 upregulated, 43 downregulated, 20 differentially regulated, and 99 neighbors genes have been identified in similar studies (due to the overlap between the neighbors data set and the others, the total number of genes in this study also identified elsewhere is 207, of which 73 were present in more than one other study). Retinal disease genes, especially those known to be rod specific, are highly represented in all studies with enriched populations of rod photoreceptors as would be anticipated. Interestingly, overlaps with prior adult retinal gene expression studies were also significant, given that this data set was generated using the developing retina. Overlaps are indicated (via reference number in red) in Table 2, Table 3, Table 4, and Table 5.
Discussion
This study presents several novel and potentially important findings. We have identified a large number of differentially regulated genes that may be important in rod and photoreceptor development. The retinal functions of approximately 60% of these genes are uncharacterized (although some can be inferred from known functions in other tissues and organs). The comparison of cultured RPCs with the P5 retinas from which the RPCs are derived is novel and has been valuable in pinpointing why cultured cells lose photoreceptor potential. This study has indicated that immature rods and the remainder of retinal neurons show non-random genomic locations of expressed genes, a novel finding that offers important inferences regarding the developmental control of neuronal gene expression and the evolutionary history behind this. The presence of Crx and Nr2e3 sites in up- and downregulated genes was corroborated by a previous study [32] but also offers important clues to the complexities of developmental gene expression regulation in retinal neurons. In terms of techniques, the t-SNE approach is novel regarding retinal samples and has not been widely used in array research to date. Although less comprehensive in terms of identifying every differentially regulated gene, t-SNE is a great method for identifying genes with similar expression patterns to known disease genes and may be useful in any genetic disorder where some, but not all, causative genes have been identified. We have also attempted to ameliorate bias via a comparison of whole retinal/tissue culture samples (unamplified RNA) with amplified RNA from FACS sorted immature rods (Rho-eGFP positive) and remaining retinal neurons (Rho-eGFP negative), a technique that has worked well in terms of allowing prioritization of interesting novel genes.
Using two different methods of analysis, 636 genes were identified that are differentially regulated in retinal and rod photoreceptor development. In searching for genes differentially regulated in multiple comparisons, or that closely resembled known retinal genes, the process was extremely rigorous. Comparison between FACS Rho-eGFP-positive cells (immature rods) and Rho-eGFP-negative cells yielded 3,320 genes with an adjusted p value of <0.01 and a fold change of greater than 2 or less than −2 (Appendix 2). This list was used for promoter and location analysis; but for in-depth evaluation, a subset of genes that also show expression changes between RPCs and P1 and P5 retinas was chosen, to minimize the risk of error introduced by RNA amplification, and therefore to reduce the number of false positives under investigation. However, using the priority gene list alone may result in numbers of interesting genes being left out of analysis owing to differential regulation not being detectable in whole retinas or RPCs, a risk that may be particularly high with transcription factors or other genes that may be expressed transiently or at a low level. Therefore, the larger data set is publicly available here (Appendix 2), via GEO (accession GSE59201), and via our searchable t-SNE database, as a resource for the retinal community. A large number of genes were investigated with qPCR to test the accuracy of the results. These included 43 genes identified by the array, and two genes important to visual specification or retinal biology that were not identified by the array. We included four genes involved in initial visual patterning: Pax6, Sox2, Mitf (Gene ID: 17342, OMIM:156845) and Otx2 (Gene ID: 18424, OMIM: 600037). These are induced so early in eye development that they were theoretically unlikely to be detected, but in fact, only Mitf was not identified as differentially regulated in any categories. Another gene, arrestin (Arr3; Gene ID: 170735, OMIM: 301770), was represented on the array and was massively upregulated in rods via qPCR, but was not detected by the array, probably as a result of an ineffective probe. Overall, 11/13 “known” visual genes for which we had preexisting primer sets were detected by the array and confirmed with qPCR, suggesting a “false negative” rate of approximately 15%.
Regarding the inability to derive functional photoreceptors from RPC cultures, it is significant that a large number of retinal disease genes and their neighbors, including transcription factors vital to rod development, are significantly downregulated in RPCs, many to the point of being undetectable with RT–PCR [15]. The 60% of genes with as yet uncharacterized retinal functions constitute a resource for further identification of genes that may be able to influence proportions of rods obtained from ES or iPS cell cultures, particularly those likely to function as growth or transcription factors. The growth of RPCs in Egf- and Fgf2-containing medium seems to be biasing development toward glial fates, including myelinating oligodendrocytes not normally found in the neural retina [19]; significant discovery of alterative mitogens may be required before RPCs can be persuaded to adopt neural fates after differentiation. However, Müller glia adopt their final differentiated status later than rods and are capable of limited cell division even in the adult retina. Postnatal retinas may contain neural precursors that are too terminally differentiated to offer an expandable source of any neuronal cell type; RPCs may represent a glial population only.
Use of t-SNE as an adjunct search tool for genes of interest has thrown up some interesting findings. t-SNE allows visualization of the 20-dimensional (5× samples, 4× replicates per sample) gene expression data per probe in two dimensions. Mapping the global expression data from our data set with RetNet disease genes overlaid (Figure 1) showed some clusters of retinal specific disease gene expression. Genes mapping within these clusters are expected to show similar expression patterns and may be candidates for retinal disease or have important retinal functions, or both. In the context of this experimental paradigm, the neighbors approach preferentially identifies genes upregulated in rod photoreceptors, as the nearby clustered RD disease genes are also upregulated in rods. The clusters are located within the same 20% area of the overall plot, suggesting that they should show some degree of similarity to each other, in addition to similarities within the clusters (Figure 1). QPCRs of the genes derived from the neighbors data set all show upregulation of expression in Rho-eGFP-positive cells and in the P5 retina regarding the P1 retina and RPCs (Figure 2; see neighbor pairs Rho + A530058N18Rik, Crx + SamD11, Nrl + BC022687). Notably, A530058N18Rik and SamD11 are uncharacterized genes with no retinal functions noted in PubMed to date.
The data set was used to interrogate whether genes upregulated (or downregulated) in rods, a homogenous neuronal cell type, possessed a non-random genomic location. In theory, coordinated regulation of such genes in the retina may involve positional clustering. Notably, 1,000 repeats of random assortments of gene groupings of the same size as our data sets gave median gene separation distances that were significantly different from the non-random array–based data sets generated in this study. For this analysis, the more extensive gene lists (those upregulated and downregulated in Rho-eGFP-positive rod precursors) were used. These data therefore provide some evidence for rod-specific gene expression being influenced by the genomic location of the genes, which are more tightly clustered than would be expected by chance (Figure 4). This is the first demonstration of such an effect in retinally expressed genes, but might be the expected result of evolutionary gene duplication and diversification of function as retinas became more complex.
We have generated up- and downregulated gene lists with a high probability of containing functional Nr2e3 and Crx binding sites. The identification of two different transcription factor binding sites, known to control gene expression in photoreceptors, in close proximity within 2 kb of the start site, represents significant evidence for regulation in photoreceptors. This list showed significant overlap with that obtained in a previous study, which identified greater than 6,000 genes containing Crx binding sites via CHIP-seq, of which 734 genes were dysregulated in Crx, Nr2e3, or Nrl null mice [32], and are therefore likely to be of functional significance. In the current study, an overlap of 93 mostly upregulated genes (which comprises 13% of their data set and 8% of the genes we identified as containing Crx and Nr2e3 binding sites) was identified. The differences between the studies may be partially explained by differing methodologies and by their use of Crx sites alone; Crx controls gene expression in cone and rod photoreceptors, not just rods, whereas Nr2e3 is rod specific. Given the presence of Crx binding sites in so many retinally expressed genes (>6,000), their findings suggest that the binding sites may be subject to complex regulation, including the negative regulation of some non-photoreceptor genes in photoreceptors [32]. The finding from this study of Nr2e3 and Crx binding sites in genes downregulated in rod precursors therefore correlates and enhances those results [32]. Alternatively, it may be that these binding sites are used for positive regulation at developmental stages not evaluated in either study.
Analysis of overrepresented functional categories within gene lists provided results that might have been anticipated. The upregulated and neighbors data sets showed the most significant overrepresentation of functions associated with vision, photoreceptor development and function, and ciliary function, suggesting elaboration of the photoreceptor cilium that connects the cell body with the outer segment is an important function of retinal progenitors at this stage. These data may pinpoint less-well-characterized genes in this data set as candidates for retinal ciliopathies. The downregulated data set shows overrepresentation of developmentally regulated genes, transcription factors and neuronal development, and axon guidance functions, possibly reflecting the fact that all other retinal neurons, at P5, have been specified for longer than rod photoreceptors [60], are post-mitotic, and are most likely pruning and optimizing connections with other parts of the retina at this point in time. Genes that vary between RPCs, and whole P1 and P5 retinas (without significant change between Rho-eGFP-positive and -negative retinal cells at P5) are evenly expressed across the whole neural retina at P5, but are up- or downregulated compared to an earlier developmental stage and compared to cultured RPCs, which are still dividing. This gene list shows overrepresentation of cell attachment, histone-related, acetylation, methylation, and mitochondrial functions. The retina at the points in time studied is in the process of specifying the chromatin structure to optimize gene expression in the configuration required by its maturing post-mitotic neuronal populations, while cultured RPCs are still dividing, lack organizational layers, and are comprised of glial progenitors. Notably, the retina requires more energy than almost any other tissue [1,58]. Speculatively, overrepresentation of mitochondrial genes might be related to retinal development, which is setting up to facilitate the high energy requirements of the mature retina, while RPCs in culture may have energy needs that are significantly lower.
Several other large-scale expression studies have been undertaken in retinas, both wild-type and genetically modified [16,30-42]. Overlaps with these studies total 207 genes (Table 2, Table 3, Table 4, Table 5). The most significant overlaps were noted with developmental studies, those where rod photoreceptors were enriched, and with the adult retina. Seventy-three genes were noted in two or more studies (these are noted in Table 2, Table 3, Table 4, Table 5; where two or more reference numbers are present beside the gene name). Many are key retinal disease genes (in italicized/bold font; Table 2, Table 3, Table 4, Table 5). Interestingly, some genes with relatively uncharacterized retinal functions were also noted in this category; the functions of a selected few are highlighted in Table 6. Retinal expression patterns indicated by the array were investigated in 42 genes via qPCR, ranging from known disease genes such as Rhodopsin, Nrl, Crx, and Nr2e3, to relatively uncharacterized ESTs. Eight of these genes showed high levels of upregulation in Rho-eGFP-positive cells (Figure 2), in addition to upregulation during retinal maturation and negligible expression in RPCs, all pointing to significant roles in rod function. Summaries of gene function for several of these genes are given in Table 7. In summary, many genes with uncharacterized retinal functions have been identified as important in retinal development by this study and others.
Table 6. Functions of selected genes also identified in other retinal array studies.
| Gene Title and symbol | Functions | Retinal functions | References |
|---|---|---|---|
| betacellulin, epidermal growth factor family member Btc |
Member of the EGF family of growth factors, synthesized primarily as a transmembrane precursor, which is then processed to mature molecule by proteolytic events. This protein is a ligand for the EGF receptor. Involved in propagating luteinizing hormone signalling through the ovary during ovulation. Constituent of bone marrow stem cell conditioned medium (BMSC medium), |
BMSC medium treated RPCs are more likely to favour neural differentiation.May also enhance RPC proliferation. Overexpressed in diabetic mice, may contribute to increased vascular permeability and vascular oedema, leading to diabetic retinopathy. |
Gene ID:685. OMIM 600345 [63,64]. |
| synaptosomal-associated protein 25 Snap25 |
Snap25 is a presynaptic plasma membrane protein involved in the regulation of neurotransmitter release. Neuronal exocytosis requires 3 SNARE proteins: synaptobrevin on the synaptic vesicle, and syntaxin and SNAP25 on the plasma membrane. Expressed in ribbon synapses from pn4, may be involved in their organization. |
Strongly expressed in horizontal cells. Thought to play role in photoreceptor development. Expressed in the Golgi complex of retinal neurons as well as involvement in synaptic vesicle release. It is located in the perinuclear compartment of retinal neurons |
Gene ID: 6616, OMIM 600322 [65-67], |
| complexin 4 Cplx4 |
Probable member of the complexin family, may be involved in synaptic vesicle exocytosis. Contains a C-terminal CAAX box motif for posttranslational prenylation. Expression is retinal specific, or restricted to eye and retina (databases). Expression seems to be localized to rod photoreceptor ribbon synapses. Positive regulator of synaptic transmission in mouse hippocampal neurons. |
Present in IPL and bipolar cell synapses. Double Cplx3/4 KO mice show behavioural responses suggestive of visual deficit and disordered ribbon synapses. Ganglion cell ON and OFF synapses also affected differentially. Essential regulators of neurotransmission at retinal ribbon synapses. |
Gene ID:339302 OMIM609586 [68,69]. |
| podocalyxin-like Podxl |
Member of the sialomucin protein family. Important component of glomerular podocytes. Other biological activities include binding in a membrane protein complex with Na+/H+ exchanger regulatory factor to intracellular cytoskeletal elements, playing a role in hematopoetic cell differentiation, and being expressed in vascular endothelium cells and L-selectin binding. Highest expression in kidney, pancreas and heart. Linked to ezrin and the actin cytoskeleton via Nherf2. |
Identified via array as a marker of early rod precursors which are capable of integrating into recipient retinas after transplantation. |
[31] Gene ID: 5420. OMIM602632. |
| calsyntenin 1 Clstn1 |
Isolated from brain cDNA library, expressed by >90% of neurons. Localized in post-synaptic membrane. Signalling may be by proteolytic cleavage. Expression raised in Alzheimers and Parkinsons samples decreased in neuroblastoma. Localized in organelles alongside microtubules, partially co-localized with kinesin. Organelles transported in a manner consistent with fast axonal transport. |
Unknown |
Gene ID: 22883 OMIM611321 [70,71] |
| cholinergic receptor, nicotinic, alpha polypeptide 5 Chrna5 | Nicotinic acetylcholine receptor subunit and a member of a superfamily of ligand-gated ion channels that mediate fast signal transmission at synapses. Defects in this gene have been linked to susceptibility to lung cancer type 2 (LNCR2), variants are associated with increased risk of nicotine addiction, a propensity shared with Chrna5 knockout mice. Evolution of this gene in primates has been faster than would be expected by chance, may be involved in the evolution of larger brains in humans. | Unknown | Gene ID: 1138. OMIM118505 [72,73]. |
Table 7. Functions of selected genes confirmed by qPCR (see Figure 2 and Supplementary Datafile 4 for associated qPCR results).
| Gene Title and Symbol | Functions | Retinal functions | References |
|---|---|---|---|
| low density lipoprotein receptor-related protein 4 Lrp4 |
Member of the low-density lipoprotein receptor-related protein family, may be a Wnt signaling regulator. Contains EGF like domain. Co-ordinates synapse formation at neuromuscular junctions. Mutated in Cenani-Lenz syndactyly syndrome and sclerosteosis. Knockout mice are growth retarded with fully penetrant polysyndactyly in their fore and hind limbs and partially penetrant abnormalities of tooth development. |
unknown |
Gene ID: 4038, OMIM604270 |
| A530058N18Rik RIKEN cDNA , A530058N18Rik |
No human homologue noted. Uncharacterised |
unknown |
Gene ID: 320846. |
| sterile alpha motif domain containing 11, SamD11 |
Relatively uncharacterised. May promote cell proliferation slightly. Evolutionarily conserved from zebrafish to human. High expression levels in mouse retina, but human SamD11 is more widely expressed. |
Mouse SamD11 is expressed in developing photoreceptors and the pineal gland; expression is controlled by Crx. |
Gene ID: 148398 [74]. |
| Cdk2ap2 CDK2-associated protein 2, Cdk2ap2 |
Interacts with cyclin-dependent kinase 2 associated protein 1. May be involved in self renewal regulation in ES cells; knockout ESCs showed an early differentiation phenotype, but embryoid bodies were unhealthy and showed high levels of apoptosis. Knockout ESCs were unable to form teratomas in SCID mice. |
unknown |
Gene ID: 10263 [75]. |
| peroxisome proliferative activated receptor, gamma, coactivator 1 alpha, Ppargc1a |
Transcriptional coactivator regulating genes involved in energy metabolism. Interacts with PPARgamma, permitting interaction with multiple transcription factors. It provides a direct link between external physiological stimuli and the regulation of mitochondrial biogenesis (particularly vital in the retina), and is a major factor regulating muscle fiber type determination. May also be involved in controlling blood pressure, regulating cellular cholesterol homoeostasis, and the development of obesity. Ppargc1a/Ppargc1b double knockouts show heart abnormalities. |
SNP associated with neovascularization in AMD. Regulates VEGF in the retina, is strongly upregulated during postnatal retinal development, and is necessary for normal retinal vascularization. Knockout mice have reduced retinal vasculature. Regulator of interneuron function, master regulator of metabolism in peripheral tissues. |
[76-78] Gene ID:10891 |
| cDNA sequence BC027072, BC027072 |
68% identity to human C2ORF71, which causes RP when mutated. Homology possibly not high enough to say this is definitively the mouse homologue. C2ORF71 causes digenic Usher syndrome when mutations in CEP250 are also present |
C2ORF71 is predominantly retinally expressed and localizes to the primary cilium of photoreceptor cells. Function otherwise uncharacterised. |
OMIM613425 [79-81]. |
| nuclear receptor subfamily 6, group A, member 1, Nr6a1 |
Orphan nuclear receptor, member of the nuclear hormone receptor family. Homodimerizes and binds DNA, but in vivo targets unidentified. High level expression in testis, promotes neural development in early embryogenesis via suppression of Oct4 |
unknown |
Gene ID: 2649 [82,83]. |
| kinesin family member 9 /// similar to kinesin family member 9, Kif9 | Expression downregulated during hippocampal development and upregulated during kidney development. Interacts with GEM and stabilised microtubules. Gem and Kif9 are responsible for the regulation of spindle length during mitosis. Spindle abnormalities are seen when either protein is downregulated. | Co-ordinated expression with Atoh1 during hair cell development in the inner ear; candidate gene for Usher syndrome? | OMIM607910. Gene ID: 64147 [84,85] |
In addition to use in identifying novel retinal genes and in monitoring expression patterns during development, this data set may be of use in identifying novel retinopathy genes. To date, a primary screen using NGS has indicated that just less than 50% of Irish patients with RD have mutations in one of approximately 200 known retinopathy genes (M. Carrigan, unpublished data). Other studies using similar strategies (NGS of known RD genes) have similar mutation detection rates of approximately 40–50% [61,62]. The array data set detailed herein may provide a second-tier NGS screen for those patients lacking mutations in known RD genes, in principle decreasing the cost and complexity of NGS from a whole genome screen to one covering a smaller cohort of genes implicated in photoreceptor development via various functional genomic studies. Clearly, identification of the mutated gene is a prerequisite for patient recruitment to relevant targeted gene therapy clinical trials. We anticipate that this data set will be of value in identifying novel retinal genes, some of which may be of use in expediting novel treatments for RP and related forms of RD.
Acknowledgments
Cell sorting was performed by Barry Moran in the Flow Cytometry Facility, Trinity College Dublin. This work was supported by grants from the MRCG (HRB and Fighting Blindness; FB11FAR) and SFI (grant ID). We thank Caroline Woods, Charles Murray, David Flynn, David and Rachel Sullivan and Brenda Campbell for technical assistance.
Appendix 1:
Python code used for the t-SNE searchable database. To access these data, click or select the words "Appendix 1".
Appendix 2:
Larger data set of genes identified as differentially regulated in a comparison of FACS derived Rho-eGFP positive and negative retinal cells at pn5. Genes shown have an adjusted p value of <0.01 and a fold change of less than −2 or greater than +2. Upregulated and downregulated genes are shown on separate sheets. To access these data, click or select the words "Appendix 2".
Appendix 3:
Genes derived from the Rho-eGFP +ve versus Rho-eGFP -ve gene list (see Appendix 2) containing Crx and Nr2e3 promoter binding sites. Up- and downregulated gene lists are shown on separate sheets. Genes containing Crx binding sites and dysregulated in Crx, Nrl, or Nr2e3 knockout mice [32] are highlighted in red font. Genes present in our more stringent lists are in bold and italic font. RetNet genes are underlined. To access these data, click or select the words "Appendix 3".
Appendix 4:
q-PCR results of all 42 genes tested, including original array results for comparison. Data are shown in both table and graph format. Column K lists which changes were noted as statistically significant via array, Column M notes whether these were confirmed or not (yes/no). t test results for Q-PCR are given in columns O and P. Values of p<0.05 were considered significant for q-PCR. The direction of expression changes were confirmed by Q-PCR for 90.5% of cases for FACS comparison of Rho-eGFP+ve versus negative cells, and for 94% of changes noted between pairs of unamplified samples. Significant changes via q-PCR t test were 88% and 91% of the same data sets. x-axis: samples; RPC=RPCs, Pn1=pn1 retina, FACS-=Rho-eGFP negative cells, FACS+=Rho-eGFP positive cells, Pn5=pn5 retina, Ad ret=adult retina. y-axis: normalized fold changes where pn1 is set at 1. To access these data, click or select the words "Appendix 4".
References
- 1.Farrar GJ, Chadderton N, Kenna PF, Millington-Ward S. Mitochondrial disorders: aetiologies, models systems, and candidate therapies. Trends Genet. 2013;29:488–97. doi: 10.1016/j.tig.2013.05.005. [DOI] [PubMed] [Google Scholar]
- 2.Farrar GJ, Millington-Ward S, Chadderton N, Mansergh FC, Palfi A. Gene therapies for inherited retinal disorders. Vis Neurosci. 2014;31:10–19. doi: 10.1017/S0952523814000133. [DOI] [PubMed] [Google Scholar]
- 3.Boye SE, Boye SL, Lewin AS, Hauswirth WW. A comprehensive review of retinal gene therapy. Mol Ther. 2013;21:509–19. doi: 10.1038/mt.2012.280. [DOI] [PMC free article] [PubMed] [Google Scholar]
- 4.Cideciyan AV, Aleman TS, Boye SL, Schwartz SB, Kaushal S, Roman AJ, Pang JJ, Sumaroka A, Windsor EA, Wilson JM, Flotte TR, Fishman GA, Heon E, Stone EM, Byrne BJ, Jacobson SG, Hauswirth WW. (2008. Human gene therapy for RPE65 isomerase deficiency activates the retinoid cycle of vision but with slow rod kinetics. Proc Natl Acad Sci USA. 2008;30(pp105):15112–7. doi: 10.1073/pnas.0807027105. [DOI] [PMC free article] [PubMed] [Google Scholar]
- 5.Cideciyan AV, Jacobson SG, Beltran WA, Sumaroka A, Swider M, Iwabe S, Roman AJ, Olivares MB, Schwartz SB, Komáromy AM, Hauswirth WW, Aguirre GD. Human retinal gene therapy for Leber congenital amaurosis shows advancing retinal degeneration despite enduring visual improvement. Proc Natl Acad Sci USA. 2013;110:E517–25. doi: 10.1073/pnas.1218933110. [DOI] [PMC free article] [PubMed] [Google Scholar]
- 6.Maguire AM, Simonelli F, Pierce EA, Pugh EN, Jr, Mingozzi F, Bennicelli J, Banfi S, Marshall KA, Testa F, Surace EM, Rossi S, Lyubarsky A, Arruda VR, Konkle B, Stone E, Sun J, Jacobs J, Dell'Osso L, Hertle R, Ma JX, Redmond TM, Zhu X, Hauck B, Zelenaia O, Shindler KS, Maguire MG, Wright JF, Volpe NJ, McDonnell JW, Auricchio A, High KA, Bennett J. (2008. Safety and efficacy of gene transfer for Leber's congenital amaurosis. N Engl J Med. 2008;22(pp358):2240–8. doi: 10.1056/NEJMoa0802315. [DOI] [PMC free article] [PubMed] [Google Scholar]
- 7.Bainbridge JW, Smith AJ, Barker SS, Robbie S, Henderson R, Balaggan K, Viswanathan A, Holder GE, Stockman A, Tyler N, Petersen-Jones S, Bhattacharya SS, Thrasher AJ, Fitzke FW, Carter BJ, Rubin GS, Moore AT, Ali RR. Effect of gene therapy on visual function in Leber's congenital amaurosis. N Engl J Med. 2008;358:2231–9. doi: 10.1056/NEJMoa0802268. [DOI] [PubMed] [Google Scholar]
- 8.Hauswirth WW, Aleman TS, Kaushal S, Cideciyan AV, Schwartz SB, Wang L, Conlon TJ, Boye SL, Flotte TR, Byrne BJ, Jacobson SG. Treatment of leber congenital amaurosis due to RPE65 mutations by ocular subretinal injection of adeno-associated virus gene vector: short-term results of a phase I trial. Hum Gene Ther. 2008;19:979–90. doi: 10.1089/hum.2008.107. [DOI] [PMC free article] [PubMed] [Google Scholar]
- 9.Simonelli F, Maguire AM, Testa F, Pierce EA, Mingozzi F, Bennicelli JL, Rossi S, Marshall K, Banfi S, Surace EM, Sun J, Redmond TM, Zhu X, Shindler KS, Ying GS, Ziviello C, Acerra C, Wright JF, McDonnell JW, High KA, Bennett J, Auricchio A. Gene therapy for Leber's congenital amaurosis is safe and effective through 1.5 years after vector administration. Mol Ther. 2010;18:643–50. doi: 10.1038/mt.2009.277. [DOI] [PMC free article] [PubMed] [Google Scholar]
- 10.MacLaren RE, Groppe M, Barnard AR, Cottrial CL, Tolmachova T, Seymour L, Clark KR, During MJ. Cremers FPM, Black GCM, Lotery AJ, Downes SM, Webster AR and Seabra MC Retinal gene therapy in patients with choroideremia: initial findings from a phase I/II clinical trail. Lancet. 2014 doi: 10.1016/S0140-6736(13)62117-0. [DOI] [PMC free article] [PubMed] [Google Scholar]
- 11.Smith AJ, Bainbridge JW, Ali RR. Gene supplementation therapy for recessive forms of inherited retinal dystrophies. Gene Ther. 2012;19:154–61. doi: 10.1038/gt.2011.161. [DOI] [PubMed] [Google Scholar]
- 12.Busskamp V, Picaud S, Sahel JA, Roska B. Optogenetic therapy for retinitis pigmentosa. Gene Ther. 2012;19:169–75. doi: 10.1038/gt.2011.155. [DOI] [PubMed] [Google Scholar]
- 13.MacLaren RE, Pearson RA, MacNeil A, Douglas RH, Salt TE, Akimoto M, Swaroop A, Sowden JC, Ali RR. Retinal repair by transplantation of photoreceptor precursors. Nature. 2006;444:203–7. doi: 10.1038/nature05161. [DOI] [PubMed] [Google Scholar]
- 14.Bartsch U, Oriyakhel W, Kenna PF, Linke S, Richard G, Petrowitz B, Humphries P, Farrar GJ, Ader M. Retinal cells integrate into the outer nuclear layer and differentiate into mature photoreceptors after subretinal transplantation into adult mice. Exp Eye Res. 2008;86:691–700. doi: 10.1016/j.exer.2008.01.018. [DOI] [PubMed] [Google Scholar]
- 15.Mansergh FC, Vawda R, Millington-Ward S, Kenna PF, Haas J, Gallagher C, Wilson JH, Humphries P, Ader M, Farrar GJ. Loss of photoreceptor potential from retinal progenitor cell cultures, despite improvements in survival. Exp Eye Res. 2010;91:500–12. doi: 10.1016/j.exer.2010.07.003. [DOI] [PubMed] [Google Scholar]
- 16.Eberle D, Schubert S, Postel K, Corbeil D, Ader M. (2011. Increased integration of transplanted CD73-positive photoreceptor precursors into adult mouse retina. Invest Ophthalmol Vis Sci. 2011;52:6462–71. doi: 10.1167/iovs.11-7399. [DOI] [PubMed] [Google Scholar]
- 17.Eberle D, Santos-Ferreira T, Grahl S, Ader M. Subretinal transplantation of MACS purified photoreceptor precursor cells into the adult mouse retina. J Vis Exp. 2014;84:e50932. doi: 10.3791/50932. [DOI] [PMC free article] [PubMed] [Google Scholar]
- 18.Barber AC, Hippert C, Duran Y, West EL, Bainbridge JW, Warre-Cornish K, Luhmann UF, Lakowski J, Sowden JC, Ali RR, Pearson RA. Repair of the degenerate retina by photoreceptor transplantation. Proc Natl Acad Sci USA. 2013;110:354–9. doi: 10.1073/pnas.1212677110. [DOI] [PMC free article] [PubMed] [Google Scholar]
- 19.Czekaj M, Haas J, Gebhardt M, Müller-Reichert T, Humphries P, Farrar J, Bartsch U, Ader M. In vitro expanded stem cells from the developing retina fail to generate photoreceptors but differentiate into myelinating oligodendrocytes. PLoS ONE. 2012;7:e41798. doi: 10.1371/journal.pone.0041798. [DOI] [PMC free article] [PubMed] [Google Scholar]
- 20.West EL, Pearson RA, MacLaren RE, Sowden JC, Ali RR. Cell transplantation strategies for retinal repair. Prog Brain Res. 2009;175:3–21. doi: 10.1016/S0079-6123(09)17501-5. [DOI] [PMC free article] [PubMed] [Google Scholar]
- 21.Eiraku M, Takata N, Ishibashi H, Kawada M, Sakakura E, Okuda S, Sekiguchi K, Adachi T, Sasai Y. Self-organizing optic-cup morphogenesis in three-dimensional culture. Nature. 2011;472:51–6. doi: 10.1038/nature09941. [DOI] [PubMed] [Google Scholar]
- 22.La Torre A, Lamba DA, Jayabalu A, Reh TA. Production and transplantation of retinal cells from human and mouse embryonic stem cells. Methods Mol Biol. 2012;884:229–46. doi: 10.1007/978-1-61779-848-1_16. [DOI] [PubMed] [Google Scholar]
- 23.Boucherie C, Mukherjee S, Henckaerts E, Thrasher AJ, Sowden JC, Ali RR. Brief report: self-organizing neuroepithelium from human pluripotent stem cells facilitates derivation of photoreceptors. Stem Cells. 2013;31:408–14. doi: 10.1002/stem.1268. [DOI] [PubMed] [Google Scholar]
- 24.Gonzalez-Cordero A, West EL, Pearson RA, Duran Y, Carvalho LS, Chu CJ, Naeem A, Blackford SJ, Georgiadis A, Lakowski J, Hubank M, Smith AJ, Bainbridge JW, Sowden JC, Ali RR. Photoreceptor precursors derived from three-dimensional embryonic stem cell cultures integrate and mature within adult degenerate retina. Nat Biotechnol. 2013;31:741–7. doi: 10.1038/nbt.2643. [DOI] [PMC free article] [PubMed] [Google Scholar]
- 25.Decembrini S, Koch U, Radtke F, Moulin A, Arsenijevic Y. Derivation of traceable and transplantable photoreceptors from mouse embryonic stem cells. Stem Cell Rev. 2014;2:853–65. doi: 10.1016/j.stemcr.2014.04.010. [DOI] [PMC free article] [PubMed] [Google Scholar]
- 26.Zhong X, Gutierrez C, Xue T, Hampton C, Vergara MN, Cao LH, Peters A, Park TS, Zambidis ET, Meyer JS, Gamm DM, Yau KW, Canto-Soler MV. Generation of three-dimensional retinal tissue with functional photoreceptors from human iPSCs. Nat Commun. 2014;5:4047. doi: 10.1038/ncomms5047. [DOI] [PMC free article] [PubMed] [Google Scholar]
- 27.Wright LS, Phillips MJ, Pinilla I, Hei D, Gamm DM. Induced pluripotent stem cells as custom therapeutics for retinal repair: progress and rationale. Exp Eye Res. 2014;123:161–72. doi: 10.1016/j.exer.2013.12.001. [DOI] [PMC free article] [PubMed] [Google Scholar]
- 28.van der Maaten L. Barnes-Hut-SNE. Proceedings of the International Conference on Learning Representations. 2013. [Google Scholar]
- 29.van der Maaten L, Hinton GE. (2008. Visualizing High-Dimensional Data Using t-SNE. J Mach Learn Res. 2013;9:2579–605. [Google Scholar]
- 30.Dorrell MI, Aguilar E, Weber C, Friedlander M. Global gene expression analysis of the developing postnatal mouse retina. Invest Ophthalmol Vis Sci. 2004;45:1009–19. doi: 10.1167/iovs.03-0806. [DOI] [PubMed] [Google Scholar]
- 31.Zhang SS, Xu X, Liu MG, Zhao H, Soares MB, Barnstable CJ, Fu XY. A biphasic pattern of gene expression during mouse retina development. BMC Dev Biol. 2006;6:48. doi: 10.1186/1471-213X-6-48. [DOI] [PMC free article] [PubMed] [Google Scholar]
- 32.Corbo JC, Lawrence KA, Karlstetter M, Myers CA, Abdelaziz M, Dirkes W, Weigelt K, Seifert M, Benes V, Fritsche LG, Weber BH, Langmann T. CRX ChIP-seq reveals the cis-regulatory architecture of mouse photoreceptors. Genome Res. 2010;20:1512–25. doi: 10.1101/gr.109405.110. [DOI] [PMC free article] [PubMed] [Google Scholar]
- 33.Muranishi Y, Sato S, Inoue T, Ueno S, Koyasu T, Kondo M, Furukawa T. Gene expression analysis of embryonic photoreceptor precursor cells using BAC-Crx-eGFP transgenic mouse. Biochem Biophys Res Commun. 2010;392:317–22. doi: 10.1016/j.bbrc.2010.01.007. [DOI] [PubMed] [Google Scholar]
- 34.Lakowski J, Han YT, Pearson RA, Gonzalez-Cordero A, West EL, Gualdoni S, Barber AC, Hubank M, Ali RR, Sowden JC. Effective transplantation of photoreceptor precursor cells selected via cell surface antigen expression. Stem Cells. 2011;29:1391–404. doi: 10.1002/stem.694. [DOI] [PMC free article] [PubMed] [Google Scholar]
- 35.Omori Y, Katoh K, Sato S, Muranishi Y, Chaya T, Onishi A, Minami T, Fujikado T, Furukawa T. Analysis of transcriptional regu;atory pathways of photoreceptor genes by expression profiling of the Otx2-deficient retina. PLoS ONE. 2011;6:e19685. doi: 10.1371/journal.pone.0019685. [DOI] [PMC free article] [PubMed] [Google Scholar]
- 36.Brooks MJ, Rajasimha HK, Roger JE, Swaroop A. Next-generation sequencing facilitates quantitative analysis of wild type and Nrl −/− transcriptomes. Mol Vis. 2011;17:3034–54. [PMC free article] [PubMed] [Google Scholar]
- 37.Dickison VM, Richmond AM, Abu Irqeba A, Martak JG, Hoge SC, Brooks MJ, Othman MI, Khanna R, Mears AJ, Chowdhury AY, Swaroop A, Ogilvie JM. A role for prenylated rab acceptor 1 in vertebrate photoreceptor development. BMC Neurosci. 2012;13:152. doi: 10.1186/1471-2202-13-152. [DOI] [PMC free article] [PubMed] [Google Scholar]
- 38.Gamsiz ED, Ouyang Q, Schmidt M, Nagpal S, Morrow EM. Genome-wide transcriptome analysis in murine neural retina using high-throughput RNA sequencing. Genomics. 2012;99:44–51. doi: 10.1016/j.ygeno.2011.09.003. [DOI] [PMC free article] [PubMed] [Google Scholar]
- 39.Jelcick AS, Yuan Y, Leehy BD, Cox LC, Silveira AC, Qiu F, Schenk S, Sachs AJ, Morrison MA, Nystuen AM, DeAngelis MM, Haider NB. Genetic variations strongly influence phenotypic outcome in the mouse retina. PLoS ONE. 2011;6:e21858. doi: 10.1371/journal.pone.0021858. [DOI] [PMC free article] [PubMed] [Google Scholar]
- 40.Siegert S, Cabuy E, Gross Scherf B, Kohler H, Panda S, Le Y-Z, Fehling H-J, Gaidatzis D, Stadler MB, Roska B. Transcriptional code and disease map for adult retinal cell types. Nat Neurosci. 2011;15:487–97. doi: 10.1038/nn.3032. [DOI] [PubMed] [Google Scholar]
- 41.Mizeracka K, Trimarchi JM, Stadler MB, Cepko CL. Analysis of gene expression in wild type and Notch1 mutant retinal cells by single cell profiling. Dev Dyn. 2013;242:1–22. doi: 10.1002/dvdy.24006. [DOI] [PMC free article] [PubMed] [Google Scholar]
- 42.Postel K, Bellmann J, Splith V, Ader M. Analysis of cell surface markers specific for transplantable rod photoreceptors. Mol Vis. 2013;19:2058–67. [PMC free article] [PubMed] [Google Scholar]
- 43.Chan F, Bradley A, Wensel TG, Wilson JH. Knock-in human rhodopsin-GFP fusions as mouse models for human disease and targets for gene therapy. Proc Natl Acad Sci USA. 2004;101:9109–14. doi: 10.1073/pnas.0403149101. [DOI] [PMC free article] [PubMed] [Google Scholar]
- 44.Palfi A, Chadderton N, McKee AG, Blanco Fernandez A, Humphries P, Kenna PF, Farrar GJ. Efficacy of codelivery of dual AAV2/5 vectors in the murine retina and hippocampus. Hum Gene Ther. 2012;23:847–58. doi: 10.1089/hum.2011.142. [DOI] [PubMed] [Google Scholar]
- 45.Gautier L, Cope L, Bolstad BM, Irizarry RA. affy—analysis of Affymetrix GeneChip data at the probe level. Bioinformatics. 2004;20:307–15. doi: 10.1093/bioinformatics/btg405. [DOI] [PubMed] [Google Scholar]
- 46.R Core Team. R: A language and environment for statistical computing. R Foundation for Statistical Computing, Vienna, Austria. 2012. ISBN 3–900051–07–0, URL http://www.R-project.org/
- 47.R Core Team. R: A language and environment for statistical computing. R Foundation for Statistical Computing, Vienna, Austria. 2013. [Google Scholar]
- 48.Smyth GK. Linear models and empirical Bayes methods for assessing differential expression in microarray experiments. Statistical Applications in Genetics and Molecular Biology, Vol. 3, No. 1, Article 3. 2004. [DOI] [PubMed] [Google Scholar]
- 49.Smyth GK. Limma linear models for microarray data. In Bioinformatics and Computational Biology Solutions using R and Bioconductor, R. Gentleman, V. Carey, S. Dut, R. Irizarry, W. Huber (eds., Springer, New York,pages 397–420. 2005. [Google Scholar]
- 50.Hunter SM, Mansergh FC, Evans MJ. Optimization of minuscule samples for use with cDNA microarrays. J Biochem Biophys Methods. 2008;70:1048–58. doi: 10.1016/j.jprot.2007.11.011. [DOI] [PubMed] [Google Scholar]
- 51.Huang DW, Sherman BT, Lempicki RA. Systematic and integrative analysis of large gene lists using DAVID Bioinformatics Resources. Nat Protoc. 2009;4:44–57. doi: 10.1038/nprot.2008.211. [DOI] [PubMed] [Google Scholar]
- 52.Huang DW, Sherman BT, Lempicki RA. Bioinformatics enrichment tools: paths toward the comprehensive functional analysis of large gene lists. Nucleic Acids Res. 2009;37:1–13. doi: 10.1093/nar/gkn923. [DOI] [PMC free article] [PubMed] [Google Scholar]
- 53.Mathelier A, Zhao X, Zhang AW, Parcy F, Worsley-Hunt R, Arenillas DJ, Buchman S, Chen CY, Chou A, Ienasescu H, Lim J, Shyr C, Tan G, Zhou M, Lenhard B, Sandelin A, Wasserman WW. JASPAR 2014: an extensively expanded and updated open-access database of transcription factor binding profiles. Nucleic Acids Res. 2014;42:D142–7. doi: 10.1093/nar/gkt997. [DOI] [PMC free article] [PubMed] [Google Scholar]
- 54.Swindell WR, Johnston A, Sun L, Xing X, Fisher GJ, Bulyk ML, Elder JT, Gudjonsson JE. Meta-profiles of gene expression during aging: limited similarities between mouse and human and an unexpectedly decreased inflammatory signature. PLoS ONE. 2012;7:e33204. doi: 10.1371/journal.pone.0033204. [DOI] [PMC free article] [PubMed] [Google Scholar]
- 55.Barrett T, Wilhite SE, Ledoux P, Evangelista C, Kim IF, Tomashevsky M, Marshall KA, Phillippy KH, Sherman PM, Holko M, Yefanov A, Lee H, Zhang N, Robertson CL, Serova N, Davis S, Soboleva A. NCBI GEO: archive for functional genomics data sets–update. Nucleic Acids Res. 2013;41:D991–5. doi: 10.1093/nar/gks1193. [DOI] [PMC free article] [PubMed] [Google Scholar]
- 56.Brazma A. Minimum Information About a Microarray Experiment (MIAME.–successes, failures, challenges. ScientificWorldJournal. 2009;9:420–3. doi: 10.1100/tsw.2009.57. [DOI] [PMC free article] [PubMed] [Google Scholar]
- 57.Brazma A, Hingamp P, Quackenbush J, Sherlock G, Spellman P, Stoeckert C, Aach J, Ansorge W, Ball CA, Causton HC, Gaasterland T, Glenisson P, Holstege FC, Kim IF, Markowitz V, Matese JC, Parkinson H, Robinson A, Sarkans U, Schulze-Kremer S, Stewart J, Taylor R, Vilo J, Vingron M. Minimum information about a microarray experiment (MIAME.-toward standards for microarray data. Nat Genet. 2001;29:365–71. doi: 10.1038/ng1201-365. [DOI] [PubMed] [Google Scholar]
- 58.Mansergh FC, Chadderton N, Kenna PF, Gobbo OL, Farrar GJ. Cell therapy using retinal progenitor cells shows therapeutic effect in a chemically-induced rotenone mouse model of Leber hereditary optic neuropathy. Eur J Hum Genet. 2014;22:1314–20. doi: 10.1038/ejhg.2014.26. [DOI] [PMC free article] [PubMed] [Google Scholar]
- 59.Kwon AT, Arenillas DJ, Worsley Hunt R, Wasserman WW. oPOSSUM-3: advanced analysis of regulatory motif over-representation across genes or ChIP-Seq datasets. G3 Genes. 2012;2:987-1002. [DOI] [PMC free article] [PubMed]
- 60.Andreazzoli M. Molecular regulation of vertebrate retina cell fate. Birth Defects Res C Embryo Today. 2009;87:284–95. doi: 10.1002/bdrc.20161. [DOI] [PubMed] [Google Scholar]
- 61.Neveling K, Collin RW, Gilissen C, van Huet RA, Visser L, Kwint MP, Gijsen SJ, Zonneveld MN, Wieskamp N, de Ligt J, Siemiatkowska AM, Hoefsloot LH, Buckley MF, Kellner U, Branham KE, den Hollander AI, Hoischen A, Hoyng C, Klevering BJ, van den Born LI, Veltman JA, Cremers FP, Scheffer H. Next-generation genetic testing for retinitis pigmentosa. Hum Mutat. 2012;33:963–72. doi: 10.1002/humu.22045. [DOI] [PMC free article] [PubMed] [Google Scholar]
- 62.Wang X, Wang H, Sun V, Tuan HF, Keser V, Wang K, Ren H, Lopez I, Zaneveld JE, Siddiqui S, Bowles S, Khan A, Salvo J, Jacobson SG, Iannaccone A, Wang F, Birch D, Heckenlively JR, Fishman GA, Traboulsi EI, Li Y, Wheaton D, Koenekoop RK, Chen R. Comprehensive molecular diagnosis of 179 Leber congenital amaurosis and juvenile retinitis pigmentosa patients by targeted next generation sequencing. J Med Genet. 2013;50:674–88. doi: 10.1136/jmedgenet-2013-101558. [DOI] [PMC free article] [PubMed] [Google Scholar]
- 63.Xia J, Luo M, Ni N, Chen J, Hu Y, Deng Y, Ji J, Zhou J, Fan X, Gu P. Bone marrow mesenchymal stem cells stimulate proliferation and neuronal differentiation of retinal progenitor cells. PLoS ONE. 2013;8:e76157. doi: 10.1371/journal.pone.0076157. [DOI] [PMC free article] [PubMed] [Google Scholar]
- 64.Anand-Apte B, Ebrahem Q, Cutler A, Farage E, Sugimoto M, Hollyfield J, Folkman J. Betacellulin induces increased retinal vascular permeability in mice. PLoS ONE. 2010;5:e13444. doi: 10.1371/journal.pone.0013444. [DOI] [PMC free article] [PubMed] [Google Scholar]
- 65.Hirano AA, Brandstätter JH, Morgans CW, Brecha NC. SNAP25 expression in mammalian retinal horizontal cells. J Comp Neurol. 2011;519:972–88. doi: 10.1002/cne.22562. [DOI] [PMC free article] [PubMed] [Google Scholar]
- 66.Morgans C, Brandstätter JH. SNAP-25 is present on the Golgi apparatus of retinal neurons. Neuroreport. 2000;11:85–8. doi: 10.1097/00001756-200001170-00017. [DOI] [PubMed] [Google Scholar]
- 67.McKee AG, Loscher JS, O'Sullivan NC, Chadderton N, Palfi A, Batti L, Sheridan GK, O'Shea S, Moran M, McCabe O, Fernández AB, Pangalos MN, O'Connor JJ, Regan CM, O'Connor WT, Humphries P, Farrar GJ, Murphy KJ. AAV-mediated chronic over-expression of SNAP-25 in adult rat dorsal hippocampus impairs memory-associated synaptic plasticity. J Neurochem. 2010;112:991–1004. doi: 10.1111/j.1471-4159.2009.06516.x. [DOI] [PubMed] [Google Scholar]
- 68.Landgraf I, Mülhlhans J, Dedek K, Reim K, Brandstätter JH, Ammermüller J. The absence of Complexin 3 and Complexin 4 differentially impacts the ON and OFF pathways in mouse retina. Eur J Neurosci. 2012;36:2470–81. doi: 10.1111/j.1460-9568.2012.08149.x. [DOI] [PubMed] [Google Scholar]
- 69.Reim K, Regus-Leidig H, Ammermüller J, El-Kordi A, Radyushkin K, Ehrenreich H, Brandstätter JH, Brose N. Aberrant function and structure of retinal ribbon synapses in the absence of complexin 3 and complexin 4. J Cell Sci. 2009;122:1352–61. doi: 10.1242/jcs.045401. [DOI] [PubMed] [Google Scholar]
- 70.Yin GN, Lee HW, Cho JY, Suk K. Neuronal pentraxin receptor in cerebrospinal fluid as a potential biomarker for neurodegenerative diseases. Brain Res. 2009;1265:158–70. doi: 10.1016/j.brainres.2009.01.058. [DOI] [PubMed] [Google Scholar]
- 71.Janoueix-Lerosey I, Novikov E, Monteiro M, Gruel N, Schleiermacher G, Loriod B, Nguyen C, Delattre O. Gene expression profiling of 1p35–36 genes in neuroblastoma. Oncogene. 2004;23:5912–22. doi: 10.1038/sj.onc.1207784. [DOI] [PubMed] [Google Scholar]
- 72.Dorus S, Vallender EJ, Evans PD, Anderson JR, Gilbert SL, Mahowald M, Wyckoff GJ, Malcom CM, Lahn BT. Accelerated evolution of nervous system genes in the origin of Homo sapiens. Cell. 2004;119:1027–40. doi: 10.1016/j.cell.2004.11.040. [DOI] [PubMed] [Google Scholar]
- 73.Fowler CD, Lu Q, Johnson PM, Marks MJ, Kenny PJ. Habenular α5 nicotinic receptor subunit signalling controls nicotine intake. Nature. 2011;471:597–601. doi: 10.1038/nature09797. [DOI] [PMC free article] [PubMed] [Google Scholar]
- 74.Jin G, Long C, Liu W, Tang Y, Zhu Y, Zhou X, Ai Y, Zhang Q, Shen H. Identification and characterization of novel alternative splice variants of human SAMD11. Gene. 2013;530:215–21. doi: 10.1016/j.gene.2013.08.033. [DOI] [PubMed] [Google Scholar]
- 75.Deshpande AM, Khalid O, Kim JJ, Kim Y, Lindgren A, Clark AT, Wong DT. Cdk2ap2 is a novel regulator for self-renewal of murine embryonic stem cells. Stem Cells Dev. 2012;21:3010–8. doi: 10.1089/scd.2012.0007. [DOI] [PMC free article] [PubMed] [Google Scholar]
- 76.SanGiovanni JP, Chen J, Sapieha P, Aderman CM, Stahl A, Clemons TE, Chew EY, Smith LE. DNA sequence variants in PPARGC1A, a gene encoding a coactivator of the ω-3 LCPUFA sensing PPAR-RXR transcription complex, are associated with NV AMD and AMD-associated loci in genes of complement and VEGF signaling pathways. PLoS ONE. 2013;8:e53155. doi: 10.1371/journal.pone.0053155. [DOI] [PMC free article] [PubMed] [Google Scholar]
- 77.Lucas EK, Markwardt SJ, Gupta S, Meador-Woodruff JH, Lin JD, Overstreet-Wadiche L, Cowell RM. Parvalbumin deficiency and GABAergic dysfunction in mice lacking PGC-1alpha. J Neurosci. 2010;30:7227–35. doi: 10.1523/JNEUROSCI.0698-10.2010. [DOI] [PMC free article] [PubMed] [Google Scholar]
- 78.Saint-Geniez M, Jiang A, Abend S, Liu L, Sweigard H, Connor KM, Arany Z. PGC-1α regulates normal and pathological angiogenesis in the retina. Am J Pathol. 2013;182:255–65. doi: 10.1016/j.ajpath.2012.09.003. [DOI] [PMC free article] [PubMed] [Google Scholar]
- 79.Nishimura DY, Baye LM, Perveen R, Searby CC, Avila-Fernandez A, Pereiro I, Ayuso C, Valverde D, Bishop PN, Manson FD, Urquhart J, Stone EM, Slusarski DC, Black GC, Sheffield VC. Discovery and functional analysis of a retinitis pigmentosa gene, C2ORF71. Am J Hum Genet. 2010;86:686–95. doi: 10.1016/j.ajhg.2010.03.005. [DOI] [PMC free article] [PubMed] [Google Scholar]
- 80.Collin RW, Safieh C, Littink KW, Shalev SA, Garzozi HJ, Rizel L, Abbasi AH, Cremers FP, den Hollander AI, Klevering BJ, Ben-Yosef T. Mutations in C2ORF71 cause autosomal-recessive retinitis pigmentosa. Am J Hum Genet. 2010;86:783–8. doi: 10.1016/j.ajhg.2010.03.016. [DOI] [PMC free article] [PubMed] [Google Scholar]
- 81.Khateb S, Zelinger L, Mizrahi-Meissonnier L, Ayuso C, Koenekoop RK, Laxer U, Gross M, Banin E, Sharon D. A homozygous nonsense CEP250 mutation combined with a heterozygous nonsense C2orf71 mutation is associated with atypical Usher syndrome. J Med Genet. 2014;51:460–9. doi: 10.1136/jmedgenet-2014-102287. [DOI] [PubMed] [Google Scholar]
- 82.Agoulnik IY, Cho Y, Niederberger C, Kieback DG, Cooney AJ. Cloning, expression analysis and chromosomal localization of the human nuclear receptor gene GCNF. FEBS Lett. 1998;424:73–8. doi: 10.1016/s0014-5793(98)00142-2. [DOI] [PubMed] [Google Scholar]
- 83.Akamatsu W, DeVeale B, Okano H, Cooney AJ, van der Kooy D. Suppression of Oct4 by germ cell nuclear factor restricts pluripotency and promotes neural stem cell development in the early neural lineage. J Neurosci. 2009;29:2113–24. doi: 10.1523/JNEUROSCI.4527-08.2009. [DOI] [PMC free article] [PubMed] [Google Scholar]
- 84.Andrieu G, Quaranta M, Leprince C, Hatzoglou A. The GTPase Gem and its partner Kif9 are required for chromosome alignment, spindle length control, and mitotic progression. FASEB J. 2012;26:5025–34. doi: 10.1096/fj.12-209460. [DOI] [PubMed] [Google Scholar]
- 85.Yoon H, Lee DJ, Kim MH, Bok J. Identification of genes concordantly expressed with Atoh1 during inner ear development. Anat Cell Biol. 2011;44:69–78. doi: 10.5115/acb.2011.44.1.69. [DOI] [PMC free article] [PubMed] [Google Scholar]