

Abstract
Objective
Brain involvement is a serious complication of HIV infection. The earliest changes in the brain, which represents an anatomic site for viral persistence, are largely unknown.
Methods
This investigation used quantitative Magnetic Resonance methodologies, including high resolution and diffusion tensor (DTI) imaging, to evaluate the brain in 15 HIV and 20 seronegative subjects. All HIV subjects were antibody nonreactive with assay-estimated infection duration of less than 100 days.
Results
Brain volumetric analysis revealed reduced parenchyma with enlargement of the third ventricle and brainstem. DTI quantified loss of white matter integrity in the corpus callosum and diffusion alterations in caudate. Cognitive differences were indicated in psychomotor speed and visual recall. There were no differences between antiretroviral-initiated and naïve HIV subgroups.
Interpretation
These findings, quantified within 100 days of infection, shed light on the earliest brain changes in HIV infection. Onset of neural injury may date to initial viral invasion and the transient early period of unchecked viremia and marked immunosuppression of the seroconversion period.
Introduction
The initial virus host interaction in HIV infection is characterized by profound immune perturbances that are critical for long-term outcome. The viral setpoint determined in early infection, for example, predicts the time interval until Acquired Immunodeficiency Syndrome (AIDS), which may be diagnosed many years later, and the duration of survival.1 The initial virus host interaction involves rampant viremia with widespread viral dissemination to tissues. Viral reservoirs first established in this period constitute long-lived sources of persistence and rebound viremia that render viral eradication impossible, resulting in inexorable immune failure and death.2 Because HIV may remain undiagnosed in the earliest stages, however, this critical period is often lost to characterization. Early changes that occur in the brain, which represents an anatomic site for viral persistence in HIV infection, are largely unknown.
The Chicago Early HIV Infection cohort was established to investigate the status of the brain within ∼1 year of viral transmission.3 Findings from this observational study do not support the widely held assumption that the brain is spared in early infection. Alterations were quantified in brain structure,3 in functional connectivity in the resting state4 and in cognitive function in a cohort infected on average, 1 year.3 To gain further insight into the onset of earliest changes, this investigation focused on seroconversion, which spans the critical window in which the host first mounts an antibody response. This very early period has not been considered in prior analyses of the Chicago cohort. For this study, additional participants in Acute/Primary infection were enrolled to examine the brain in the initial virus–host interaction. All HIV subjects in this study were antibody nonreactive and assay-estimated to be infected from 14 to less than 100 days based on conservative estimates from a recency algorithm.5 Brain volumetric measurements were derived using high-resolution neuroanatomic imaging. For this study focused on seroconversion, additional brain measurements were derived using diffusion tensor imaging (DTI) to detect changes occurring at microstructural levels and immune mediators were examined to determine relationships with the earliest brain changes. A comprehensive neuropsychological test battery was used to assess cognitive function. Brain measurements were also examined for patterns of relationship to viremia and to immune status in the seroconversion period.
Subjects and Methods
Northwestern University Institutional Review Board approved this investigation, which was conducted in compliance with U.S. federal guidelines. Informed consent was obtained from all subjects. The Chicago Early HIV Infection study is an ongoing, observational investigation. This study included 15 HIV and 20 seronegative participants. A prior study of the larger Chicago cohort (n = 43 HIV; mean duration, 1 year) included nine of these subjects. For this study focused on seroconversion, additional subjects in acute/primary infection were enrolled (antibody nonreactivity; infected less than 100 days). All infected subjects reported sexual transmission as the method of infection. Seronegative subjects were recruited from similar Chicago urban areas. Study exclusion criteria for the Chicago cohort include chronic neurological disorder, head injury, uncontrolled seizure disorder, experimental drugs or vaccination within past 15 days, radiation or chemotherapy within prior month, mental condition involving inability to understand, chronic or active alcohol abuse, chronic or active drug abuse, pregnancy, opportunistic infection, cancer, medical condition (heart, liver or kidney) or MR contraindication. HIV and seronegative groups did not differ in age, gender, racial composition, educational level or use of alcohol or other drugs, with the exception of marijuana use, which was higher in the HIV group (Table1). Intravenous drug use was not reported in either group.
Table 1.
Demographic and clinical characteristics
| HIV (n = 15) | Control (n = 20) | P | |
|---|---|---|---|
| Demographic characteristics | |||
| Age (mean years ± SD) | 34.9 ± 11.2 | 31.7 ± 8.9 | 0.36 |
| Gender (% male) | 93% | 80% | 0.25 |
| Race (% White) | 47% | 75% | 0.09 |
| Education (% college) | 71% | 90% | 0.21 |
| Substance use (past month) | |||
| Alcohol (5 or more drinks) | 3 | 4 | 0.99 |
| Marijuana | 7 | 2 | 0.01 |
| Cocaine | 0 | 0 | – |
| Amphetamines | 0 | 0 | – |
| Glue or solvent sniffing | 0 | 0 | – |
| Heroin | 0 | 0 | – |
| Other | 0 | 0 | – |
| Clinical characteristics | |||
| CD4 cell count (cells/μL) | |||
| Mean ± SD | 580 ± 332.7 | ||
| Range | 247–1282 | ||
| Plasma HIV RNA copies/mL (log10) | |||
| Mean ± SD | 3.50 ± 2.0 | ||
| ART Naïve (n = 7) | 3.61 ± 2.2 | ||
| Initiated on ART (n = 8) | 3.40 ± 1.8 | ||
| Regimen | |||
| Atripla (efavirenz, emtricitabine, tenofovir) | 5 | ||
| Ritonavir, atazanavir, emtricitabine/tenofovir | 2 | ||
| Raltegravir, emtricitabine/tenofovir | 1 | ||
ART, antiretroviral therapy.
Blood samples were collected from HIV and seronegative subjects. Serostatus was determined by enzyme-linked immunosorbent assay and Western blot. Plasma viral load (log10) ranged from undetectable to 10,000,000 copies/mL (Table1). Absolute CD4+ cell counts ranged from 247 to 1282/mm3. Seven HIV subjects were antiretroviral naïve and eight had initiated antiretrovirals. Additional criteria for HIV subjects in this study included antibody nonreactivity and an early infection assay of less than 10 (Blood Systems, San Francisco, CA). This assay uses a conservative “nonreactive” criteria of 10 to reduce the false recent rate.5 An assay value of 10 corresponds to an estimated infection duration of 105 days (95% CI: 73.5–138.2). The mean assay value in this sample was considerably lower (3.86 ± 2.7) with values ranging from 0.13 to 7.65. Therefore, all subjects in this sample were conservatively estimated to be infected less than 100 days. Based on Fiebig staging, these subjects were estimated to be in stages III to V.6
Cytokine/chemokine quantification
Multiplex analyses were conducted at Core Immunology Laboratory at Blood Systems Research Institute, San Francisco, CA. Serum samples were assayed using the high-sensitivity MilliPlex kit (Millipore, Billerica, MA, USA) for IL-1β, IL-2, IL-4, IL-5, IL-6, IL-7, IL-8, IL-10, IL-12p70, IL-13, IFN-γ, GM-CSF and TNF-α; and the standard-sensitivity Milliplex Map kit (Millipore) for epidermal growth factor (EGF), Eotaxin, fibroblast growth factor (FGF)-2, FLT-3, Fractalkine, IFN-α IL-1α, IL-1Rα, IL-3, IL-9, IL-12(p40), IL-15, IL-17, IP-10, monocyte chemotactic protein (MCP)-1, MCP-3, macrophage-derived chemokine (MDC), macrophage inflammatory protein (MIP)-1α, MIP-1β, sIL-2Rα, TNFβ, granulocyte colony-stimulating factor (G-CSF), growth-related oncogene (GRO), TGF-α and vascular endothelial growth factor (VEGF). All measured in pg/mL. In brief, serum was incubated overnight with antibody-coupled beads followed by incubation with biotinylated detection antibody, and finally, incubation with streptavidin-PE. Each sample was assayed in duplicate and cytokine standards, and controls, supplied by the manufacturer, were run on each plate. The lower and upper limits of analyte detection were determined by the assay manufacturer. In addition, manufacturer controls and in-house controls consisting of supernatants of PBMCs stimulated with mitogen in culture were also run. Multi-analyte profiling was performed using a Luminex-100 system and data were analyzed using BioPlex 6.1 software (BioPlex, Hercules, CA, USA). Luminex Standard Curve: A 5-PL curve fit was used to graph the 7-point standard curve. The curve for every analyte was checked for the fit of the standard data points. For errors or more than a 30% CV coefficient of variation for any standard, those points were dropped. For Luminex measurements that fell below the lowest standard and were determined to be out of range by the Bioplex Manager software, a value of one-half the lowest standard value was used for the statistical analysis.
MR imaging
Imaging data were acquired on a single MR scanner, a 3 T MAGNETOM Tim Trio (Siemens, Erlangen, Germany) with maximum gradient slew rate, 200 mT/m per second, maximum gradient strength, 40 mT/m, using a 12 channel receive-only head coil. Sagittal whole brain Magnetization Prepared Rapid Acquisition Gradient Echo images were acquired (parameters: TR/TI/TE: 2300/900/2.91 msec; flip angle: 9°; field of view: 256 × 256 mm; slice thickness: 1 mm; resolution: 1 × 1 mm; slices: 176). For DTI, a 2D double refocused spin echo sequence with echo planar readout was used for acquisition (parameters: axial, TR/TE: 9700/90 msec, flip angle: 90°, field of view: 256 × 256 mm, In-plane resolution: 2 × 2 mm, slice thickness: 2 mm, slices: 72, Bandwidth: 1326 Hz/Px, averages: 1, acceleration factor: 2, directions: 64, b = [0; 1000] sec/mm2).
Image analysis
All image analysis was conducted blinded to subject status (HIV or control). Image quality control was performed visually by a trained operator to ensure that artifacts were not present in any of the MR modalities. SIENAX (Oxford University, Oxford, England) was used to calculate volumetric measurements for brain parenchyma, ventricular, and tissues classes (gray matter, cortical gray matter, white matter, and cerebrospinal fluid) normalized for differences in head size.7 SIENAX first extracts a brain and skull image from the subject's structural MPRAGE input image. The skull image is used to determine registration scaling from subject space to standard space (MNI125). This scaling is then utilized in the affine-registration of the brain image to standard space. This process defines the volumetric scaling factor used to normalize the brain volume. To avoid introducing errors from blurring associated with registration, tissue segmentation is performed on the original (nonregistered) MPRAGE images and volumes are then scaled by the scaling factor to derive the normalized measurements. Freesurfer,8 was used to derive measurements of individual brain regions. To minimize operator variability in manual editing, a semi-automated approach was used. Case by case visual inspection was used to assess image quality across scans; skull stripping and segmentation results met quality assurance standards for both cortical and subcortical segmentation. Freesurfer measurements for individual brain regions were divided by the intracranial cavity volume to adjust for differences in head size. DTI parameters, including fractional anisotropy (FA), which is sensitive to white matter integrity, and mean diffusivity (MD), which quantifies water molecular diffusion at levels approximating cellular dimensions, were determined for aggregate 3D volumes of interest. Parametric FA and MD maps were derived using custom software on a Linux workstation. Eddy-current-induced distortions were corrected in the SE-EPI-DTI images by registering all diffusion-weighted images to the B0 image for each slice. DTI parametric maps were coregistered to the anatomical T1 structural image using FLIRT (FMRIB's Linear Registration Tool). For DTI, the b0 image was used to calculate a transformation matrix between DTI and T1, which was then applied back to the DTI images to align them and segmentation was performed on the structural scan using Freesurfer to mask 3D volumes of interest. FA and MD were then calculated using standard equations9 for all voxels within 3D volumes of interest. Volumes of interest included regions that have been identified as vulnerable to injury in studies of more advanced HIV infection, including cerebral cortex, cerebral white matter, corpus callosum (CC), caudate, putamen, thalamus, and hippocampus.10–19
Cognitive assessment
Subjects were evaluated using a neuropsychological test battery that has been used in longitudinal studies of HIV neurological outcome.20
Statistical analysis
The primary analyses considered continuous variables (volumetric, DTI [FA and MD] and cognitive measures). Distributional assumptions were evaluated using the Shapiro–Wilk test. Group comparisons were accomplished with independent t-tests or Wilcoxon signed rank test. Chi-square or Fisher's exact test were used to consider categorical variables (e.g. demographic). For a priori analyses, a significance level of 0.05 was used. Secondary analyses involving HIV subgroups were accomplished with analysis of variance or Kruskal–Wallis, followed by Tukey-adjusted pairwise comparison. Spearman correlation coefficients were used to examine relationships between clinical measures and imaging measurements. Binary logistic regression was used for adjusted analyses. The quantitative early infection assay was used as a measure of length of infection. Analyses were executed with SAS (Cary, NC).
Results
Imaging measurements
Table2 presents significant group differences for the imaging measurements. Volumetric analysis quantified reduced brain parenchyma percent (t(33) = −2.21; P = 0.04), expansion of third ventricle (t(32) = 2.14; P = 0.04), and brainstem enlargement (t(33) = 2.79; P = 0.009) in the HIV seroconversion group. Differences for cortical (P = 0.067) and total (P = 0.08) gray matter were nearly significant. Anisotropy measurements (DTI FA) for aggregate 3D CC were reduced in the HIV group (t(33) = −2.54; P = 0.016) with further analysis of individual CC segments, indicating the most prominent differences in anterior (t(33) = −2.95; P = 0.006) and mid-posterior regions (t(33) = −1.96; P = 0.065) (Fig.1). Diffusivity (DTI MD) for aggregate caudate volume was also significantly increased (t(33) = 2.22; P = 0.034) compared to controls. There were no differences in the brain imaging measurements between antiretroviral therapy (ART) and naïve HIV subgroups.
Table 2.
Quantitative brain differences identified in HIV seroconversion
| HIV (n = 15) | Control (n = 20) | P | ES | |
|---|---|---|---|---|
| Mean ± SD | Mean ± SD | |||
| Volumetric measures1 | ||||
| Brain parenchymal percent | 0.84 ± 0.03 | 0.86 ± 0.01 | 0.04 | 0.8 |
| Third ventricle | 0.0006 ± 0.0001 | 0.0001 ± 0.00003 | 0.04 | 0.7 |
| Brainstem | 0.014 ± 0.001 | 0.013 ± 0.001 | 0.009 | 1.0 |
| DTI measures | ||||
| FA CC | 0.67 ± 0.04 | 0.69 ± 0.02 | 0.016 | 0.9 |
| FA CC anterior | 0.65 ± 0.08 | 0.70 ± 0.06 | 0.006 | 1.0 |
| FA CC mid-posterior | 0.59 ± 0.05 | 0.64 ± 0.04 | 0.065 | 0.7 |
| MD caudate | 0.0009 ± 0.0001 | 0.0008 ± 0.00007 | 0.034 | 0.8 |
ES, effect size. Mean difference divided by common standard deviation. DTI, diffusion tensor imaging; FA, fractional anisotropy; CC, corpus callosum; MD, mean diffusivity.
Normalized for cranial size.
Figure 1.
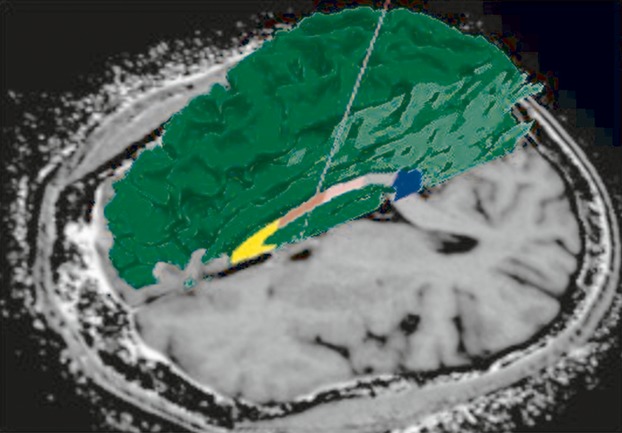
Freesurfer segmentation shown for individual segments of the corpus callosum in a participant infected only a few weeks. Volumetric and diffusion tensor imaging (DTI) measurements can be quantified for 3D volumes of interest. Loss of white matter integrity was detected in the corpus callosum in HIV seroconversion.
Cognitive status
As shown in Table3, the HIV group had weaker performance on Digit Symbol (t(31) = −4.32; P = 0.001) and Rey Complex Figure Recall (t(26) = −2.02; P = 0.05). There were no differences in cognitive measures between ART and naïve HIV subgroups.
Table 3.
Neuropsychological measures
| HIV | Control | |||
|---|---|---|---|---|
| Mean ± SD | Mean ± SD | P | ES | |
| Digit symbol | 54.08 ± 10.47 | 68.15 ± 8.18 | 0.001 | −1.54 |
| Rey complex figure recall | 23.18 ± 6.98 | 27.65 ± 4.73 | 0.053 | −0.78 |
| Rey complex figure copy | 33.27 ± 2.80 | 33.88 ± 3.64 | 0.641 | −0.18 |
| Rey auditory delayed recall | 9.31 ± 3.25 | 11.17 ± 2.64 | 0.090 | −0.64 |
| Rey recall after interference | 9.38 ± 2.931 | 10.6 ± 2.46 | 0.208 | −0.46 |
| Rey auditory verbal learning | 12.08 ± 2.50 | 13.0 ± 1.45 | 0.244 | −0.48 |
| Odd man out | 9.69 ± 0.63 | 9.95 ± 0.22 | 0.178 | −0.61 |
| Grooved pegboard (dominant) | 64.31 ± 8.19 | 60.53 ± 9.62 | 0.256 | 0.42 |
| Grooved pegboard (non-dominant) | 68.77 ± 8.95 | 66.32 ± 9.36 | 0.464 | 0.27 |
| Letter-number sequencing | 12.31 ± 3.07 | 13.84 ± 3.34 | 0.197 | −0.47 |
| Verbal fluency | 38.23 ± 10.54 | 42.25 ± 10.33 | 0.287 | −0.39 |
| Trails A | 26.0 ± 8.78 | 26.55 ± 9.09 | 0.865 | −0.06 |
| Trails B | 65.62 ± 25.47 | 59.70 ± 17.68 | 0.436 | 0.28 |
| Timed gait | 8.58 ± 1.311 | 8.8 ± 1.32 | 0.656 | −0.17 |
| CALCAP choice | 421.82 ± 56.83 | 427.6 ± 53.60 | 0.780 | −0.11 |
| CALCAP sequential | 552.64 ± 90.438 | 550.85 ± 93.36 | 0.959 | 0.02 |
ES, effect size. Mean difference divided by common standard deviation. CALCAP, California Computerized Assessment Package.
HIV disease status
Table4 presents relationships between significant imaging findings and clinical measures (CD4+ and CD8+ cell counts, plasma HIV RNA). CD4+ depletion, measured concurrently with brain imaging in the seroconversion period, was significantly correlated with FA in CC (ρ = 0.68; P = 0.007) and the mid-posterior CC segment (ρ = 0.63; P = 0.02) and with MD (diffusivity) in caudate (ρ = 0.55; P = 0.4).
Table 4.
Brain alterations and HIV clinical status in seroconversion
| CD4+ (cells/μL) | CD8+ (cells/μL) | Plasma HIV RNA (copies/mL) | |
|---|---|---|---|
| Volumetric measures | |||
| Brain parenchyma | 0.12 | 0.31 | 0.05 |
| Brainstem | −0.28 | −0.07 | 0.12 |
| Third ventricle | 0.24 | −0.02 | −0.00 |
| DTI measures | |||
| FA CC | 0.68** | 0.43 | −0.09 |
| FA CC anterior | −0.21 | −0.30 | −0.31 |
| FA CC mid-posterior | 0.63* | 0.39 | −0.18 |
| MD caudate | 0.55* | 0.40 | 0.12 |
CD, cluster of differentiation; DTI, diffusion tensor imaging; FA, fractional anisotropy; CC, corpus callosum; MD, mean diffusivity.
Spearman correlation coefficients. *P < 0.05; **P < 0.01.
Cytokines/chemokines
Table S1 presents plasma levels of immune mediators in HIV and seronegative controls and Mann–Whitney tests of group differences. Table5 presents Spearman correlations between the significant imaging measures and plasma levels of immune mediators:
for brain parenchyma: IL-1β (−0.466; P = 0.005), sIL-2Rα (−0.446 P = 0.012), IL-3 (−0.622 P = 0.002), IL-6 (−0.483; P = 0.003), TNFα (−0.410; P = 0.015), IL-1Rα (−0.436; P = 0.009), IL-10 (−0.371; P = 0.028), GRO (−0.57; P = 0.017) (P = 0.051–0.058: IL-7, IL-8, IFNγ, EGF and Flt-3).
for the third ventricle: IL-1α (0.44; P = 0.009), IL-6 (0.359; P = 0.034), IL-15 (0.396; P = 0.018), TNFβ (0.575; P < 0.001), GM-CSF (0.463; P = 0.005), MCP-1 (0.384; P = 0.023), eotaxin (0.481; P = 0.003). (P = 0.051: IL-1β and IL-13)
for brainstem: IL-1β (0.357; P = 0.036), IL-4 (0.477; P = 0.004), IL-10 (0.386; P = 0.022).
and caudate MD: IL-8 (0.391; P = 0.020), IL-5 (0.332; P = 0.051), IL-10 (0.548; P = 0.001) (P = 0.51: MDC and VEGF).
Table 5.
Immune mediators and significant brain imaging measures
| BPV | Third ventricle | Brainstem | FA CC | MD caudate | |
|---|---|---|---|---|---|
| Pro-inflammatory/T-cell | |||||
| IL-1α | −0.27 | 0.44** | −0.10 | 0.12 | 0.08 |
| IL-1β | −0.47** | 0.33 | 0.36* | 0.16 | 0.24 |
| IL-2 | −0.31 | 0.11 | 0.26 | 0.20 | 0.17 |
| sIL-2Rα | −0.45* | 0.12 | 0.05 | −0.23 | −0.13 |
| IL-3 | −0.62** | 0.34 | −0.24 | 0.14 | −0.12 |
| IL-6 | −0.48** | 0.36* | −0.03 | −0.13 | 0.30 |
| IL-7 | −0.33 | −0.03 | 0.21 | 0.21 | 0.14 |
| IL-8 | −0.33 | 0.01 | 0.31 | −0.22 | 0.39* |
| IL-9 | −0.11 | 0.09 | −0.08 | −0.12 | −0.10 |
| IL-12(p40) | −0.15 | 0.28 | −0.06 | 0.01 | −0.15 |
| IL-12(p70) | −0.13 | 0.14 | 0.06 | 0.24 | 0.25 |
| IL-15 | −0.09 | 0.40* | −0.11 | −0.04 | 0.00 |
| IL-17 | −0.29 | −0.16 | 0.07 | −0.14 | 0.31 |
| TNFα | −0.41* | −0.12 | 0.28 | −0.07 | 0.27 |
| TNFβ | −0.17 | 0.58** | −0.10 | −0.22 | 0.04 |
| GM-CSF | −0.27 | 0.46** | 0.13 | 0.05 | 0.23 |
| Anti-inflammatory/Th2 | |||||
| IL-1Rα | −0.44** | 0.19 | −0.23 | −0.22 | 0.08 |
| IL-4 | −0.27 | 0.03 | 0.48** | 0.11 | 0.13 |
| IL-5 | −0.21 | 0.07 | 0.16 | −0.07 | 0.33* |
| IL-10 | −0.37* | −0.02 | 0.39* | −0.10 | 0.55** |
| IL-13 | −0.31 | 0.33 | 0.03 | 0.11 | 0.20 |
| Chemoattractants | |||||
| IP-10 | −0.25 | 0.03 | 0.21 | 0.06 | 0.11 |
| MCP-1 | −0.27 | 0.38* | −0.03 | −0.06 | 0.07 |
| MCP-3 | −0.10 | 0.16 | 0.12 | 0.11 | −0.08 |
| MDC | −0.16 | 0.00 | 0.18 | −0.01 | 0.35* |
| MIP-1α | −0.07 | −0.07 | −0.22 | −0.03 | 0.13 |
| MIP-1β | −0.18 | −0.09 | −0.16 | −0.02 | 0.20 |
| Eotaxin | −0.20 | 0.48** | 0.09 | 0.08 | 0.00 |
| Fractalkine | −0.09 | −0.12 | 0.11 | −0.18 | 0.16 |
| IFNα | −0.31 | 0.02 | −0.03 | −0.03 | −0.07 |
| IFNγ | −0.32 | 0.09 | 0.30 | 0.17 | 0.22 |
| Growth factors | |||||
| VEGF | −0.12 | −0.22 | 0.18 | −0.15 | 0.33* |
| EGF | −0.32 | 0.14 | −0.12 | −0.01 | 0.18 |
| FGF-2 | −0.30 | −0.01 | 0.09 | −0.05 | 0.15 |
| Flt-3 | −0.48 | 0.21 | −0.26 | −0.03 | 0.32 |
| GCSF | −0.25 | 0.14 | 0.06 | −0.33 | 0.26 |
| GRO | −0.57* | 0.24 | −0.42 | −0.12 | −0.32 |
| TGFα | −0.18 | −0.03 | −0.37 | 0.16 | 0.27 |
BPV, brain parenchymal volume; FA, fractional anisotropy; CC, corpus callosum; MD, mean diffusivity.
Spearman correlation coefficients. Markers measured in pg/mL. *P < 0.05; **P < 0.01.
CC FA
No significant correlations between immune mediators and CC FA were identified.
Adjusted analyses
A binary logistic model was used to consider subject characteristics, including age, education, HIV, race, and gender, as predictors of brain alterations, determined by k-means classification. Based on forward selection, age was the only significant variable. This approach was also used to consider clinical (CD4+ cell count, viral load, CD8, length of infection, antiretroviral status) and subject characteristics separately in the HIV group (n = 15). Variables associated with brain alterations in the HIV group included age and viral load.
Discussion
This imaging investigation quantified brain alterations within the first 100 days of HIV infection. Volumetric analysis revealed reduced total parenchyma, third ventricle expansion, and enlargement of brainstem (Table2). DTI indicated altered white matter integrity in CC and microstructural alterations in caudate. These findings, detected prior to an antibody response, may be among the earliest brain changes in HIV infection. An autopsy conducted 15 days following an iatrogenic infection found mononuclear cells in meninges and throughout the cerebral cortex, basal ganglia, and cerebellum,21 mirroring the in vivo findings of this imaging study. Other studies have detected the virus in cerebrospinal fluid (CSF) within 8 days of HIV transmission22 and during primary infection.23 Neuroinflammation has been detected by Magnetic Resonance Spectroscopy in Acute HIV.24 CSF concentrations of neurofilament light chain, a marker of axonal injury, are elevated in primary infection and correlate with imaging measures of neuronal injury examined in white matter (anterior cingulate and frontal) and cortical gray matter.25 Studies of early HIV infection, defined variously as soon after seroconversion or within the first approximate year, have found neuronal injury in frontal cortex,26 microglial activation in basal ganglia,26 reduced subcortical blood flow,27 altered functional connectivity4 and structural changes in gray matter with third ventricular expansion.3 The findings for seroconversion are consistent with atrophy, ventricular expansion, and injury in CC and basal ganglia that have been found with advanced infection.12,16,28 Taken together, this evidence supports early onset of neural injury in HIV infection.
The pattern of findings may reflect vulnerability of these regions to initial brain viral invasion and neuroinflammation. Initial symptoms of HIV infection often include headache and symptoms of meningitis. The meninges can harbor virus and may play a role in viral transport.29 Gray matter abnormalities and third ventricular enlargement have been seen in vivo in Acute HIV meningoencephalitis.30 Viral invasion of the brain may occur as cell-free virus or via infected monocytes that traffic to the brain in immune surveillance and response.31–33 An intact blood– brain barrier generally restricts viruses, however, this period is characterized by rampant viral expansion, massive CD4+ destruction, and a cytokine storm.34 Viral proteins, cytokines, chemokines, and other factors may alter the restrictive properties.35 Moreover, blood–brain barrier is intrinsically more permeable or lacking in circumventricular organs, highly vascularized areas near ventricular walls, and in choroid plexus, strands of vascular membrane within ventricles. In the lateral ventricle, the choroid plexus is prominent in the atrium, bordered by CC and caudate. The third ventricle, situated below CC and above the brainstem, is partly formed by circumventricular organs (e.g. the subfornical organ) and the roof comprising the choroid plexus. Expansion in this ventricle may reflect changes in the surrounding regions and/or alterations in CSF production and outflow, which may be markedly modified in HIV infection.36 Choroid plexus is critical in CSF production and functions as a protective filter, removing neurotoxic factors from CSF (blood-CSF barrier) to maintain the delicate extracellular environment of neurons.37 Importantly, choroid plexi may become calcified with age, often in glomus choroideum, which is bordered by CC and caudate.37 In adjusted analyses, both older age and the plasma HIV RNA level were associated with brain alterations in seroconversion.
Virus or infected/activated monocytes in meninges, subarachnoid space, and parenchyma activate the Central Nervous System (CNS) immune repertoire. Microglia are critical in orchestrating this response through cytokines, chemokines, and other mediators. While neurons lack the CD4+ receptor and not directly infected, they can be injured or destroyed by exposure to viral proteins or inflammatory factors that induce cellular death pathways or impair neuroprotective mechanisms.38 Prolonged or unrelenting immune activation may lead to considerable injury. The viral protein, tat, for example, increases intracellular calcium, potentiates excitotoxicity, and induces apoptosis.39,40 Transient exposure may cause progressive neuropathological changes for days.41
Viremia in Acute HIV is associated with rapid, transient elevations in IFN-α and IL-15, increases in IP-10, rapid and sustained increases in TNF-α and MCP-1, slow elevations in IL-6, IL-8, IL-18, and IFN-γ and late-peaking increases in IL-10.34 The relationship to changes occurring in the brain is largely unknown. Immune responses induced in the initial virus host interaction may have a potentially dual role – containing viral replication or fueling immune activation and viral spread.34,42 With respect to brain involvement, findings from this study favor the latter interpretation. Significant relationships (P < 0.01) with circulating immune mediators (Table5) were identified for brain parenchymal volume (IL-1β, sIL-2Rα, IL-3, IL-6, TNFα, IL-1Rα, IL-10, and GRO), third ventricle (IL-1α, TNFβ, GM-CSF, eotaxin), brainstem (IL-4), and caudate diffusivity (IL-10). Additional relationships (P < 0.05) are presented in Table5. MCP-1, which has been implicated in HIV-associated brain injury,20 correlated only with third ventricular expansion (P = 0.02) in the seroconversion period.
In contrast to other brain alterations, no significant relationships with circulating markers were identified for CC. Loss of white matter integrity in this region correlated specifically with CD4+ depletion in seroconversion. Vulnerability of CC in HIV infection, which was largely unrecognized for many years, has since been demonstrated by Positron Emission Tomography, computational neuroanatomy, diffusion tensor, and magnetization transfer imaging16–18,43 with marked damage confirmed in postmortem analysis.19 A relationship with concurrent CD4+ has been found in advanced infection.10,16 The basis of the observed relationship with immune status is unclear. The CC is the largest white matter structure in the brain, with projections to all regions and broad involvement in cognitive function. Early alterations in CC may be relevant to differences in psychomotor speed and visual memory that were identified in seroconversion and to longer term deterioration in cognitive function. Both nadir CD4+ (i.e. the lowest value in the clinical history)44 and psychomotor slowing45 have been identified as predictors of HIV neurocognitive outcome. It is important to recognize that CD4+ cell loss in the seroconversion period, as well as the nadir CD4+, if in early infection, may represent indirect measures of the intensity of viremia in the initial viral host interaction. Plasma HIV RNA peaks within ∼21 days of initial exposure, reaching staggering, albeit transient levels that may exceed those of advanced infection. This rampant viral expansion is accompanied by massive CD4+ destruction. It is plausible that higher viremia levels in acute HIV may be associated with increased brain viral exposure and neuroinflammation, whereas it is difficult to capture the peak level as viremia declines dramatically with host defense and with treatment, CD4+ recovery requires longer and may be attenuated even in those who achieve viral suppression.46
Brain status measurements did not differ in ART-initiated (n = 8) and naïve (n = 7) subjects, however, the small sample may have precluded detecting differences. In addition, treatment averaged only 38 days. Viral suppression may require up to 3–6 months after initiation of ART. Larger, longitudinal studies examining effects of treatment are imperative. Early ART may be neuroprotective. Some evidence suggests that primary infection represents a critical window of opportunity for optimal immune recovery.47,48 Curbing early viremia and preserving immune function may benefit a long-term neurological outcome. Alternatively, there may be potential neurotoxic ART effects and early initiation would translate into greater cumulative exposure. Five of the ART subjects were on efavirenz (through the multi-drug, Atripla). A metabolite of efavirenz is a potent neurotoxin in vitro, evoking calcium flux in neurons and inducing considerable damage to dendritic spines.49
The small sample may have precluded identification of more subtle brain alterations in HIV seroconversion and of additional host factors associated with increased risk. It is unlikely that the brain alterations observed in this sample can be accounted for by past history of heavy drug use or co-infection. Chronic/active drug use was an exclusion criterion and this sample was not characterized by history of heavy drug use. None of the subjects were coinfected with hepatitis and opportunistic infection was also an exclusion. Active drug use and coinfection, however, are relatively common in HIV infection. History of methamphetamine, cocaine, alcohol, and other substances, as well as coinfection (e.g. hepatitis, TB, sexually transmitted diseases) and other factors may increase risk of early brain involvement in HIV infection and merit further study in larger samples.
These findings paint a picture of the brain in HIV seroconversion. It is important to recognize that during this period the brain may be subject to factors that are unique to the initial virus host interaction. The seroconversion period is time-limited and differs importantly from the remainder of the infection. An adaptive immune response is not yet fully established in this time frame. While transient, uncontrolled viremia, and immunosuppression during this very early period may have lasting effects on the brain, further studies will be necessary to replicate and extend these results to determine whether the brain alterations detected in seroconversion resolve with host defense or herald an indolent course of cumulative neural injury and cognitive decline.
Acknowledgments
The authors appreciate the efforts of Linda Reisberg RN, BS, as well as the services of the Center for Translational Imaging. This work was supported by the National Institutes of Health (R01-MH080636). A. B. R. is the principal investigator of the Chicago Early HIV Study and contributed to study design, imaging procedures, statistical analysis, interpretation of findings, and manuscript preparation. A. B. R. was funded by the National Institutes of Health grants #R01-MH080636, R01AG034852, R01CA159178, R25NS080949, R01HL115828 & R01HL117888. Y. W. performed imaging procedures and analysis. Y. W. was also funded by the National Institutes of Health grant #R01-MH080636. Y. G. and H. D. performed statistical analysis and manuscript preparation. S.K. performed early infection assays, Luminex analysis, and manuscript preparation. C. S. performed imaging procedures and analysis. C. S. was funded by the National Institutes of Health grant #R01-MH080636 and R25NS080949. C. K. conducted participant visits, and performed image analysis, data management, and manuscript preparation. C. K. was funded by the National Institutes of Health grant #R01-MH080636 and R25NS080949. L. G. E. interpreted findings and performed manuscript preparation. L. G. E. is funded by National Institutes of Health grant #5R01NS043209-09, #1U10NS077271-01 & R25NS080949. None of the authors reported conflicts of interest.
Conflict of Interest
None declared.
Supporting Information
Plasma levels of immune mediators in HIV seroconversion.
References
- Mellors JW, Rinaldo CR, Jr, Gupta P, et al. Prognosis in HIV-1 infection predicted by the quantity of virus in plasma. Science. 1996;272:1167–1170. doi: 10.1126/science.272.5265.1167. [Erratum in: Science 1997 Jan 3;275(5296):14]. [DOI] [PubMed] [Google Scholar]
- Lafeuillade A, Stevenson M. The search for a cure for persistent HIV reservoirs. AIDS Rev. 2011;13:63–66. [PubMed] [Google Scholar]
- Ragin AB, Du H, Ochs R, et al. Structural brain alterations can be detected early in HIV infection. Neurology. 2012;79:2328–2334. doi: 10.1212/WNL.0b013e318278b5b4. [DOI] [PMC free article] [PubMed] [Google Scholar]
- Wang X, Foryt P, Ochs R, et al. Abnormalities in resting-state functional connectivity in early human immunodeficiency virus infection. Brain Connect. 2011;1:207–217. doi: 10.1089/brain.2011.0016. [DOI] [PMC free article] [PubMed] [Google Scholar]
- Keating SM, Hanson D, Lebedeva M, et al. Lower-sensitivity and avidity modifications of the VITROS anti-HIV 1+2 assay for detection of recent HIV infections and incidence estimation. J Clin Microbiol. 2012;50:3968–3976. doi: 10.1128/JCM.01454-12. [DOI] [PMC free article] [PubMed] [Google Scholar]
- Fiebig EW, Wright DJ, Rawal BD, et al. Dynamics of HIV viremia and antibody seroconversion in plasma donors: implications for diagnosis and staging of primary HIV infection. AIDS. 2003;17:1871–1879. doi: 10.1097/00002030-200309050-00005. [DOI] [PubMed] [Google Scholar]
- Smith SM, Zhang Y, Jenkinson M, et al. Accurate, robust, and automated longitudinal and cross-sectional brain change analysis. Neuroimage. 2002;17:479–489. doi: 10.1006/nimg.2002.1040. [DOI] [PubMed] [Google Scholar]
- Fischl B, Salat DH, Busa E, et al. Whole brain segmentation: automated labeling of neuroanatomical structures in the human brain. Neuron. 2002;33:341–355. doi: 10.1016/s0896-6273(02)00569-x. [DOI] [PubMed] [Google Scholar]
- Basser PJ, Pierpaoli C. Microstructural and physiological features of tissues elucidated by quantitative-diffusion-tensor MRI. J Magn Reson B. 1996;111:209–219. doi: 10.1006/jmrb.1996.0086. [DOI] [PubMed] [Google Scholar]
- Tate DF, Sampat M, Harezlak J, et al. Regional areas and widths of the midsagittal corpus callosum among HIV-infected patients on stable antiretroviral therapies. J Neurovirol. 2011;17:368–379. doi: 10.1007/s13365-011-0033-6. [DOI] [PMC free article] [PubMed] [Google Scholar]
- Anthony IC, Bell JE. The neuropathology of HIV/AIDS. Int Rev Psychiatry. 2008;20:15–24. doi: 10.1080/09540260701862037. [DOI] [PubMed] [Google Scholar]
- Becker JT, Sanders J, Madsen SK, et al. Subcortical brain atrophy persists even in HAART-regulated HIV disease. Brain Imaging Behav. 2011;5:77–85. doi: 10.1007/s11682-011-9113-8. [DOI] [PMC free article] [PubMed] [Google Scholar]
- Chiang MC, Dutton RA, Hayashi KM, et al. 3D pattern of brain atrophy in HIV/AIDS visualized using tensor-based morphometry. Neuroimage. 2007;34:44–60. doi: 10.1016/j.neuroimage.2006.08.030. [DOI] [PMC free article] [PubMed] [Google Scholar]
- Cohen RA, Harezlak J, Schifitto G, et al. Effects of nadir CD4 count and duration of human immunodeficiency virus infection on brain volumes in the highly active antiretroviral therapy era. J Neurovirol. 2010;16:25–32. doi: 10.3109/13550280903552420. [DOI] [PMC free article] [PubMed] [Google Scholar]
- Thompson MA, Aberg JA, Hoy JF, et al. Antiretroviral treatment of adult HIV infection: 2012 recommendations of the International Antiviral Society-USA panel. JAMA. 2012;308:387–402. doi: 10.1001/jama.2012.7961. [DOI] [PubMed] [Google Scholar]
- Thompson PM, Dutton RA, Hayashi KM, et al. 3D mapping of ventricular and corpus callosum abnormalities in HIV/AIDS. Neuroimage. 2006;31:12–23. doi: 10.1016/j.neuroimage.2005.11.043. [DOI] [PubMed] [Google Scholar]
- Wu Y, Storey P, Carrillo A, et al. Whole brain and localized magnetization transfer measurements are associated with cognitive impairment in patients infected with human immunodeficiency virus. AJNR Am J Neuroradiol. 2008;29:140–145. doi: 10.3174/ajnr.A0740. [DOI] [PMC free article] [PubMed] [Google Scholar]
- Wu Y, Storey P, Cohen BA, et al. Diffusion alterations in corpus callosum of patients with HIV. AJNR Am J Neuroradiol. 2006;27:656–660. [PMC free article] [PubMed] [Google Scholar]
- Wohlschlaeger J, Wenger E, Mehraein P, Weis S. White matter changes in HIV-1 infected brains: a combined gross anatomical and ultrastructural morphometric investigation of the corpus callosum. Clin Neurol Neurosurg. 2009;111:422–429. doi: 10.1016/j.clineuro.2008.12.006. [DOI] [PubMed] [Google Scholar]
- Sevigny JJ, Albert SM, McDermott MP, et al. Evaluation of HIV RNA and markers of immune activation as predictors of HIV-associated dementia. Neurology. 2004;63:2084–2090. doi: 10.1212/01.wnl.0000145763.68284.15. [DOI] [PubMed] [Google Scholar]
- Davis LE, Hjelle BL, Miller VE, et al. Early viral brain invasion in iatrogenic human immunodeficiency virus infection. Neurology. 1992;42:1736–1739. doi: 10.1212/wnl.42.9.1736. [DOI] [PubMed] [Google Scholar]
- Valcour V, Chalermchai T, Sailasuta N, et al. Central nervous system viral invasion and inflammation during acute HIV infection. J Infect Dis. 2012;206:275–282. doi: 10.1093/infdis/jis326. [DOI] [PMC free article] [PubMed] [Google Scholar]
- Spudich S, Gisslen M, Hagberg L, et al. Central nervous system immune activation characterizes primary human immunodeficiency virus 1 infection even in participants with minimal cerebrospinal fluid viral burden. J Infect Dis. 2011;204:753–760. doi: 10.1093/infdis/jir387. [Erratum appears in J Infect Dis 2002 Jun 1;185(11):1696]. [DOI] [PMC free article] [PubMed] [Google Scholar]
- Sailasuta N, Ross W, Ananworanich J, et al. Change in brain magnetic resonance spectroscopy after treatment during acute HIV infection. PLoS One. 2012;7:e49272. doi: 10.1371/journal.pone.0049272. [DOI] [PMC free article] [PubMed] [Google Scholar]
- Peluso MJ, Meyerhoff DJ, Price RW, et al. Cerebrospinal fluid and neuroimaging biomarker abnormalities suggest early neurological injury in a subset of individuals during primary HIV infection. J Infect Dis. 2013;207:1703–1712. doi: 10.1093/infdis/jit088. [Erratum appears in J Infect Dis 2002 Jun 1;185(11):1696]. [DOI] [PMC free article] [PubMed] [Google Scholar]
- Lentz MR, Kim WK, Lee V, et al. Changes in MRS neuronal markers and T cell phenotypes observed during early HIV infection. Neurology. 2009;72:1465–1472. doi: 10.1212/WNL.0b013e3181a2e90a. [DOI] [PMC free article] [PubMed] [Google Scholar]
- Ances BM, Sisti D, Vaida F, et al. Resting cerebral blood flow: a potential biomarker of the effects of HIV in the brain. Neurology. 2009;73:702–708. doi: 10.1212/WNL.0b013e3181b59a97. [DOI] [PMC free article] [PubMed] [Google Scholar]
- Thompson PM, Dutton RA, Hayashi KM, et al. Thinning of the cerebral cortex visualized in HIV/AIDS reflects CD4+ T lymphocyte decline. Proc Natl Acad Sci USA. 2005;102:15647–15652. doi: 10.1073/pnas.0502548102. [DOI] [PMC free article] [PubMed] [Google Scholar]
- Lamers SL, Gray RR, Salemi M, et al. HIV-1 phylogenetic analysis shows HIV-1 transits through the meninges to brain and peripheral tissues. Infect Genet Evol. 2010;11:31–37. doi: 10.1016/j.meegid.2010.10.016. [DOI] [PMC free article] [PubMed] [Google Scholar]
- Yoshizawa T, Motonishi S, Saitoh M. Case of acute primary HIV infection with menigoencephalitis demonstrating high signal intensity of the bilateral globus pallidus in T2-weighted MRI. Rinsho Shinkeigaku. 2007;47:597–600. [PubMed] [Google Scholar]
- Gartner S. HIV infection and dementia. Science. 2000;287:602–604. doi: 10.1126/science.287.5453.602. [DOI] [PubMed] [Google Scholar]
- Kim WK, Corey S, Alvarez X, Williams K. Monocyte/macrophage traffic in HIV and SIV encephalitis. J Leukoc Biol. 2003;74:650–656. doi: 10.1189/jlb.0503207. [DOI] [PubMed] [Google Scholar]
- Koenig S, Gendelman HE, Orenstein JM, et al. Detection of AIDS virus in macrophages in brain tissue from AIDS patients with encephalopathy. Science. 1986;233:1089–1093. doi: 10.1126/science.3016903. [DOI] [PubMed] [Google Scholar]
- Stacey AR, Norris PJ, Qin L, et al. Induction of a striking systemic cytokine cascade prior to peak viremia in acute human immunodeficiency virus type 1 infection, in contrast to more modest and delayed responses in acute hepatitis B and C virus infections. J Virol. 2009;83:3719–3733. doi: 10.1128/JVI.01844-08. [DOI] [PMC free article] [PubMed] [Google Scholar]
- Toborek M, Lee YW, Flora G, et al. Mechanisms of the blood-brain barrier disruption in HIV-1 infection. Cell Mol Neurobiol. 2005;25:181–199. doi: 10.1007/s10571-004-1383-x. [DOI] [PMC free article] [PubMed] [Google Scholar]
- Marra CM, Maxwell CL, Collier AC, et al. Interpreting cerebrospinal fluid pleocytosis in HIV in the era of potent antiretroviral therapy. BMC Infect Dis. 2007;7:37. doi: 10.1186/1471-2334-7-37. [DOI] [PMC free article] [PubMed] [Google Scholar]
- Nolte J. The human brain: an introduction to its functional anatomy. 6 ed. St. Louis Missouri: Mosby-Elsevier; 2009. [Google Scholar]
- Lindl KA, Marks DR, Kolson DL, Jordan-Sciutto KL. HIV-associated neurocognitive disorder: pathogenesis and therapeutic opportunities. J Neuroimmune Pharmacol. 2010;5:294–309. doi: 10.1007/s11481-010-9205-z. [DOI] [PMC free article] [PubMed] [Google Scholar]
- Haughey NJ, Nath A, Mattson MP, et al. HIV-1 Tat through phosphorylation of NMDA receptors potentiates glutamate excitotoxicity. J Neurochem. 2001;78:457–467. doi: 10.1046/j.1471-4159.2001.00396.x. [DOI] [PubMed] [Google Scholar]
- Eugenin EA, King JE, Nath A, et al. HIV-tat induces formation of an LRP-PSD-95- NMDAR-nNOS complex that promotes apoptosis in neurons and astrocytes. Proc Natl Acad Sci USA. 2007;104:3438–3443. doi: 10.1073/pnas.0611699104. [DOI] [PMC free article] [PubMed] [Google Scholar]
- Nath A, Conant K, Chen P, et al. Transient exposure to HIV-1 Tat protein results in cytokine production in macrophages and astrocytes: a hit and run phenomenon. J Biol Chem. 1999;274:17098–17102. doi: 10.1074/jbc.274.24.17098. [DOI] [PubMed] [Google Scholar]
- Borrow P, Bhardwaj N. Innate immune responses in primary HIV-1 infection. Curr Opin HIV AIDS. 2008;3:36–44. doi: 10.1097/COH.0b013e3282f2bce7. [DOI] [PMC free article] [PubMed] [Google Scholar]
- Garvey LJ, Pavese N, Politis M, et al. Increased microglia activation in neurologically asymptomatic HIV-infected patients receiving effective ART. AIDS. 2014;28:67–72. doi: 10.1097/01.aids.0000432467.54003.f7. [DOI] [PubMed] [Google Scholar]
- Ellis RJ, Badiee J, Vaida F, et al. CD4 nadir is a predictor of HIV neurocognitive impairment in the era of combination antiretroviral therapy. AIDS. 2011;25:1747–1751. doi: 10.1097/QAD.0b013e32834a40cd. [DOI] [PMC free article] [PubMed] [Google Scholar]
- Sacktor NC, Bacellar H, Hoover DR, et al. Psychomotor slowing in HIV infection: a predictor of dementia, AIDS and death. J Neurovirol. 1996;2:404–410. doi: 10.3109/13550289609146906. [DOI] [PubMed] [Google Scholar]
- Brenchley JM, Schacker TW, Ruff LE, et al. CD4+ T cell depletion during all stages of HIV disease occurs predominantly in the gastrointestinal tract. J Exp Med. 2004;200:749–759. doi: 10.1084/jem.20040874. [DOI] [PMC free article] [PubMed] [Google Scholar]
- Schmid A, Gianella S, von Wyl V, et al. Profound depletion of HIV-1 transcription in patients initiating antiretroviral therapy during acute infection. PLoS One. 2010;5:e13310. doi: 10.1371/journal.pone.0013310. [DOI] [PMC free article] [PubMed] [Google Scholar]
- Le T, Wright EJ, Smith DM, et al. Enhanced CD4+ T-cell recovery with earlier HIV-1 antiretroviral therapy. N Engl J Med. 2013;368:218–230. doi: 10.1056/NEJMoa1110187. [DOI] [PMC free article] [PubMed] [Google Scholar]
- Tovar-y-Romo LB, Bumpus NN, Pomerantz D, et al. Dendritic spine injury induced by the 8-hydroxy metabolite of efavirenz. J Pharmacol Exp Ther. 2012;343:696–703. doi: 10.1124/jpet.112.195701. [DOI] [PMC free article] [PubMed] [Google Scholar]
Associated Data
This section collects any data citations, data availability statements, or supplementary materials included in this article.
Supplementary Materials
Plasma levels of immune mediators in HIV seroconversion.