

Abstract
Background and Purpose
Histone deacetylase 6 (HDAC6) and silent information regulator 2 (SIRT2) control the dynamics of the microtubule network via their deacetylase activities. Tubulin polymerization promoting protein (TPPP/p25) enhances microtubule acetylation by its direct binding to HDAC6. Our objective was to characterize the multiple interactions of the deacetylases and to establish the inhibitory potency and the pharmacokinetic features of the deacetylase inhibitors, trichostatin A (TSA) and AGK2.
Experimental Approach
The interactions of deacetylases with tubulin and TPPP/p25 were quantified by elisa using human recombinant proteins. The effect of inhibitors on the tubulin acetylation was established in HeLa cells transfected with pTPPP and CG-4 cells expressing TPPP/p25 endogenously by celisa (elisa on cells), Western blot and immunofluorescence microscopy. The pharmacokinetic features of the inhibitors were evaluated by in situ kinetic modelling of their intestinal transport in rats.
Key Results
Deacetylases interact with both tubulin and TPPP/p25, notwithstanding piggy-back binding of HDAC6 or SIRT2 to the TPPP/p25-associated tubulin was established. Much higher inhibitory potency for TSA than for AGK2 was detected in both HeLa and CG-4 cells. Pioneer pharmacokinetic studies revealed passive diffusion and diffusion coupled with secretion for TSA and AGK2 respectively. Both inhibitors exhibited greater permeability than some other well-established drugs.
Conclusions and Implications
TPPP/p25-directed deacetylase inhibition provides mechanisms for the fine control of the dynamics and stability of the microtubule network. Deacetylase inhibitors with chemical structures similar to TSA and AGK2 appear to be excellent candidates for oral drug absorption.
Tables of Links
| TARGETS |
|---|
| α-tubulin |
| Enzymes |
| HDAC6, histone deacetylase 6 |
| SIRT2, sirtuin 2 |
| LIGANDS |
|---|
| TSA, trichostatin A |
These Tables list key protein targets and ligands in this article which are hyperlinked to corresponding entries in http://www.guidetopharmacology.org, the common portal for data from the IUPHAR/BPS Guide to PHARMACOLOGY (Pawson et al., 2014) and are permanently archived in the Concise Guide to PHARMACOLOGY 2013/14 (Alexander et al., 2013).
Introduction
Microtubules, which form a major constituent of the cytoskeleton, play key roles in both physiological and pathological processes of eukaryotic cells (Conde and Cáceres, 2009; De Forges et al., 2012). The many functions of the highly dynamic microtubule network are achieved by static and dynamic associations of macromolecules and ligands and by post-translational modifications (Konno et al., 2012). The formation and maintenance of the dynamics and stability of the microtubule network during differentiation, cellular polarization and migration rely on the pronounced reorganization of the cytoskeleton (Reed et al., 2006; Tran et al., 2007; Bauer et al., 2009). One of the crucial factors affecting the function of the microtubule network is its acetylation by the action of an acetyltransferase complex (Ohkawa et al., 2008) and atypical histone deacetylases (HDACs) such as NAD+-dependent silent information regulator 2 (SIRT2) and HDAC6 (Hubbert et al., 2002; North et al., 2003) which modify α-tubulin at residue Lys40.
A recently identified microtubule associated protein (MAP) is the disordered tubulin polymerization promoting protein (TPPP/p25), the physiological function of which is the dynamic stabilization of microtubular ultrastructures via its bundling and acetylation promoting activities (Hlavanda et al., 2002; Tőkési et al., 2010). TPPP/p25 is expressed predominantly in oligodendrocytes of normal brain and is crucial to their differentiation/myelinization, consequently to the ensheathment of axons (Takahashi et al., 1993; Lehotzky et al., 2010). Cancer cells such as glioma do not express TPPP/p25; however, in certain neurological disorders it is enriched and co-localizes with α-synuclein in neuronal and glial inclusions of brain tissues of patients suffering from Parkinson's disease or multiple system atrophy respectively (Kovács et al., 2004; Preusser et al., 2007). The tubulin acetylation involved in the aggresome/inclusion formation provides a cytoprotective mechanism (Kopito, 2000).
The class II HDAC6 is a well characterized tubulin deacetylase which is ubiquitously expressed and conserved in a wide range of species (Yang et al., 1997). HDAC6 has a primary cytoplasmic localization and its inhibition by a specific inhibitor or by RNA interference can increase the acetylated tubulin level and alter cell motility (Parmigiani et al., 2008). SIRT2 is another tubulin deacetylase implicated in the mitotic regulation of the microtubule dynamics through its binding to HDAC6 (Nahhas et al., 2007). SIRT2 is expressed in oligodendrocytes and decelerates cellular differentiation through deacetylation of α-tubulin. The knock-down of SIRT2 in oligodendrocytes increased α-tubulin acetylation and the complexity of cellular arborization, whereas its overexpression had the opposite effect (Li et al., 2007). Much less is known about the tubulin acetyltransferase(s) responsible for tubulin acetylation (Ohkawa et al., 2008; Creppe et al., 2009).
In this work, we elaborated a complex test system to characterize the effect of the inhibition of deacetylases on the acetylation level and ultrastructure of the microtubule network. Experiments were performed at molecular and cell levels with purified proteins and HeLa/CG-4 cells using well-established inhibitors, trichostatin A (TSA) for HDAC6 (Furumai et al., 2001) and AGK2 for SIRT2 (Outeiro et al., 2007). Moreover, the absorption mechanism of AGK2 and TSA was determined using in situ loop technique and adequate pharmacokinetic analysis of the data.
Methods
elisa
The plate was coated with 2.5 μg·mL−1 (50 μL/well) protein solution (HDAC6 or SIRT2) in PBS overnight at 4°C. The wells were blocked with 1 mg·mL−1 BSA in PBS for 1 h at room temperature. Next, the plate was incubated with serial dilutions of an interacting partner (TPPP/p25 or tubulin) for 1 h at room temperature in PBS. Where indicated, after the addition of tubulin, TPPP/p25 was added to the plate in constant concentration without washing (200 nM), and the plate was incubated with both partners for 1 h in PBS. Then the plate was sequentially incubated with the corresponding antibody produced against TPPP/p25 (Höftberger et al., 2010) or tubulin (Sigma T6199), and with the secondary anti-mouse IgG conjugated to HRP (Sigma). Both antibodies were in PBS buffer containing 1 mg·mL−1 BSA, and incubated for 1 h at room temperature. Between each incubation steps, the wells were washed thrice. The presence of antibodies was detected using o-phenylenediamine in the concentration of 3.7 mM with 0.03% peroxide as substrate solution. The peroxidase catalysed reaction was stopped after 10 min with 1 M H2SO4; absorbance was read at 490 nm with a Wallace Victor 2 multiplate reader (Perkin Elmer, Waltham, MA, USA).
elisa on cells (celisa)
CG-4 cells on tissue culture plate after manipulation were fixed by ice-cold methanol for 10 min. Next, the wells were rehydrated by PBS, and blocked with 1 mg·mL−1 BSA in PBS containing 0.1% Triton-X-100 (TPB) for 1 h at room temperature. Then the plate was sequentially incubated with monoclonal anti-acetylated tubulin antibody (6-11B-1; Sigma) and with anti-mouse IgG-peroxidase conjugate. Both antibodies were in PBS buffer containing 1 mg·mL−1 BSA and 0.1% TPB, and incubated for 1 h at room temperature. Between each incubation step, the wells were washed thrice with PBS for 5 min. The presence of acetylated α-tubulin (Lys40) was detected using o-phenylenediamine as described above.
Cell culture, transfection and manipulation
HeLa cells (ATCC® CCL-2™, American Type Culture Collection, Wesel, Germany) were grown in DMEM supplemented with 10% fetal calf serum (FCS) and antibiotic solution in a humidified incubator at 37°C with 5% CO2. Cells were grown on 12-mm-diameter glass coverslips for microscopic analysis and on 24-well plates for immunoblotting. Transient transfection of HeLa cells with pEGFP/p25 (Lehotzky et al., 2004) was carried out with Fugene HD reagent (Promega, Madison, WI, USA) according to the manufacturer's instructions. The samples were analysed 24 h after transfection by immunocytochemistry. To detect alteration in acetylation level, inhibitors were added for 3 h, and then samples were processed as described in the different methods.
The CG-4 cell line [with passage number 17 were kindly provided by Dr. Jean-Claude Louis (Amgen, Thousand Oaks, CA, USA)] was propagated in DMEM-N1 medium containing 30% of the same medium conditioned by the neuroblastoma cell line B104 (70/30 media) (Louis et al., 1992; Lehotzky et al., 2010) on poly-L-ornithine-coated tissue culture vessels. To promote the maturation of oligodendrocyte progenitor cells into differentiated oligodendrocytes, the CG-4 cells were grown in DMEM-N1 medium supplemented with 40 ng·mL−1 triiodothyronine (Sigma) and 20 ng·mL−1 ciliary neurotrophic factor (Sigma) (Oligo media) (Wang et al., 2006) incubating cells for 4 days. For immunofluorescence microscopy, 2 × 10⁴ cells were plated onto poly-L-ornithine-coated glass coverslips in 70/30 or Oligo medium.
Immunocytochemistry
Cells were fixed with ice-cold methanol for 10 min. After washes in PBS, samples were blocked for 30 min in PBS-0.1% TPB containing 5% FCS (TPB-FCS). Subsequently, the cells were stained with a monoclonal antibody against Lys-40-acetylated-α-tubulin (6-11B-1) followed by Alexa 546 conjugated anti-mouse antibody (Life Technologies, Budapest, Hungary) or were stained with the same antibody and a polyclonal rat serum against TPPP/p25 (Kovács et al., 2004) followed by Alexa 488 and Alexa 546 conjugated anti-mouse and anti-rat antibodies respectively (both from Invitrogen and cross absorbed). Alternatively, the cells were stained with a monoclonal antibody against α-tubulin (clone DM1A; Sigma) and a polyclonal rat serum against TPPP/p25 (Kovács et al., 2004) followed by Alexa 488 and Alexa 546 conjugated anti-mouse and anti-rat antibodies respectively (both from Invitrogen and cross absorbed). In transfected samples, signal of eGFP was used for detection of the construct. The samples were washed three times with PBS after each antibody incubation.
Coverslips were mounted with FluoroMount (Sigma) and sealed with DPX Mountant (Sigma). Nuclei were counterstained with DAPI. Images of mounted samples were acquired on a Leica DMLS microscope as previously described (Tőkési et al., 2010).
Immunoblotting
Acetylated tubulin, tubulin and glyceraldehyde-3-phosphate dehydrogenase were detected by Western blot using a monoclonal antibody against Lys-40-acetylated-α-tubulin (6-11B-1), a monoclonal antibody against α-tubulin (clone DM1A) and a monoclonal antibody against glyceraldehyde-3-phosphate dehydrogenase (CB1001, 6C5; Calbiochem, Merck Kft, Budapest, Hungary) respectively.
Analytical determination of AGK2 and TSA
Chromatographic analyses of AGK2 and TSA purchased from Sigma were performed by means of HPLC, a Waters 2487 Dual λ absorbance and fluorescence detector (Waters Corporation, Milford, MA, USA). Peak recording and integration were done by interfacing the chromatographic system with a computer running Waters Empower™ system software (Waters Corporation).
Standard solutions of AGK2 and TSA were prepared by proper dilution of the stock solution in DMSO with Hank's balanced salt solution. The final % of DMSO was not more than 1%. Calibration curve was prepared in the range of 1–100%, depending on the concentration of drug to be perfused into the intestine. Samples of 200–250 μL were taken from the intestinal lumen at fixed time intervals after drug perfusion. The aliquots were centrifuged at 2520× g for 5 min and the supernatants were separated and injected directly into the chromatographic system (Rodriguez-Berna et al., 2013; Samiei et al., 2013). The system consisted of a stainless steel, 5 μm, 4 × 200 mm Novapack C18 column (Waters Corporation). In the case of AGK2, the mobile phase consisted of a volumetric 65/35 acid water : methanol (Sigma) mixture containing 0.1% trifluoroacetic acid (Uvasol; Merck, Madrid, Spain). The flow rate was maintained at 1 mL·min−1 at room temperature and detection was performed at 225 nm. Retention time was 1.23 ± 0.13 min. In the case of TSA, the mobile phase consisted of a volumetric 30/70 acid water : acetonitrile (Sigma) mixture containing 0.1% trifluoroacetic acid (Uvasol). The flow rate was maintained at 1 mL·min−1 at room temperature and detection was performed at 310–395 nm. Retention time was 1.30 ± 0.18 min.
In situ absorption experiments with AGK2 and TSA
All animal care and experimental procedures followed the guidelines described in the EC Directive 86/609, the Council of the Europe Convention ETS 123 and Spanish national laws governing the use of animals in research (Real Decreto 223/1988, BOE 67, 18-3-98: 8509-8511; Project reference DI-MBS-04-12) and was approved by the Scientific Committee of the Faculty of Pharmacy, Miguel Hernandez University. All studies involving animals are reported in accordance with the ARRIVE guidelines for reporting experiments involving animals (Kilkenny et al., 2010; McGrath et al., 2010). A total of 35 animals were used in the experiments described here.
Male Wistar rats were provided by the Animal Facility of the Miguel Hernandez University and maintained on a 12 h light/dark cycle in a temperature-controlled environment with free access to food and water. The absorption experiments were performed using an in situ loop technique previously described by Doluisio et al. (1969). In situ perfusion experiments were performed in seven groups of rats (n = 6). Cleaning solution (solution A) (pH 7.4) comprising 9.2 g NaCl, 0.34 g KCl, 0.19 g CaCl2.H2O and 0.76 g NaH2PO4.2 H2O per litre was used in this study, unless stated otherwise. Rats weighing 280–320 g were used after 4 h of fasting. Under anaesthesia, a loop was isolated from duodenal and ileal regions of each rat. The proximal ligatures of the duodenal and ileal regions were placed approximately 1 cm from the pylorus and 2 cm above the ileocecal junction. The bile duct was tight up in all experiments. After the content of the loop was gently flushed out by 50 mL of solution A, 20 mL volume of solution B (comprising NaCl g, NaH2PO4*2H2O 1/15 M 3.9 mL, Na2HPO4 1/15 M 6.1 mL and water up to 1 L) was perfused to condition the intestinal mucosa prior to the experiments. A catheter was tied into both intestinal ends and connected to a glass syringe by the use of a stopcock-type valve. Under this set-up, the intestinal segment is an isolated compartment and the drug solution can be perfused and tested with the help of the syringes and the stopcock valve (Figure 1). The drug solution was prepared by exactly weighing the drug and dilution in solution B. The drug solution (10 mL) was perfused into the loop and then the entire intestine was restored into the abdominal cavity. The body temperature was maintained during anaesthesia by heating with a lamp. Solution A, solution B and drug solutions were heated at 37°C in advance.
Figure 1.
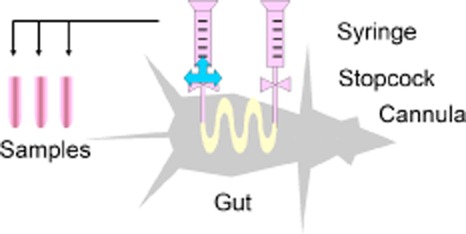
Set-up of the in situ absorption experiments in rats.
In situ perfusion of the whole small intestine (closed loop) was carried out to characterize the concentration dependence of the absorption process. Concentrations assayed were 1 μM, 10 and 100 μM for AGK2, and 10, 50, 100 and 500 μM for TSA in order to detect active transporters involved in permeation rate of the drug across intestinal membrane.
Pharmacokinetic analysis of the absorption mechanism
The apparent first-order absorption rate coefficients (ka) were obtained by non-linear fitting of a monoexponential equation to the luminal concentrations versus time.
| 1 |
where C is the drug concentration remaining in the lumen, ka is the apparent absorption rate constant, and C0 the intercept that corresponds to a fraction of the initial perfusion concentration. After placing the test drug solution in the lumen, there is a slight dilution due to the remaining cleaning solution, the adsorption to the membrane and the loading process in the enterocyte. These processes lead to the initial decrease of lumen concentration, making the intercept, C0, lower than the perfusion concentration. Once these processes have finished, a quasi-steady state is achieved in the membrane, and the compound disappearing from lumen is crossing the membrane of the enterocyte. Under these conditions, the disappearance from the lumen can be considered as a first-order process during the sampling time interval. For these reasons, only the concentrations obtained after 5 min were used for regression analysis.
The intestinal permeability values were calculated taking into account the relationship between ka and Peff.
| 2 |
where R is the radius of the intestinal segment, calculated as area/volume ratio. The effective intestinal permeabilities (Peff) of the tested compounds (means of at least three animals) were used as indexes of the absorption effectiveness. In order to classify these compounds as having high or low permeability, the corresponding oral fraction absorbed was estimated from permeability values. Oral fraction absorbed was calculated according to Equation 2009:
| 3 |
where Fa is the oral fraction absorbed and T is the coefficient estimated from non-linear regression.
Modelling of intestinal absorption mechanism of AGK2 and TSA in rats
In order to determine the absorption mechanism of AGK2 and TSA, several semi-mechanistic absorption models were implemented using differential equations as follows (Equations 4–6,,):
Passive first-order absorption:
| 4 |
Passive and efflux mechanism:
| 5 |
Passive and influx mechanism:
| 6 |
where ka represents the passive absorption rate coefficient, Vm the maximum transport rate, and Km the Michaelis–Menten constant (the concentration of the substrate at which the transport rate is half of the maximum, Vm/2). Initial concentration can be reduced due to the adsorption of the drug to the intestinal membrane; a correction factor (A) was included to take it into account.
Data analysis
Experimental datasets were analysed using a non-linear mixed-effects approach, which allows estimating the typical or mean tendency, individual behaviour, and quantifies the magnitude of residual error (Beal et al., 1989–2011). Inter-individual and residual variability were modelled with an exponential model. Population and individual parameters were obtained using software NONMEM 7.2 and PsN (Beal et al., 1989–2011; Lindbom et al., 2005). Goodness of fit plots were used to visually discriminate between models and select the best model. All graphs were generated in R 2.14.
Materials
Human recombinant TPPP/p25 possessing His-tag tail at C-terminus was expressed in Escherichia coli BL21 (DE3) cells and isolated on His-Select™ Cartridge (Sigma H8286) as described previously (Kovács et al., 2004). Human recombinant HDAC6 (50006) and SIRT2 (50013) were purchased from BPS Bioscience (Camarillo, CA, USA). AGK2 (304896-28-4) and TSA (58880-19-6) (Figure 2) were Sigma products.
Figure 2.
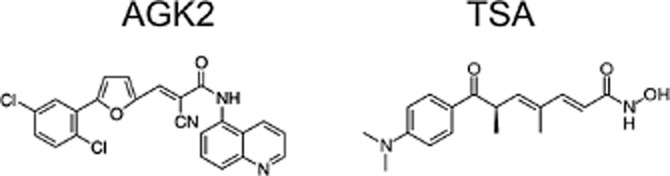
Chemical structures of AGK2 (left) and TSA (right).
Results
Multiple interactions of tubulin deacetylases
Previously, we showed that the HDAC6-dependent acetylation of the tubulin/microtubule network is stimulated by TPPP/p25, a brain-specific MAP (Tőkési et al., 2010). However, there is another deacetylase of the HDAC family, SIRT2, which also displays tubulin deacetylase activity in the cytosol (North et al., 2003). In this work, we have studied the interactions of tubulin deacetylases with both tubulin and TPPP/p25 that are involved in the determination of the acetylation level of the microtubule network.
First, we carried out in vitro elisa experiments in which human recombinant HDAC6 or SIRT2 was immobilized on the plate, and tubulin and/or TPPP/p25 were added with serial dilutions to the immobilized deacetylases; and the hetero-associations of the proteins were quantified by specific anti-tubulin or anti-TPPP/p25 antibodies.
Figure 3A shows that both deacetylases bound TPPP/p25 with comparable affinity and Kd values were 0.0053 ± 0.00076 μM and 0.027 ± 0.0033 μM for the HDAC6 and SIRT2\ respectively. The titration data of tubulin with the deacetylases also revealed hetero-associations and Kd values were 9.9 ± 2.2 μM and 1.7 ± 0.27 μM for the HDAC6 and SIRT2 respectively (Figure 3B and C), indicating weaker affinities as compared with the interactions of TPPP/p25 and deacetylases. As our earlier analysis provided evidence for the tight interaction of tubulin with TPPP/p25 (Kd = 0.0105 ± 0.0012 μM) (Oláh et al., 2011), we wanted to know whether the TPPP/p25 competes with the deacetylases for the tubulin binding. Thus, the immobilized HDAC6 or SIRT2 was titrated with tubulin in the presence of TPPP/p25 at constant concentration (200 nM). As shown in Figure 3B and C – in contrast to the expectations – the binding of the tubulin to the immobilized proteins was significantly stronger in the presence of TPPP/p25 (Kd values are 0.059 ± 0.017 μM and 0.18 ± 0.051 μM for the HDAC6 and SIRT2 respectively). This finding suggests the crucial role of the TPPP/p25 in a piggy-back-type binding of HDAC6/SIRT2 to tubulin. Recently, we have shown that the tubulin acetylation level increases due to the inhibition of the deacetylase activity of HDAC6 by TPPP/p25 (Tőkési et al., 2010); now in the light of the present data summarized in Figure 3D, we established a more complex mechanism for TPPP/p25-stimulated tubulin acetylation.
Figure 3.

Multiple interactions of tubulin deacetylases with tubulin and TPPP/p25 followed by elisa. (A) The plate was coated with HDAC6 or SIRT2, then it was incubated with TPPP/p25 at different concentrations. Normalized absorbance was calculated as the absorbance at a given TPPP/p25 concentration divided by the absorbance at saturation. (B, C) The plate was coated with HDAC6 (B) or SIRT2 (C), then it was incubated with tubulin at different concentrations in the absence or in the presence of 200 nM TPPP/p25, the interaction was detected by tubulin antibody. The apparent dissociation constants (Kd) characteristic for the interactions were evaluated by non-linear fitting of the hyperbolic saturation curves using the Microcal Origin 8.0 software (OriginLab Corporation, Northampton, MA, USA). The different symbols indicate independent sets of experiments. (D) Scheme of multiple interactions of tubulin, TPPP/p25 and deacetylases with the affinity constants, Kd.
As shown in Figure 4, the acetylation level of the microtubule network in living transfected HeLa and CG-4 cells expressing TPPP/p25 ectopically and endogenously, respectively, is promoted by the expression of TPPP/p25 as detected by immunofluorescence microscopy. Under these conditions, the microtubule network is highly acetylated in the TPPP/p25-expressing cells because similar networks can be visualized by staining them with either anti-tubulin or anti-acetyl-tubulin antibodies (Figure 4B).
Figure 4.
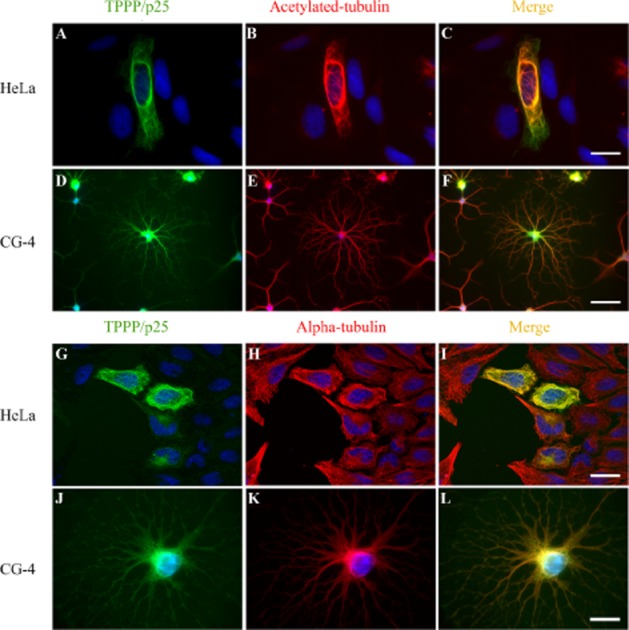
Effect of TPPP/p25 expression on the acetylation level of microtubule network. Acetylated microtubules (red, B and C, E and F) or microtubules (red, H and I, K and L) in transfected HeLa and CG-4 cells expressing TPPP/p25 (green) as visualized by immunofluorescence microscopy. TPPP/p25 was visualized by specific monoclonal anti-TPPP/p25 as described by Höftberger et al. (2010). Nuclei were counterstained with DAPI (blue). Scale bar: 25 μm (A–C, G–I), 10 μm (D–F) and 5 μm (J–L) for HeLa and CG-4 cells respectively.
Inhibitory potency of deacetylase inhibitors
The inhibitory (acetylation enhancing) potencies of TSA and AGK2, which are well-established inhibitors of HDAC6 and SIRT2, respectively, were visualized in HeLa cells which do not express TPPP/p25 endogenously; their microtubule network is virtually not acetylated (Figure 5). The addition of deacetylase inhibitors resulted in enhanced acetylation of the microtubule network. However, as illustrated by the Western blot data and immunofluorescence microscopic images in Figure 5, there was a significant difference in the acetylation level (red) which may have indicated the different potency of the inhibitors. While 1 μM TSA resulted in maximal acetylation of the microtubule network (anti-tubulin staining produced a similar image for the microtubule network), treatment of the cells with 100 μM AGK2 resulted in only a limited level of acetylation.
Figure 5.
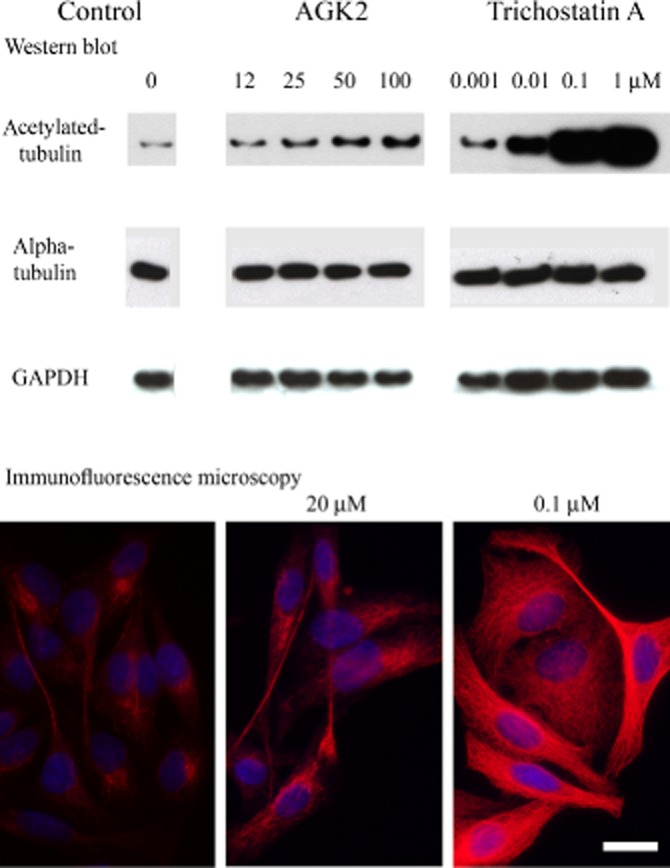
Acetylation level of the microtubule network (red) in HeLa cells as visualized by immunofluorescence microscopy and Western blot in the absence and presence of TSA or AGK2. Nuclei were counterstained with DAPI (blue). Tubulin and GAPDH levels were also determined by Western blot. Scale bar: 12.5 μm.
The effect of the inhibitors of the two deacetylases on the degree of microtubule acetylation was quantified by means of celisa in CG-4 cells as described in Methods (Figure 6). The IC50 values were evaluated by non-linear fitting of the curves, and were found to be 0.89 ± 0.33 nM and 26 ± 12 nM for TSA and AGK2 respectively. These findings underline the dominant role of HDAC6 as compared with that of SIRT2 in spite of the fact that SIRT2 is a deacetylase which displays a significant deacetylase activity in oligodendrocytes such as CG-4 cells (Tang and Chua, 2008). A tentative model shown in Figure 7 summarizes the effects of the inhibitors of the tubulin deacetylases, TSA, AGK2 and TPPP/p25 on the acetylation level of the tubulin/microtubule network.
Figure 6.
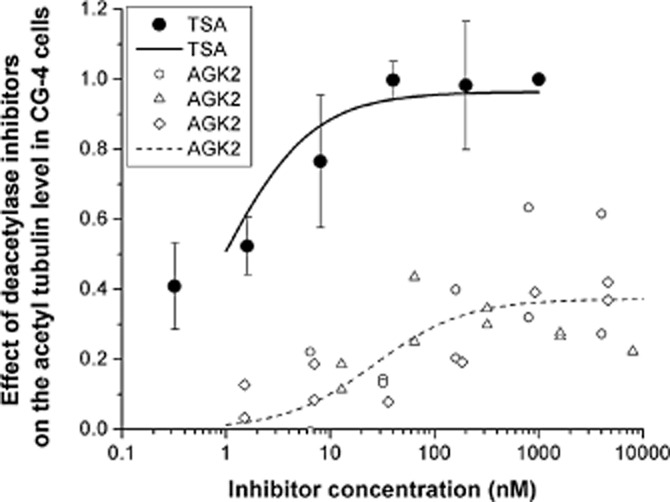
Increase of tubulin acetylation caused by TSA and AGK2, as detected in CG-4 cells by celisa assay. The acetylation level was detected by a specific anti-acetyl tubulin antibody, the absorbance was measured at 490 nm. The control values (no TSA or AGK2) were subtracted from the measured ones. The effect of inhibitors was calculated as the value at a given inhibitor concentration divided by the saturation value (at the highest TSA concentration). The IC50 values were evaluated by non-linear fitting of the hyperbolic saturation curves using the Microcal Origin 8.0 software. The average of three independent sets of experiments and the SEM are shown for TSA. The different symbols indicate independent sets of experiments for AGK2.
Figure 7.
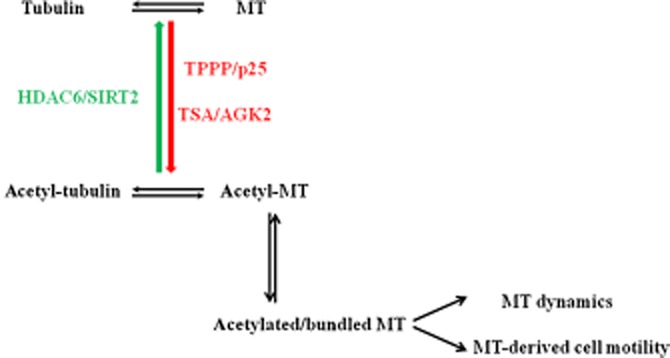
Effect of inhibitors of tubulin deacetylases leading to the modulation of the dynamics of microtubule system.
Although the innovation to produce new selective synthetic inhibitors is compelling, not very much effort has been made, if at all, to establish the pharmacokinetic characteristics of the potential inhibitors. As a pioneer survey, we have performed in situ intestinal perfusion experiments in rats to establish the absorption mechanism and parameters of the AGK2 and TSA as prototypes of deacetylase inhibitors.
Pharmacokinetic analysis of the absorption mechanism
Intestinal absorption is one of the major concerns in the development of new drugs. The study of drug absorption mechanisms is relevant to the selection of the route, dose and frequency of administration. In situ preclinical studies are necessary to obtain initial data for the features of potential biopharmaceutical drugs displaying deacetylase inhibitory activity. AGK2 and TSA have great potential as inhibitors of SIRT2 and HDAC6, respectively, at molecular and cell levels as detected; thus, we have analysed their absorption mechanism in the intestinal lumen and their potential as lead compounds of deacetylase inhibitors intended for administration by the oral route.
Absorption rate constants were determined for both TSA and AGK2 at different concentrations according to Equation 2013. Results summarized in Figure 8 show an increase of the absorption rate constant (ka) as a function of AGK2 concentration, whereas no change in ka values was established in the case of TSA.
Figure 8.
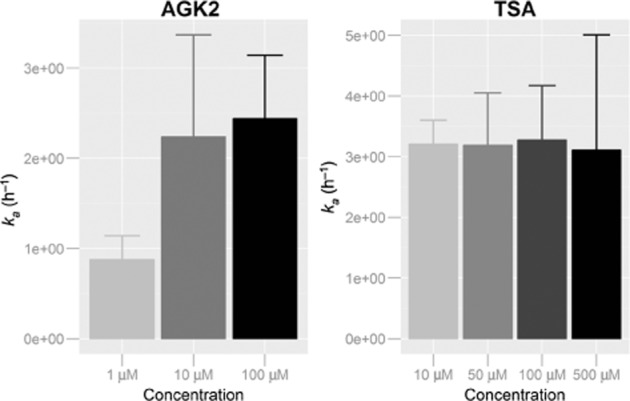
Apparent first-order absorption rate constants obtained at different drug concentrations.
Modelling of intestinal absorption mechanism of AGK2 and TSA in rats
Different semi-mechanistic models were employed in order to determine quantitatively the mechanism of absorption of AGK2 and TSA. Results from the best model are summarized in Tables 1 and 2. The study of the absorption mechanism of AGK2 showed a combined diffusion and saturable Michaelis–Menten secretion as the best kinetic model. On the contrary, for TSA, a passive diffusion mechanism was established as the best model. Inter-individual variability (ω2) in the ka was very low for both drugs (8% for AGK2 and 11% for TSA) and the residual variability (σ2) was well characterized with a 0.5% for AGK2 and 14.3% for TSA. Relative standard errors were adequately estimated with low values, indicating a reasonably good estimation of the pharmacokinetic parameters.
Table 1.
Parameters for the in situ best model for AGK2 (passive diffusion and an active Michaelis–Menten secretion)
| Parameter | Value | RSE (%) |
|---|---|---|
| ka (min−1) | 0.04 | 12.0 |
| 100 μM (%) | 75 | 3.1 |
| 10 μM (%) | 87 | 4.9 |
| 1 μM (%) | 98 | 5.7 |
| Vm (nmol·min−1) | 0.01 | 27.3 |
| Km (μM) | 0.01 fix | – |
| ω2 (CV%) | 8.0 | 6.2 |
| σ2 (CV%) | 0.5 | 2.3 |
ω2, interindividual variability;
Σ2, residual variability;
RSE, relative standard error.
Table 2.
Parameters for the in situ best model for TSA (passive diffusion)
| Parameter | Value | RSE (%) |
|---|---|---|
| ka (min−1) | 0.0545 | 8.8 |
| 500 μM (%) | 85.3 | 4.2 |
| 100 μM (%) | 104 | 7.9 |
| 50 μM (%) | 107 | 21.9 |
| 10 μM (%) | 124 | 11.9 |
| ω2 (CV%) | 11.0 | 39.4 |
| σ2 (CV%) | 14.3 | 11.3 |
ω2, interindividual variability;
Σ2, residual variability;
RSE, relative standard error.
Time-dependent AGK2 and TSA concentrations in lumen of each rat were determined at different initial concentrations of the inhibitors as shown in Figure 9. The mean prediction of each concentration for each compound was plotted. Good predictions of the best model (blue lines) for each compound were observed from the simultaneous analysis of all experimental data from each compound. Other goodness of fit plots are included as Supporting Information Figs S1 and S2.
Figure 9.
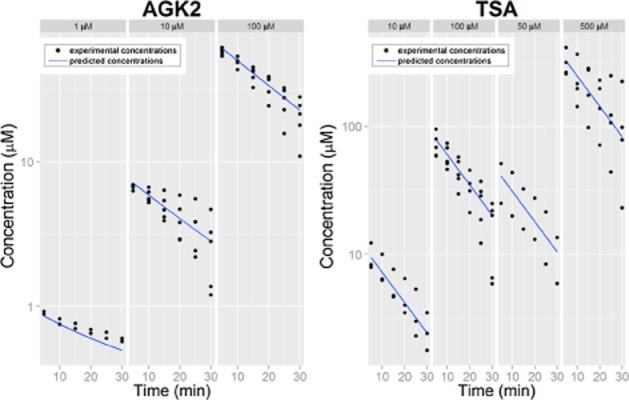
Experimental lumen concentrations and predicted concentrations of each concentration of each compound.
Permeability values were estimated from the absorption rate constant values in order to predict the oral fraction absorbed for AGK2 and TSA with the aim of evaluating their potential to be administered by oral route. Oral fraction absorbed was calculated using Equation 2009 for both compounds using the passive absorption component. The predicted oral fraction absorbed was high at 100 μM for AGK2 and TSA, and intermediate at the lowest concentration assayed (1 μM) for AGK2. Results are summarized in Table 3 and Figure 10.
Table 3.
Predicted values of oral fraction absorbed
| Compound | Peff (cm·s−1) | Fa* | ||
|---|---|---|---|---|
| High Fa | Metoprolol | 5.90E-05 | 0.93 | Amidon et al., 1995 |
| Intermediate Fa | Furosemide | 1.90E-05 | 0.71 | Amidon et al., 1995 |
| Low Fa | Nadolol | 4.30E-06 | 0.25 | Amidon et al., 1995 |
| High Fa | AGK2 100 μM | 6.06E-05 | 0.93 | |
| Intermediate Fa | AGK2 1 μM | 2.10E-05 | 0.74 | |
| High Fa | TSA | 8.10E-05 | ∼1 |
Oral fraction absorbed predicted based on the permeability values by interpolation on a previously validated Peff-Fa correlation.
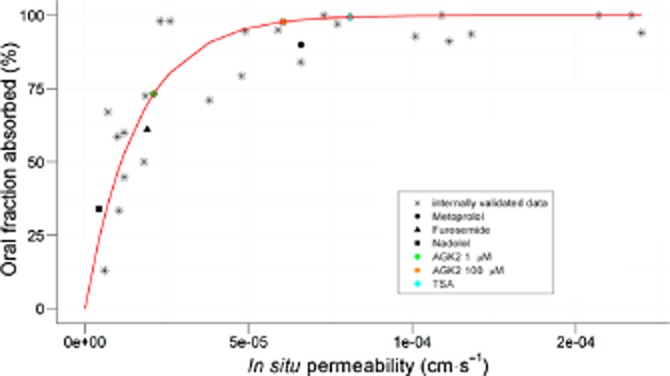
Oral fraction absorbed versus permeability values obtained in in situ experiments. Data correspond to the internally validated correlation between in situ permeability and oral fraction absorbed. These experiments used metoprolol, furosemide and nadolol to compare with AGK2 (1 μM and 100 μM) and TSA. See also Table 3.
Discussion and conclusion
In this paper, the crucial role of the tubulin deacetylase inhibitors such as TSA, AGK2 and TPPP/p25 has been established in the acetylation of the tubulin/microtubule network that leads to altered functions of the microtubule network at cell level. The mechanism responsible for the structural and functional effects is the involvement of TPPP/p25 in a multi-protein complex which is likely to associate with the microtubule network. Our data and those from other laboratories have demonstrated the crucial role of the acetylation level of the microtubule network in physiological processes, for example, in microtubule growing, cell differentiation, motility and cell cycle (Tőkési et al., 2010; Janke and Bulinski, 2011; De Forges et al., 2012; Konno et al., 2012). A non-optimal level of TPPP/p25 results in the aetiology of distinct human diseases such as cancer or neurological disorders (Kovács et al., 2004; Preusser et al., 2007). Consequently, the HDAC inhibitors including tubulin deacetylase inhibitors are potential drug targets. Extensive efforts are in progress over the world to synthesize and develop inhibitors which can selectively influence specific acetylation processes (COST Action TD0905: bench to bedside). The cell model developed in this work could assist to test the efficacy and specificity of new inhibitors of deacetylases as potential drugs at molecular and cell levels.
Our in situ data revealed a concentration-dependent permeability for AGK2, but not for TSA. Population pharmacokinetic analysis demonstrated a passive diffusion and active efflux mechanism in the absorption of AGK2. In light of this finding, one could propose that the higher deacetylase inhibitory potency of TSA, compared with that of AGK2, observed at cell level is related to its higher permeability feature. In addition, TSA is likely not to be a substrate of any secretion transporter, at least at the concentrations assayed. Therefore, TSA and AGK2 appear to be potential candidates for oral drug absorption because they display high oral fraction absorbed, independently of the absorption mechanism. This issue is of special importance because HDACs play a key role in homeostasis of protein acetylation of histones and other proteins and in regulation of their fundamental cellular activities; imbalances in protein acetylation levels are associated with a wide range of diseases (Chuang et al., 2009). HDAC inhibitors were primarily developed as anti-tumor agents for cancer, but many are now being explored for treatment of neurodegenerative, immunologic, metabolic, inflammatory and cardiovascular disorders. Treatment with various HDAC inhibitors can correct these deficiencies; nevertheless, much remains to be elucidated about the functional implications of modulating HDACs. Our studies at molecular and cellular levels could contribute to the evaluation of promising new strategy for therapeutic intervention in neurodegenerative disease such as Parkinson's disease where inhibition of SIRT2 was found to rescue the α-synuclein-mediated toxicity by protecting against dopaminergic cell death (Outeiro et al., 2007).
Acknowledgments
This work was supported by the European Commission [(DCI ALA/19.09.01/10/21526/245-297/ALFA 111(2010)29], the European Concerted Research Action (COST Action TD0905), and the Hungarian National Scientific Research Fund Grants OTKA (T-101039) and Richter Gedeon Nyrt (4700147899) to J. Ovádi.
Glossary
- FCS
fetal calf serum
- HDAC6
histone deacetylase 6
- MAP
microtubule associated protein
- SIRT2
silent information regulator 2
- TPPP/p25
tubulin polymerization promoting protein
- TSA
trichostatin A
Author contributions
J. Ovádi and M. B. participated in research design. V. M-S., J. Oláh, I. G-A., A. L. and N. T. conducted the experiments. V. M-S. and A. L. contributed new reagents or analytic tools. J. Oláh and I. G-A. performed the data analysis. J. Ovádi and M. B. wrote or contributed to the writing of the manuscript.
Conflict of interest
None.
Supporting Information
Additional Supporting Information may be found in the online version of this article at the publisher's web-site:
Figure S1 Goodness of fit plots of AGK2 based on the best model.
Figure S2 Goodness of fit plots of TSA based on the best model.
References
- SPH Alexander, Benson HE, Faccenda E, Pawson AJ, Sharman JL, Spedding M, et al. The Concise Guide to PHARMACOLOGY 2013/14: Enzymes. Br J Pharmacol. 2013;170:1797–1867. doi: 10.1111/bph.12451. [DOI] [PMC free article] [PubMed] [Google Scholar]
- Amidon GL, Lennernäs H, Shah VP, Crison JR. A theoretical basis for a biopharmaceutic drug classification: the correlation of in vitro drug product dissolution and in vivo bioavailability. Pharm Res. 1995;12:413–420. doi: 10.1023/a:1016212804288. [DOI] [PubMed] [Google Scholar]
- Bauer NG, Richter-Landsberg C, Ffrench-Constant C. Role of the oligodendroglial cytoskeleton in differentiation and myelination. Glia. 2009;57:1691–1705. doi: 10.1002/glia.20885. [DOI] [PubMed] [Google Scholar]
- Beal SL, Sheiner LB, Boeckmann AJ, Bauer RJ. 1989. Ellicott City, MD Icon Development Solutions NONMEM Users Guides.
- Chuang DM, Leng Y, Marinova Z, Kim HJ, Chiu CT. Multiple roles of HDAC inhibition in neurodegenerative conditions. Trends Neurosci. 2009;32:591–601. doi: 10.1016/j.tins.2009.06.002. [DOI] [PMC free article] [PubMed] [Google Scholar]
- Conde C, Cáceres A. Microtubule assembly, organization and dynamics in axons and dendrites. Nat Rev Neurosci. 2009;10:319–332. doi: 10.1038/nrn2631. [DOI] [PubMed] [Google Scholar]
- Creppe C, Malinouskaya L, Volvert ML, Gillard M, Close P, Malaise O, et al. Elongator controls the migration and differentiation of cortical neurons through acetylation of alpha-tubulin. Cell. 2009;136:551–564. doi: 10.1016/j.cell.2008.11.043. [DOI] [PubMed] [Google Scholar]
- De Forges H, Bouissou A, Perez F. Interplay between microtubule dynamics and intracellular organization. Int J Biochem Cell Biol. 2012;44:266–274. doi: 10.1016/j.biocel.2011.11.009. [DOI] [PubMed] [Google Scholar]
- Doluisio JT, Billups NF, Dittert LW, Sugita ET, Swintosky JV. Drug absorption. I. An in situ rat gut technique yielding realistic absorption rates. J Pharm Sci. 1969;58:1196–1200. doi: 10.1002/jps.2600581006. [DOI] [PubMed] [Google Scholar]
- Furumai R, Komatsu Y, Nishino N, Khochbin S, Yoshida M, Horinouchi S. Potent histone deacetylase inhibitors built from trichostatin A and cyclic tetrapeptide antibiotics including trapoxin. Proc Natl Acad Sci U S A. 2001;98:87–92. doi: 10.1073/pnas.011405598. [DOI] [PMC free article] [PubMed] [Google Scholar]
- Hlavanda E, Kovács J, Oláh J, Orosz F, Medzihradszky KF, Ovádi J. Brain-specific p25 protein binds to tubulin and microtubules and induces aberrant microtubule assemblies at substoichiometric concentrations. Biochemistry. 2002;41:8657–8664. doi: 10.1021/bi020140g. [DOI] [PubMed] [Google Scholar]
- Höftberger R, Fink S, Aboul-Enein F, Botond G, Oláh J, Berki T, et al. Tubulin polymerization promoting protein (TPPP/p25) as a marker for oligodendroglial changes in multiple sclerosis. Glia. 2010;58:1847–1857. doi: 10.1002/glia.21054. [DOI] [PubMed] [Google Scholar]
- Hubbert C, Guardiola A, Shao R, Kawaguchi Y, Ito A, Nixon A, et al. HDAC6 is a microtubule-associated deacetylase. Nature. 2002;417:455–458. doi: 10.1038/417455a. [DOI] [PubMed] [Google Scholar]
- Janke C, Bulinski JC. Post-translational regulation of the microtubule cytoskeleton: mechanisms and functions. Nat Rev Mol Cell Biol. 2011;12:773–786. doi: 10.1038/nrm3227. [DOI] [PubMed] [Google Scholar]
- Kilkenny C, Browne W, Cuthill IC, Emerson M, Altman DG. Animal research: Reporting in vivo experiments: the ARRIVE guidelines. Br J Pharmacol. 2010;160:1577–1579. doi: 10.1111/j.1476-5381.2010.00872.x. [DOI] [PMC free article] [PubMed] [Google Scholar]
- Konno A, Setou M, Ikegami K. Ciliary and flagellar structure and function – their regulations by posttranslational modifications of axonemal tubulin. Int Rev Cell Mol Biol. 2012;294:133–170. doi: 10.1016/B978-0-12-394305-7.00003-3. [DOI] [PubMed] [Google Scholar]
- Kopito RR. Aggresomes, inclusion bodies and protein aggregation. Trends Cell Biol. 2000;10:524–530. doi: 10.1016/s0962-8924(00)01852-3. [DOI] [PubMed] [Google Scholar]
- Kovács GG, László L, Kovács J, Jensen PH, Lindersson E, Botond G, et al. Natively unfolded tubulin polymerization promoting protein TPPP/p25 is a common marker of alpha-synucleinopathies. Neurobiol Dis. 2004;17:155–162. doi: 10.1016/j.nbd.2004.06.006. [DOI] [PubMed] [Google Scholar]
- Lehotzky A, Tirián L, Tőkési N, Lénárt P, Szabó B, Kovács J, et al. Dynamic targeting of microtubules by TPPP/p25 affects cell survival. J Cell Sci. 2004;117(Pt 25):6249–6259. doi: 10.1242/jcs.01550. [DOI] [PubMed] [Google Scholar]
- Lehotzky A, Lau P, Tőkési N, Muja N, Hudson LD, Ovádi J. Tubulin polymerization-promoting protein (TPPP/p25) is critical for oligodendrocyte differentiation. Glia. 2010;58:157–168. doi: 10.1002/glia.20909. [DOI] [PMC free article] [PubMed] [Google Scholar]
- Li W, Zhang B, Tang J, Cao Q, Wu Y, Wu C, et al. Sirtuin 2, a mammalian homolog of yeast silent information regulator-2 longevity regulator, is an oligodendroglial protein that decelerates cell differentiation through deacetylating alpha-tubulin. J Neurosci. 2007;27:2606–2616. doi: 10.1523/JNEUROSCI.4181-06.2007. [DOI] [PMC free article] [PubMed] [Google Scholar]
- Lindbom L, Pihlgren P, Jonsson EN. PsN-Toolkit – a collection of computer intensive statistical methods for non-linear mixed effect modeling using NONMEM. Comput Methods Programs Biomed. 2005;79:241–257. doi: 10.1016/j.cmpb.2005.04.005. [DOI] [PubMed] [Google Scholar]
- Louis JC, Magal E, Muir D, Manthorpe M, Varon S. CG-4, a new bipotential glial cell line from rat brain, is capable of differentiating in vitro into either mature oligodendrocytes or type-2 astrocytes. J Neurosci Res. 1992;31:193–204. doi: 10.1002/jnr.490310125. [DOI] [PubMed] [Google Scholar]
- McGrath J, Drummond G, McLachlan E, Kilkenny C, Wainwright C. Guidelines for reporting experiments involving animals: the ARRIVE guidelines. Br J Pharmacol. 2010;160:1573–1576. doi: 10.1111/j.1476-5381.2010.00873.x. : . [DOI] [PMC free article] [PubMed] [Google Scholar]
- Nahhas F, Dryden SC, Abrams J, Tainsky MA. Mutations in SIRT2 deacetylase which regulate enzymatic activity but not its interaction with HDAC6 and tubulin. Mol Cell Biochem. 2007;303:221–230. doi: 10.1007/s11010-007-9478-6. [DOI] [PubMed] [Google Scholar]
- North BJ, Marshall BL, Borra MT, Denu JM, Verdin E. The human Sir2 ortholog, SIRT2, is an NAD+-dependent tubulin deacetylase. Mol Cell. 2003;11:437–444. doi: 10.1016/s1097-2765(03)00038-8. [DOI] [PubMed] [Google Scholar]
- Ohkawa N, Sugisaki S, Tokunaga E, Fujitani K, Hayasaka T, Setou M, et al. N-acetyltransferase ARD1-NAT1 regulates neuronal dendritic development. Genes Cells. 2008;13:1171–1183. doi: 10.1111/j.1365-2443.2008.01235.x. [DOI] [PubMed] [Google Scholar]
- Oláh J, Vincze O, Virók D, Simon D, Bozsó Z, Tőkési N, et al. Interactions of pathological hallmark proteins: tubulin polymerization promoting protein/p25, beta-amyloid, and alpha-synuclein. J Biol Chem. 2011;286:34088–34100. doi: 10.1074/jbc.M111.243907. [DOI] [PMC free article] [PubMed] [Google Scholar]
- Outeiro TF, Kontopoulos E, Altmann SM, Kufareva I, Strathearn KE, Amore AM, et al. Sirtuin 2 inhibitors rescue alpha-synuclein-mediated toxicity in models of Parkinson's disease. Science. 2007;317:516–519. doi: 10.1126/science.1143780. [DOI] [PubMed] [Google Scholar]
- Parmigiani RB, Xu WS, Venta-Perez G, Erdjument-Bromage H, Yaneva M, Tempst P, et al. HDAC6 is a specific deacetylase of peroxiredoxins and is involved in redox regulation. Proc Natl Acad Sci U S A. 2008;105:9633–9638. doi: 10.1073/pnas.0803749105. [DOI] [PMC free article] [PubMed] [Google Scholar]
- Pawson AJ, Sharman JL, Benson HE, Faccenda E, Alexander SP, Buneman OP, et al. NC-IUPHAR. The IUPHAR/BPS Guide to PHARMACOLOGY: an expert-driven knowledge base of drug targets and their ligands. Nucl. Acids Res. 2014;42(Database Issue):D1098–1106. doi: 10.1093/nar/gkt1143. [DOI] [PMC free article] [PubMed] [Google Scholar]
- Preusser M, Lehotzky A, Budka H, Ovádi J, Kovács GG. TPPP/p25 in brain tumours: expression in non-neoplastic oligodendrocytes but not in oligodendroglioma cells. Acta Neuropathol. 2007;113:213–215. doi: 10.1007/s00401-006-0173-6. [DOI] [PubMed] [Google Scholar]
- Reed NA, Cai D, Blasius TL, Jih GT, Meyhofer E, Gaertig J, et al. Microtubule acetylation promotes kinesin-1 binding and transport. Curr Biol. 2006;16:2166–2172. doi: 10.1016/j.cub.2006.09.014. [DOI] [PubMed] [Google Scholar]
- Rodriguez-Berna G, Diaz MJ, Mangas-Sanjuan V, Gonzalez-Alvarez M, Gonzalez-Alvarez I, Abasolo I, et al. Semisynthesis, cytotoxic activity, and oral availability of new lipophilic 9 substituted camptothecin derivatives. ACS Med Chem Lett. 2013;4:651–655. doi: 10.1021/ml400125z. [DOI] [PMC free article] [PubMed] [Google Scholar]
- Samiei N, Mangas-Sanjuan V, Gonzalez-Alvarez I, Foroutan M, Shafaati A, Zarghi A, et al. Ion-pair strategy for enabling amifostine oral absorption: rat in situ and in vivo experiments. Eur J Pharm Sci. 2013;49:499–504. doi: 10.1016/j.ejps.2013.04.025. [DOI] [PubMed] [Google Scholar]
- Takahashi M, Tomizawa K, Fujita SC, Sato K, Uchida T, Imahori K. A brain-specific protein p25 is localized and associated with oligodendrocytes, neuropil, and fiber-like structures of the CA3 hippocampal region in the rat brain. J Neurochem. 1993;60:228–235. doi: 10.1111/j.1471-4159.1993.tb05842.x. [DOI] [PubMed] [Google Scholar]
- Tang BL, Chua CE. SIRT2, tubulin deacetylation, and oligodendroglia differentiation. Cell Motil Cytoskeleton. 2008;65:179–182. doi: 10.1002/cm.20253. [DOI] [PubMed] [Google Scholar]
- Tőkési N, Lehotzky A, Horváth I, Szabó B, Oláh J, Lau P, et al. TPPP/p25 promotes tubulin acetylation by inhibiting histone deacetylase 6. J Biol Chem. 2010;285:17896–17906. doi: 10.1074/jbc.M109.096578. [DOI] [PMC free article] [PubMed] [Google Scholar]
- Tran AD, Marmo TP, Salam AA, Che S, Finkelstein E, Kabarriti R, et al. HDAC6 deacetylation of tubulin modulates dynamics of cellular adhesions. J Cell Sci. 2007;120(Pt 8):1469–1479. doi: 10.1242/jcs.03431. [DOI] [PubMed] [Google Scholar]
- Wang SZ, Dulin J, Wu H, Hurlock E, Lee SE, Jansson K, et al. An oligodendrocyte-specific zinc-finger transcription regulator cooperates with Olig2 to promote oligodendrocyte differentiation. Development. 2006;133:3389–3398. doi: 10.1242/dev.02522. [DOI] [PubMed] [Google Scholar]
- Yang WM, Yao YL, Sun JM, Davie JR, Seto E. Isolation and characterization of cDNAs corresponding to an additional member of the human histone deacetylase gene family. J Biol Chem. 1997;272:28001–28007. doi: 10.1074/jbc.272.44.28001. [DOI] [PubMed] [Google Scholar]
Associated Data
This section collects any data citations, data availability statements, or supplementary materials included in this article.
Supplementary Materials
Figure S1 Goodness of fit plots of AGK2 based on the best model.
Figure S2 Goodness of fit plots of TSA based on the best model.