Abstract
Production of branched α-glucan, glycogen-like polymers is widely spread in the Bacteria domain. The glycogen pathway of synthesis and degradation has been fairly well characterized in the model enterobacterial species Escherichia coli (order Enterobacteriales, class Gammaproteobacteria), in which the cognate genes (branching enzyme glgB, debranching enzyme glgX, ADP-glucose pyrophosphorylase glgC, glycogen synthase glgA, and glycogen phosphorylase glgP) are clustered in a glgBXCAP operon arrangement. However, the evolutionary origin of this particular arrangement and of its constituent genes is unknown. Here, by using 265 complete gammaproteobacterial genomes we have carried out a comparative analysis of the presence, copy number and arrangement of glg genes in all lineages of the Gammaproteobacteria. These analyses revealed large variations in glg gene presence, copy number and arrangements among different gammaproteobacterial lineages. However, the glgBXCAP arrangement was remarkably conserved in all glg-possessing species of the orders Enterobacteriales and Pasteurellales (the E/P group). Subsequent phylogenetic analyses of glg genes present in the Gammaproteobacteria and in other main bacterial groups indicated that glg genes have undergone a complex evolutionary history in which horizontal gene transfer may have played an important role. These analyses also revealed that the E/P glgBXCAP genes (a) share a common evolutionary origin, (b) were vertically transmitted within the E/P group, and (c) are closely related to glg genes of some phylogenetically distant betaproteobacterial species. The overall data allowed tracing the origin of the E. coli glgBXCAP operon to the last common ancestor of the E/P group, and also to uncover a likely glgBXCAP transfer event from the E/P group to particular lineages of the Betaproteobacteria.
Introduction
Production of large intracellular α-glucans composed of α-1,4-linked glucose units displaying low extents of α-1,6-linked branches (“bacterial glycogen”) represents a common feature observed in many groups of bacteria [1–9]. Glycogen constitutes a major carbon and energy reserve polymer that accumulates to cope with the starvation conditions often occurring in natural environments. The exact role of this polysaccharide in bacteria is not as clear-cut as in eukaryotes [7], but several studies have indicated that glycogen metabolism may confer some adaptive advantages including increased environmental survival and colonization and, in the case of pathogens, increased virulence and immune system evasion [1, 2, 8, 10–15].
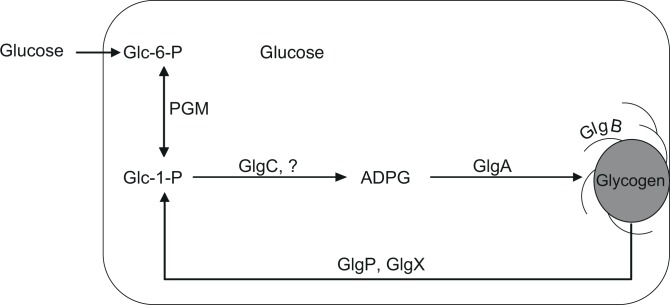
Studies conducted for more than 40 years in model bacterial species such as Escherichia coli and Salmonella enterica (family Enterobacteriaceae, order Enterobacteriales, class Gammaproteobacteria) were pivotal to elucidate the glycogen metabolic pathway schematically illustrated in Fig. 1 [6,7]. According to this model, carbon sources are taken up by the bacterial cell and eventually transformed into glucose-6-phosphate (Glc-6-P), which is then converted into glucose-1-phosphate (Glc-1-P) by phosphoglucomutase (PGM). In the presence of Mg2+ and ATP, this hexose-P is converted into ADP-glucose (ADPG) and inorganic pyrophosphate by means of ADPG pyrophosphorylase (GlgC), the main regulatory step of glycogen synthesis [16]. ADPG is used by glycogen synthase (GlgA) to incorporate a new α-1,4-linked unit into the growing linear α-glucan. After chain elongation by GlgA, the glycogen branching enzyme (GlgB) catalyzes the formation of branched α-1,6-glycosidic linkages by transferring non-reducing-end oliglucans to the C-6-position of residues within a chain. On the catabolic side, the glycogen phosphorylase (GlgP) and glycogen debranching enzyme (GlgX) are the major determinants of glycogen degradation catalyzing the phosphorolytic cleavage of α-1,4 bonds to generate Glc-1-P at the non-reducing ends and the hydrolysis of α-1,6-glycosidic linkages on limit dextrins (the polysaccharide fragments remaining at the end of exhaustive hydrolysis of glycogen by GlgP), respectively [17,18]. This model is considered to represent the prevalent pathway of glycogen synthesis and degradation in bacteria [6,7]. Still, alternative glycogen synthesis pathways have been identified in some bacterial groups such as the high-G+C Gram-positive actinomycetes [12]. Also, yet unidentified sources of ADPG linked to glycogen biosynthesis have been described in both enterobacterial and cyanobacterial species [14,19,20].
Figure 1. Schematic model of glycogen metabolism.
Sugar (glucose) is incorporated into the cell and successively transformed to glucose-6-P (Glc-6-P), glucose-1-P (Glc-1-P), ADP-glucose (ADPG) and glycogen. This model involves the coupled reactions of phosphoglucomutase (PGM), ADPG pyrophosphorylase (GlgC) and other (?) ADPG-generating enzyme(s) [19,20], glycogen synthase (GlgA) and glycogen branching enzyme (GlgB). Glycogen catabolism is controlled by both glycogen phosphorylase (GlgP) and glycogen debranching enzyme (GlgX).
Bacterial genes encoding functionally related proteins are generally clustered in operons [21–23]. This is the case of the five E. coli glg genes coding for the enzymes of the glycogen pathway, which are present in a single copy each and clustered in a single glgBXCAP operon arrangement [24]. However, the evolutionary history of this arrangement and its constituent genes remains unknown. To gain insight into the origin and evolutionary history of E. coli and S. enterica glg genes, we have carried out a detailed comparative analysis of the presence, copy number and arrangement of glg genes present in the different gammaproteobacterial lineages. Our analyses reveal the occurrence of large variations in glg homologs copy number and arrangements within the Gammaproteobacteria, glgBXCAP arrangement being highly conserved in all glg possessing species of the sister orders Enterobacteriales and Pasteurellales (the E/P group). Moreover, the phylogenetic analyses conducted in this work indicated that all glg genes in the E/P group share a common evolutionary origin. Finally, an extended analysis including glg genes of the main bacterial groups outside the Gammaproteobacteria indicates that E/P Glg proteins are more closely related to its counterparts of the phylogenetically distant betaproteobacterial species Variovorax paradoxus S110, Thauera sp. mz1t, Leptothrix cholodnii SP-6 and Thiomonas intermedia K12 than to Glg proteins of other Gammaproteobacteria. Furthermore, the genomic organization of glg genes in these betaproteobacterial species is very similar to that present in the E/P group.
Results
Identification and distribution of glg genes in the Gammaproteobacteria
We first searched for homologs of the five glg genes composing the E. coli glgBXCAP operon in entire genomes of the Gammaproteobacteria available in GenBank. The searches were conducted with the TBLASTN and PSI-BLAST programs on 265 complete gammaproteobacterial genomes representing 63 different genera and 13 orders using the GlgB, GlgX, GlgC, GlgA and GlgP protein sequences of the E. coli K-12 strain MG1655 (S1 Table) as query sequences. Acidithiobacillales were not included in this analysis since this proteobacterial order was recently classified as not belonging to the Gammaproteobacteria [25]. The number of sequenced genomes from the Enterobacteriales is over-represented in the databases as shown by the 115 out of the 265 genomes analyzed which belonged to species of this order (S1 Table).
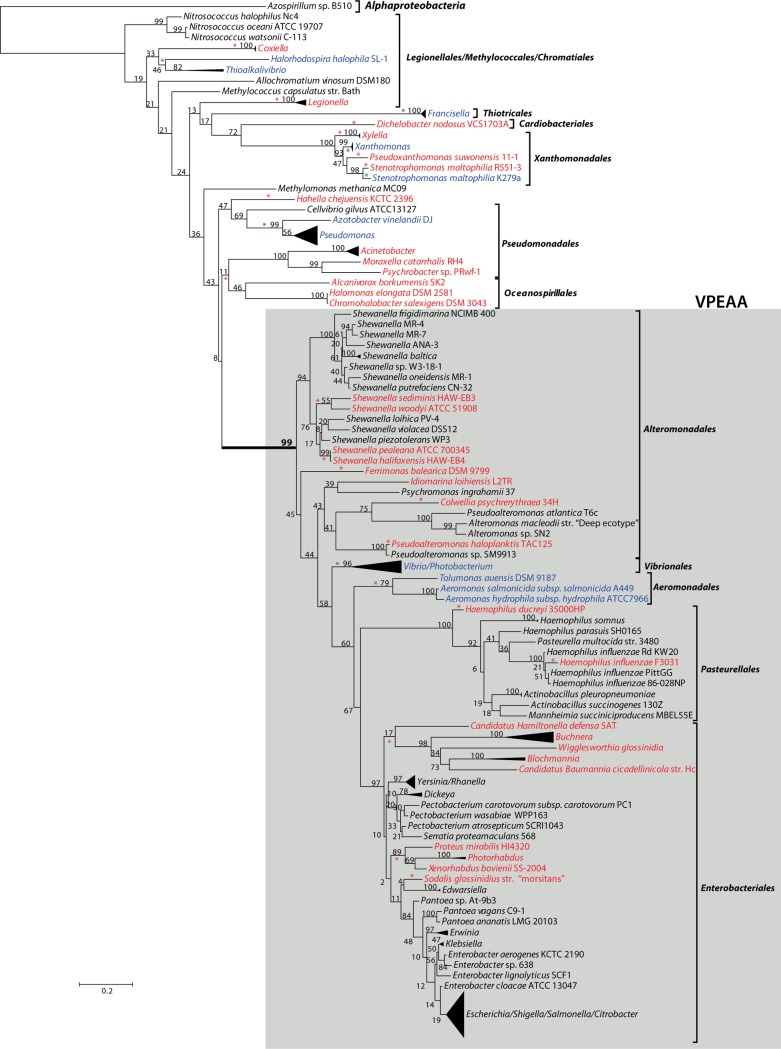
Our analysis revealed a varied and complex distribution of glg genes in the Gammaproteobacteria (S1 Table). In general, the gammaproteobacterial species analyzed can be grouped into the following four categories: (i) organisms completely lacking glg homologs, (ii) organisms harbouring partial sets of glg homologs, (iii) organisms harbouring more than one copy of a particular glg homolog, and (iv) organisms harbouring all five glg homologs. This classification is not intended to be mutually exclusive since some species can be simultaneously included into categories (ii) and (iii), or (ii) and (iv) (S1 Table). Taking into account that most analyzed species are included in category (iv), in the following lines we will focus on categories (i), (ii) and (iii), and the results will be referenced to a phylogenetic tree based on 16S rRNA sequences (Fig. 2; S1 Fig.).
Figure 2. Summarized maximum-likelihood phylogenetic tree for 16S rRNA of the analyzed gammaproteobacterial species.
Gammaproteobacterial orders are denoted by brackets. The tree was rooted with the alphaproteobacterial species Azospirillum sp. B510. Species with partial sets or total lack of glg genes are highlighted with blue and red colors, respectively. Support values for the bootstrap analysis by maximum likelihood are given. Red and blue asterisks highlight independent evolutionary events that result in total or partial glg losses, respectively. The complete tree is shown in S1 Fig.
Gammaproteobacterial species lacking all five glg genes
Individual species or even complete groups in which no glg homologues could be identified (highlighted in red color in Fig. 2) are interspersed among the different gammaproteobacterial lineages. Among the most recently emerged lineages such as the Enterobacteriales [25,26], organisms lacking all glg genes include endosymbionts of insects or nematodes [27] of the genera Buchnera, Blochmannia, Sodalis, Wigglesworthia and Photorhabdus, as well as Proteus mirabilis HI4320, an inhabitant of the intestinal tract of humans and common cause of urinary infections [26] (Fig. 2).
In the order Pasteurelalles, sister clade of the Enterobacteriales [25,26], two phylogenetically distant species of Haemophilus (i. e., H. influenzae F3031 and H. ducreyi) completely lack glg genes, which contrasts with phylogenetically close relatives such as H. influenzae PittGG (Fig. 2).
Within the order Alteromonodales some species totally lack glg genes, such as the marine psychrophiles Pseudoalteromonas haloplanktis TAC125, Idiomarina loihiensis L2TR, and some species of the genus Shewanella including S. woody ATCC51908, S. sedimis HAW-E4, S. pealeana ANG-SQ1, S. halifaxensis HAW-E4, and S. denitrificans OS217 (S1 Table; Fig. 2). On the contrary, glg genes are present in other species of this order such as the marine Alteromonas isolates and the psychrophiles Pseudoalteromonas atlantica T6c and Pseudoalteromonas sp. SM9913 (S1 Table; Fig. 2).
Among the Pseudomonadales, organisms lacking glg genes include all the analyzed species of the genus Acinetobacter (encompassing both opportunistic human pathogens and harmless soil bacteria), the human pathogen Moraxella catarrhalis RH4, and Psychrobacter sp. PRwf-1 which inhabits extremely cold habitats (S1 Table; Fig. 2).
Finally, concerning the deepest diverging gammaproteobacterial branches, glg genes are totally absent in all analyzed species of the genera Coxiella (obligate intracellular pathogens) and Legionella (facultative intracellular pathogens), both assigned to the order Legionellales, and in Dichelobacter nodosus VCS1703A (aerotolerant anaerobic bacteria causing ovine foot rot) of the order Cardiobacteriales (S1 Table; Fig. 2). The same occurs in the genus Xylella (plant pathogens) and in Stenotrophomonas maltophilia R551-3 (human pathogen) both assigned to the order Xanthomonadales. Also Alcanivorax borkumensis SK2, Hahella chejuensis KCTC2396 and Chromohalobacter salexigens DSM3043 (order Oceanospirillales) inhabiting marine environments completely lack glg genes (S1 Table; Fig. 2).
Gammaproteobacterial species containing partial sets of glg genes
With the exception of glgA and glgB, differential absences of homologs of all other glg genes were observed in many independent lineages of the Gammaproteobacteria (in blue color in Fig. 2). For instance, among the order Pseudomonadales, all species of the genus Pseudomonas (which include human and plant pathogens) as well as Azotobacter vinelandii DJ (a nitrogen-fixer soil bacterium) contain homologs of all analyzed glg genes with the exception of glgC (S1 Table; Fig. 2). This is not the only example of species or groups totally lacking glgC homologs because, among the order Xanthomonadales, all the species of the genus Xanthomonas also lack glgC and, in addition, glgP (S1 Table; Fig. 2). Among the order Vibrionales, Photobacterium profundum SS9 and all the species of the genus Vibrio (including both marine species and human pathogens) lack glgP, but contain all other glg genes (S1 Table; Fig. 2). All analyzed species of the genus Francisella (order Thiotricales) lack glgX (S1 Table; Fig. 2). Finally, partial sets of glg genes are present in species assigned to the earliest emerging gammaproteobacterial lineages of the order Chromatiales including the phototrophic purple sulfur Halorhodospira halophila SL1, the ammonia-oxidizing chemolithoautotrophs of the genus Nitrosococcus, and the obligate haloalkaliphilic sulfur-oxidizing chemolithoautotroph Thioalkalivibrio sulfidophilus HL-EbGR7 (S1 Table; Fig. 2).
Gammaproteobacterial species possessing more than one copy of a particular glg homolog
Many gammaproteobacterial species display more than one homolog of a particular glg gene, a situation noted for all five glg genes (S1 Table). More than one homologous copy for a particular glg gene is observed at almost all branching levels, from the most recently emerged to the deepest ones (Fig. 2). Most notable examples in this context are provided by Psychromonas ingrahamii 37 (order Alteromonadales) which contains three glgX homologs, four glgC homologs, and two glgA homologs, besides one copy each of glgB and glgP, and Allochromatium vinosum DSM180 (order Chromatiales) with three copies of glgA, two each of glgC, glgX and glgP, besides one glgB copy (S1 Table). In turn, all the analyzed species of the genus Xanthomonas (order Xanthomonadales) possess two homologous copies of both glgB and glgX (S1 Table). Among the latest emerging gammaproteobacterial groups, all Vibrio species (order Vibrionales) possess two glgC homologs but only one copy of each of the other glg genes, and a similar situation was found in Edwardsiella tarda EIB202 of the order Enterobacteriales (S1 Table). Finally, in the deepest gammaproteobacterial branches (for example the order Chromatiales), Nitrosococcus oceanii ATCC19707 contains two glgA homologs whereas H. halophila SL1 contains two glgC homologs (S1 Table).
Phylogenetic analysis of gammaproteobacterial Glg proteins
To determine the origin and evolutionary history of enterobacterial glg genes we conducted a phylogenetic analysis of Glg proteins in all analyzed gammaproteobacterial species. The data sets including Glg amino acid sequences were aligned using ClustalW and the alignments were subsequently refined with Gblocks. The resulting data sets consisted of 206 sequences with 537 conserved positions for the GlgB alignment, 202 sequences and 384 conserved positions for the GlgX alignment, 181 sequences and 331 conserved positions for the GlgC alignment, 201 sequences and 236 conserved positions for the GlgA alignment and 168 sequences and 631 conserved positions for the GlgP alignment.
ProtTest was used to determine the best-fit model of amino acid substitution. The LG+G+I+F model (see Materials and Methods) was identified as the best model for the five data sets. The phylogenetic information content of the data sets was then evaluated by using likelihood mapping. Briefly, this analysis allows to estimate the suitability for phylogenetic reconstruction of a data set from the proportion of unresolved quartets in a maximum likelihood analysis (for a complete description see Materials and Methods). The analysis was carried out using TreePuzzle with the WAG+G+F [28] model of substitution (the second best model selected by ProtTest since the LG model is not implemented in this program). The likelihood mapping showed that the five data sets possessed a high content of phylogenetic information, with 95%, 93%, 96%, 94% and 97% of fully resolved quartets in GlgB, GlgX, GlgC, GlgA and GlgP, respectively (S2 Fig.).
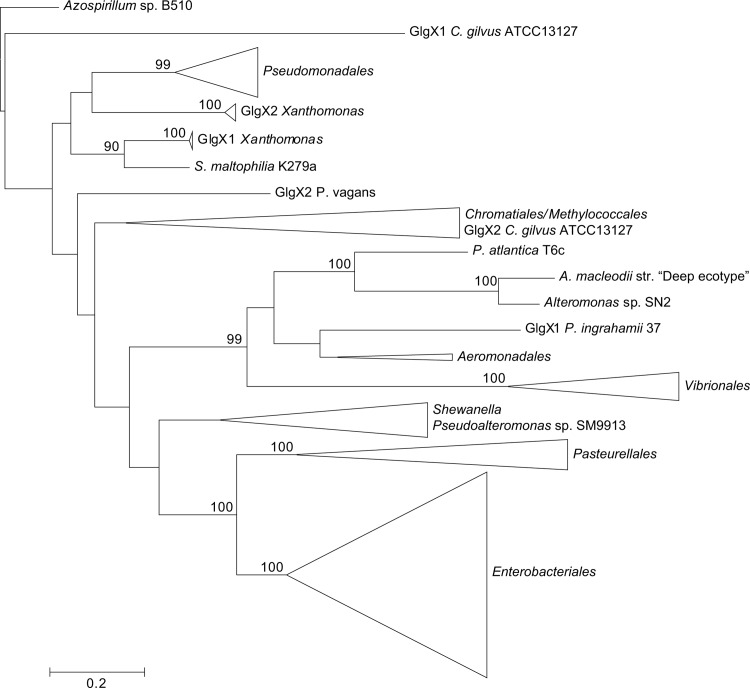
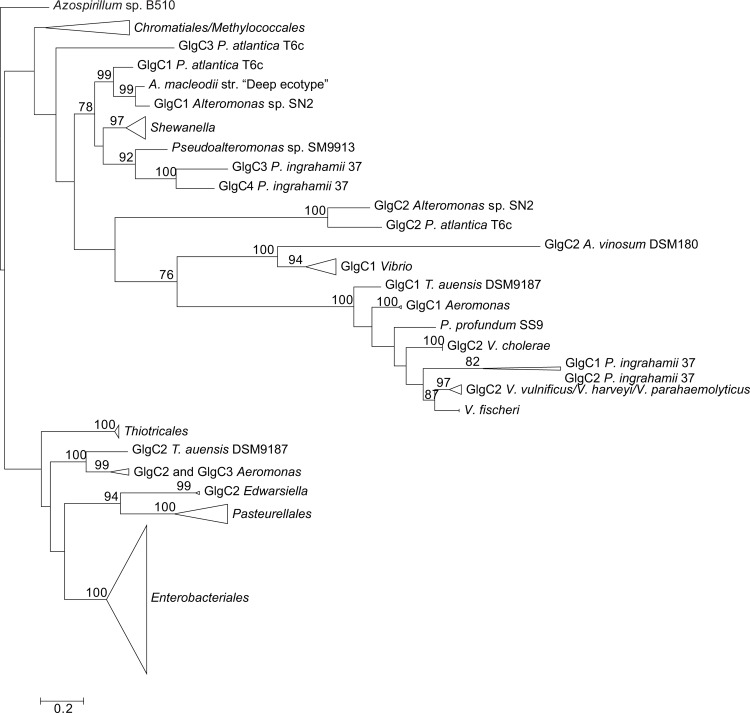
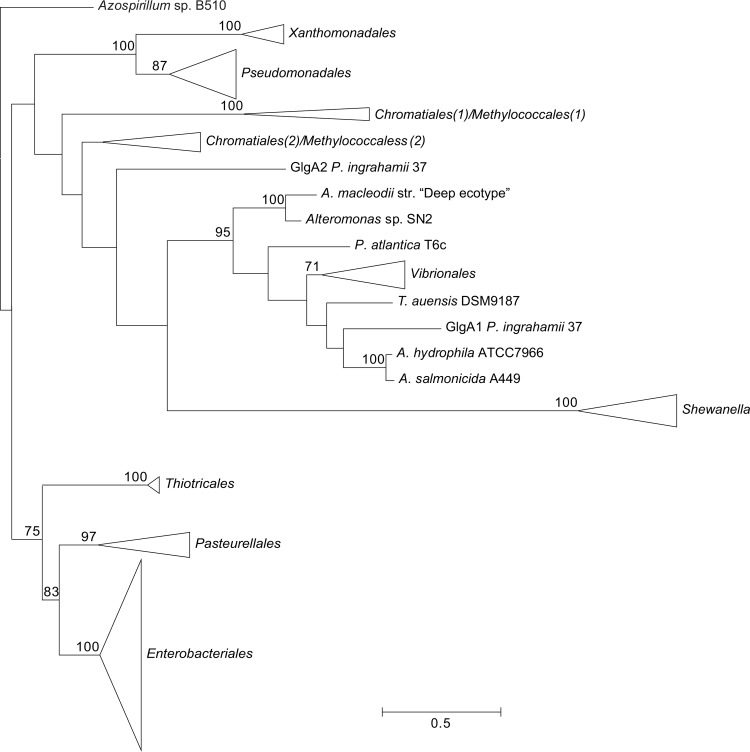
The phylogenetic reconstructions were performed with PhyML using the LG+G+I+F model (Figs. 3–7). From the inspection of the individual Glg phylogenetic trees some conclusions arose relative to the grouping pattern of the order Enterobacteriales. In agreement with the reference 16S rRNA phylogenetic tree of Fig. 2, all Enterobacteriales Glg sequences clustered with Pasteurellales sequences forming monophyletic Enterobacteriales/Pasteurellales (E/P) groups in the five Glg phylogenetic trees (Figs. 3–7; S3–S7 Figs.). To test whether the topologies of the trees of Glg sequences of the E/P group were compatible with the order of organismal descent inferred from the 16S rRNA phylogenetic analysis, the Shimodaira-Hasegawa test was used. This analysis showed that the topologies of the trees of the five Glg proteins were compatible with the topology of the 16S rRNA phylogenetic tree (p = 0.525, p = 0.462, p = 0.574, p = 0.492 and p = 0.696, for GlgB, GlgX, GlgC, GlgA and GlgP, respectively).
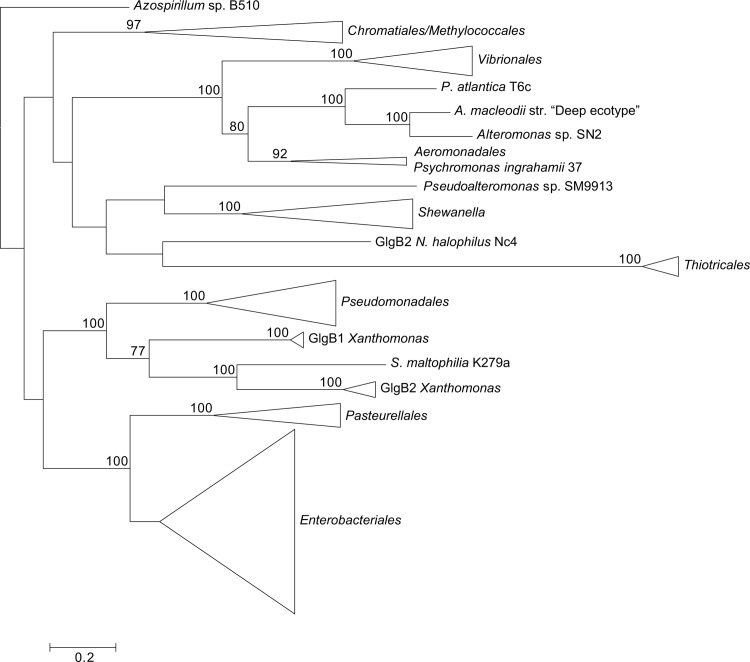
Figure 3. Summarized maximum-likelihood phylogenetic tree of the GlgB amino acid sequences containing all analyzed gammaproteobacterial species.
The tree was arbitrarily rooted with the alphaproteobacterial species Azospirillum sp. B510. The complete tree is shown in S3 Fig. Bootstrap support values (>70%) are indicated.
Figure 7. Summarized maximum-likelihood phylogenetic tree of the GlgP amino acid sequences containing all analyzed gammaproteobacterial species.
The tree was arbitrarily rooted with the alphaproteobacterial species Azospirillum sp. B510. The complete tree is shown in S7 Fig. Bootstrap support values (>70%) are indicated.
Figure 4. Summarized maximum-likelihood phylogenetic tree of the GlgX amino acid sequences containing all analyzed gammaproteobacterial species.
The tree was arbitrarily rooted with the alphaproteobacterial species Azospirillum sp. B510. The complete tree is shown in S4 Fig. Bootstrap support values (>70%) are indicated.
Figure 5. Summarized maximum-likelihood phylogenetic tree of the GlgC amino acid sequences containing all analyzed gammaproteobacterial species.
The tree was arbitrarily rooted with the alphaproteobacterial species Azospirillum sp. B510. The complete tree is shown in S5 Fig. Bootstrap support values (>70%) are indicated.
Figure 6. Summarized maximum-likelihood phylogenetic tree of the GlgA amino acid sequences containing all analyzed gammaproteobacterial species.
The tree was arbitrarily rooted with the alphaproteobacterial species Azospirillum sp. B510. The complete tree is shown in S6 Fig. Bootstrap support values (>70%) are indicated.
As shown in the 16S rRNA reference tree presented in Fig. 2, the E/P group is clustered in a highly supported group (bootstrap support (BS) = 99%) with the orders Vibrionales, Aeromononadales and Alteromonadales forming the Vibrionales/Pasteurellales/Enterobacteriales/Aeromonodales/Alteromonadales (VPEAA) clade. It is worth noting that the monophyly of this VPEAA clade within the Gammaproteobacteria has been described in two independent works analyzing the phylogeny of this class [25,29]. However, similar VPEAA clades are not observed in Glg phylogenetic trees since in all cases the E/P group fails to cluster with Vibrionales, Aeromonadales and Alteromonadales (Figs. 3–7; S3–S7 Figs.). Thus, with the exception of the E/P group, lack of congruence is observed between the evolution of glg genes and the evolution of the rest of gammaproteobacterial lineages.
Phylogenetic relationship of E/P Glg proteins with their counterparts outside the Gammaproteobacteria
We performed a phylogenetic reconstruction including both gammaproteobacterial Glg protein sequences and those of 75 species representing the main bacterial groups outside the Gammaproteobacteria (S2 Table). The Glg sequences thus obtained were aligned with ClustalW and subsequently refined with Gblocks. The resulting data sets consisted of 279 sequences with 406 conserved positions for the GlgB alignment, 257 sequences and 291 conserved positions for the GlgX alignment, 245 sequences and 226 conserved positions for the GlgC alignment, 259 sequences and 157 conserved positions for the GlgA alignment and 217 sequences and 520 conserved positions for the GlgP alignment. The best-fit model for these data sets was LG+G+I+F. The likelihood mapping (using again WAG+G+F) showed a marked decrease in phylogenetic signal compared to the gammaproteobacterial data sets (S8 Fig.). The phylogenetic reconstructions were performed as described for the gammaproteobacterial data sets (Figs. 8–12; S9–S13 Figs.). Moreover, a new 16S rRNA reference tree including both gammaproteobacterial and representative species of the main bacterial groups outside the Gammaproteobacteria was constructed (Fig. 13; S14 Fig.).
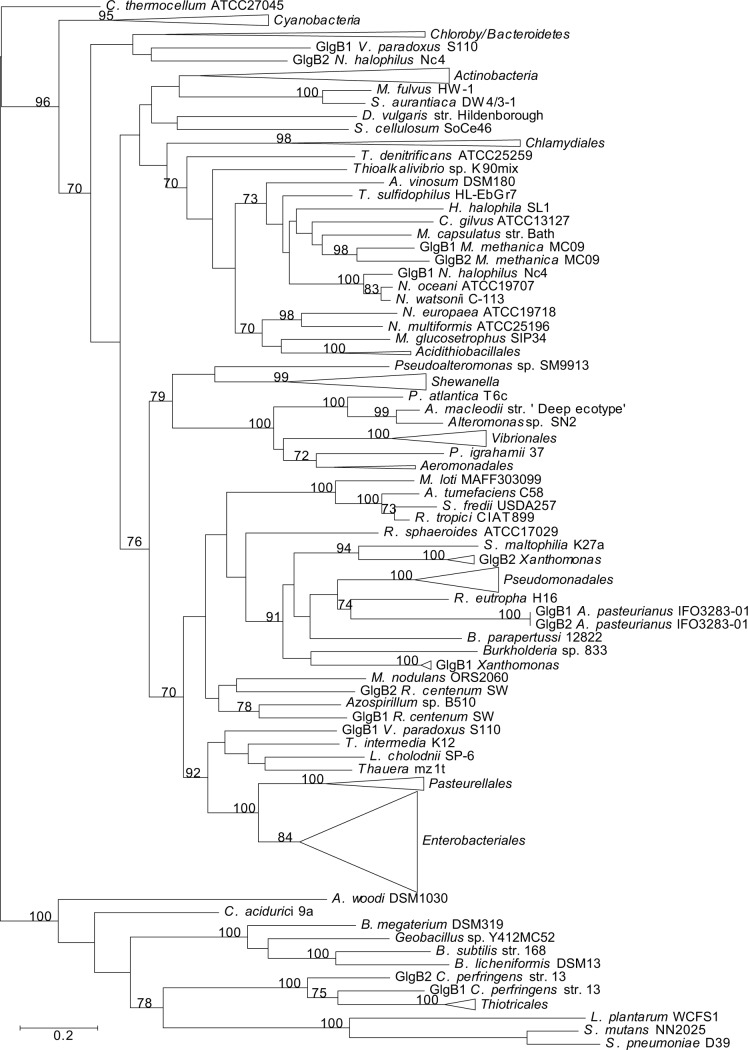
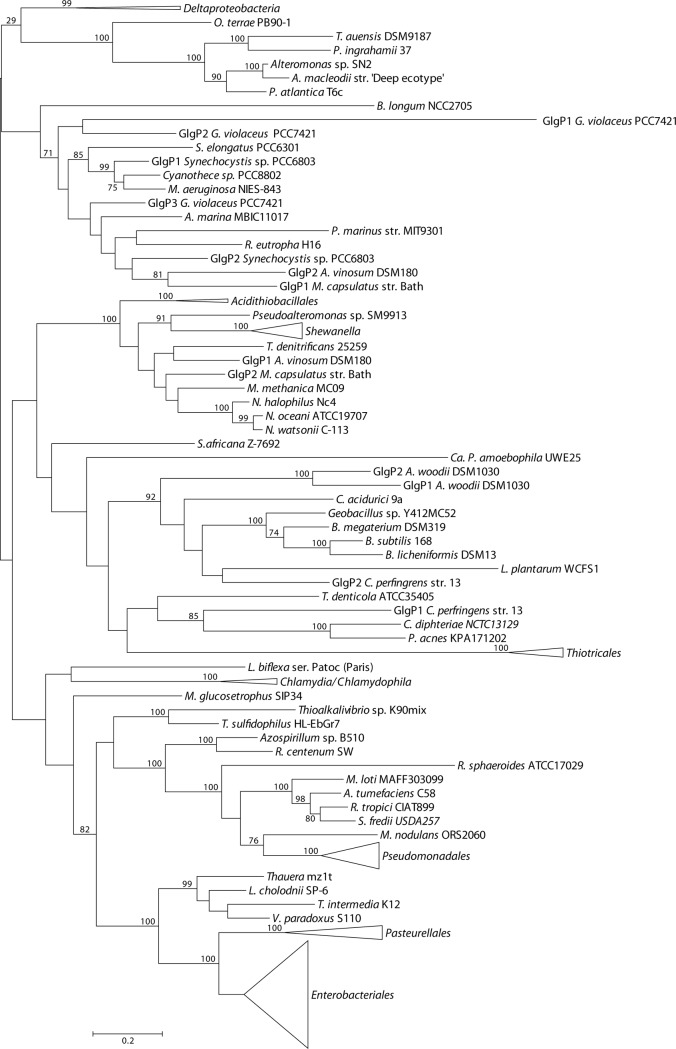
Figure 8. Summarized maximum-likelihood phylogenetic tree of the GlgB amino acid sequences of the analyzed gammaproteobacterial species and of the selected species belonging to main bacterial groups.
The tree was midpoint rooted. The complete tree is shown in S9 Fig. Bootstrap support values (>70%) are indicated.
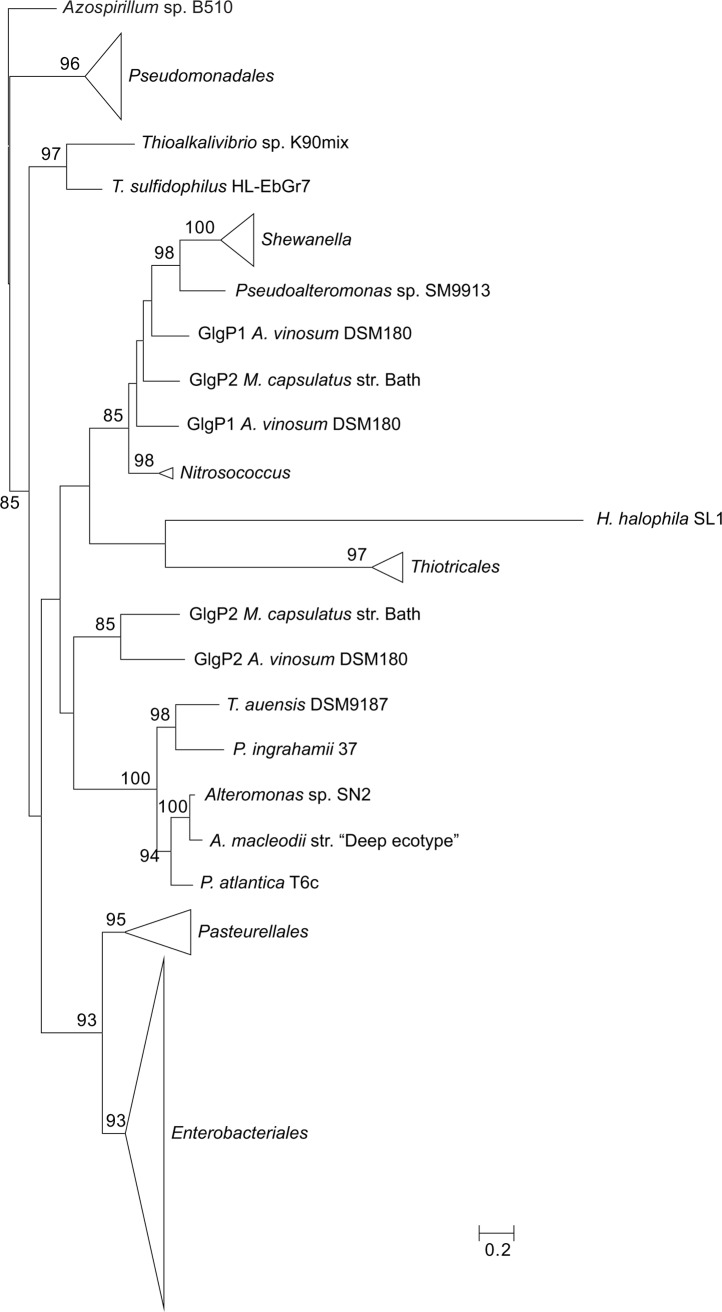
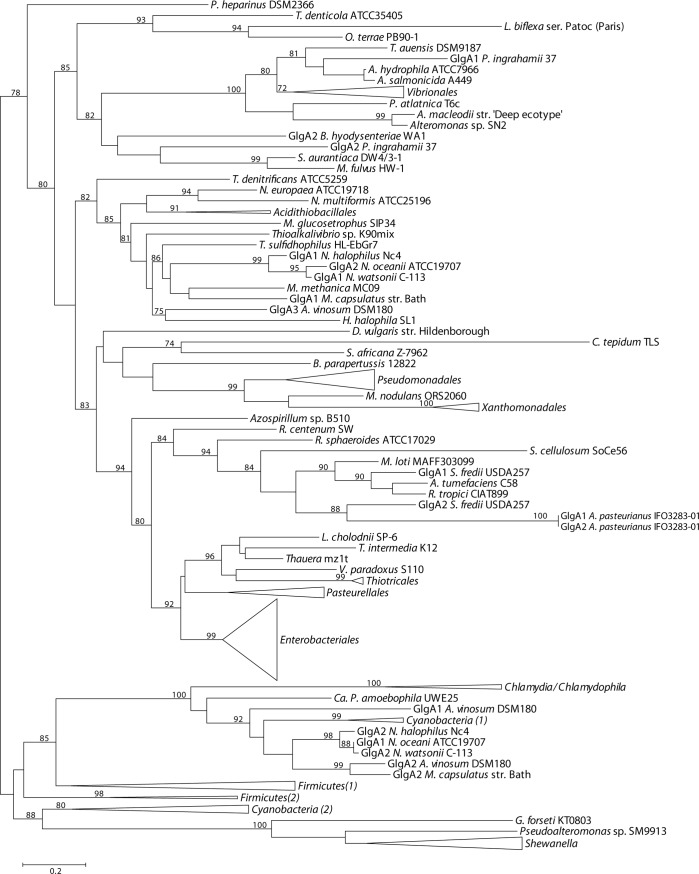
Figure 12. Summarized maximum-likelihood phylogenetic tree of the GlgP amino acid sequences of the analyzed gammaproteobacterial species and of the selected species belonging to main bacterial groups.
The tree was midpoint rooted. The complete tree is shown in S13 Fig. Bootstrap support values (>70%) are indicated. The branch of GlgP1 G. violaceus PCC7421 has been shortened to facilitate its visualization.
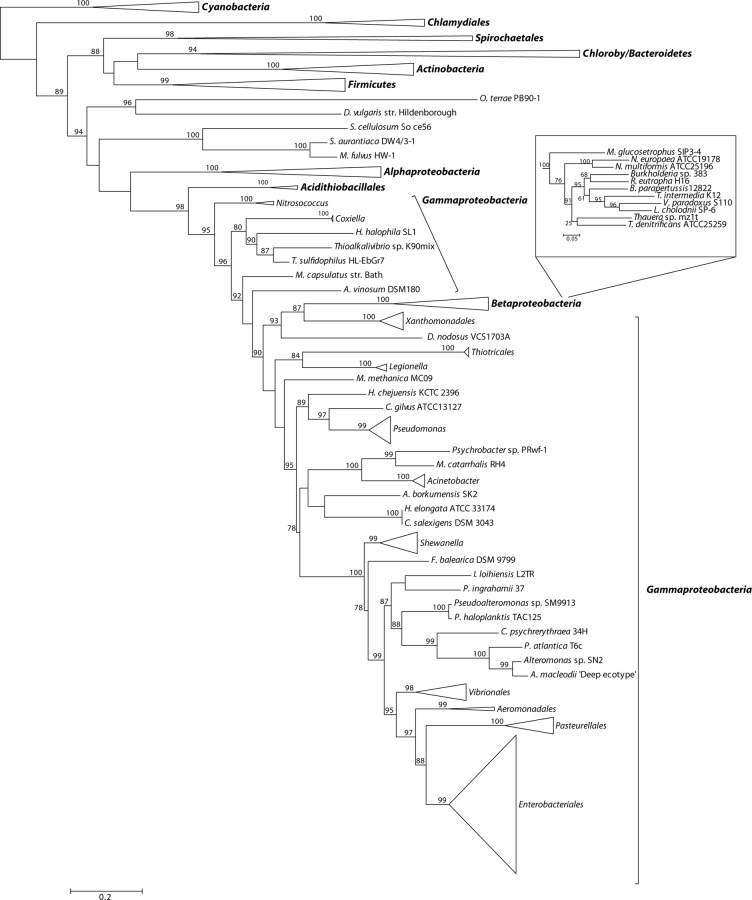
Figure 13. Summarized maximum-likelihood phylogenetic tree for 16S rRNA of the analyzed gammaproteobacterial species and of the selected species belonging to main bacterial groups.
Support values for the bootstrap analysis by maximum likelihood are given. The Gammaproteobacteria and main bacterial groups are denoted by brackets. The tree was midpoint rooted. The complete tree is shown in S14 Fig.
Figure 10. Summarized maximum-likelihood phylogenetic tree of the GlgC amino acid sequences of the analyzed gammaproteobacterial species and of the selected species belonging to main bacterial groups.
The tree was midpoint rooted. The complete tree is shown in S11 Fig. Bootstrap support values (>70%) are indicated.
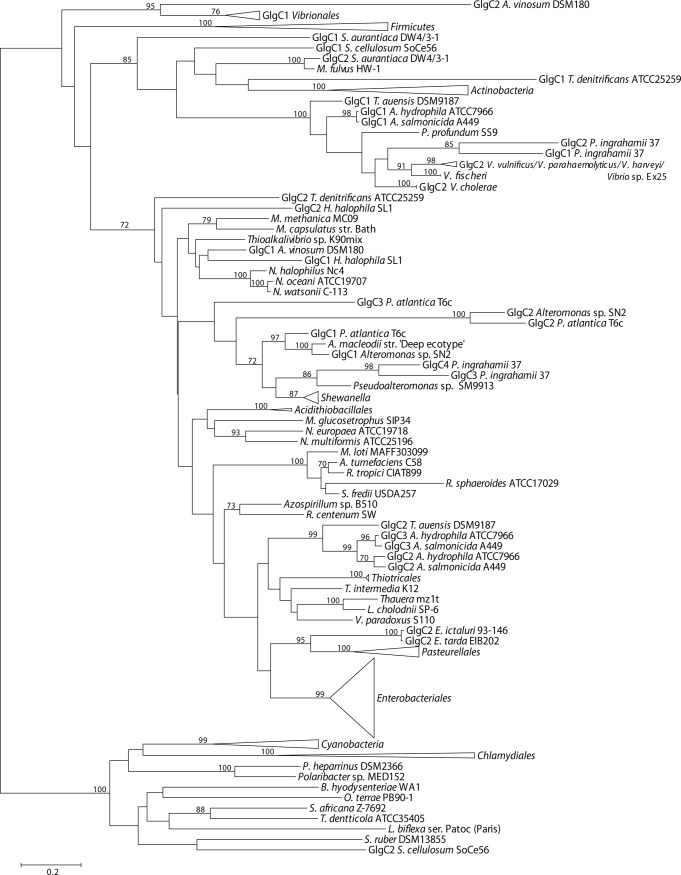
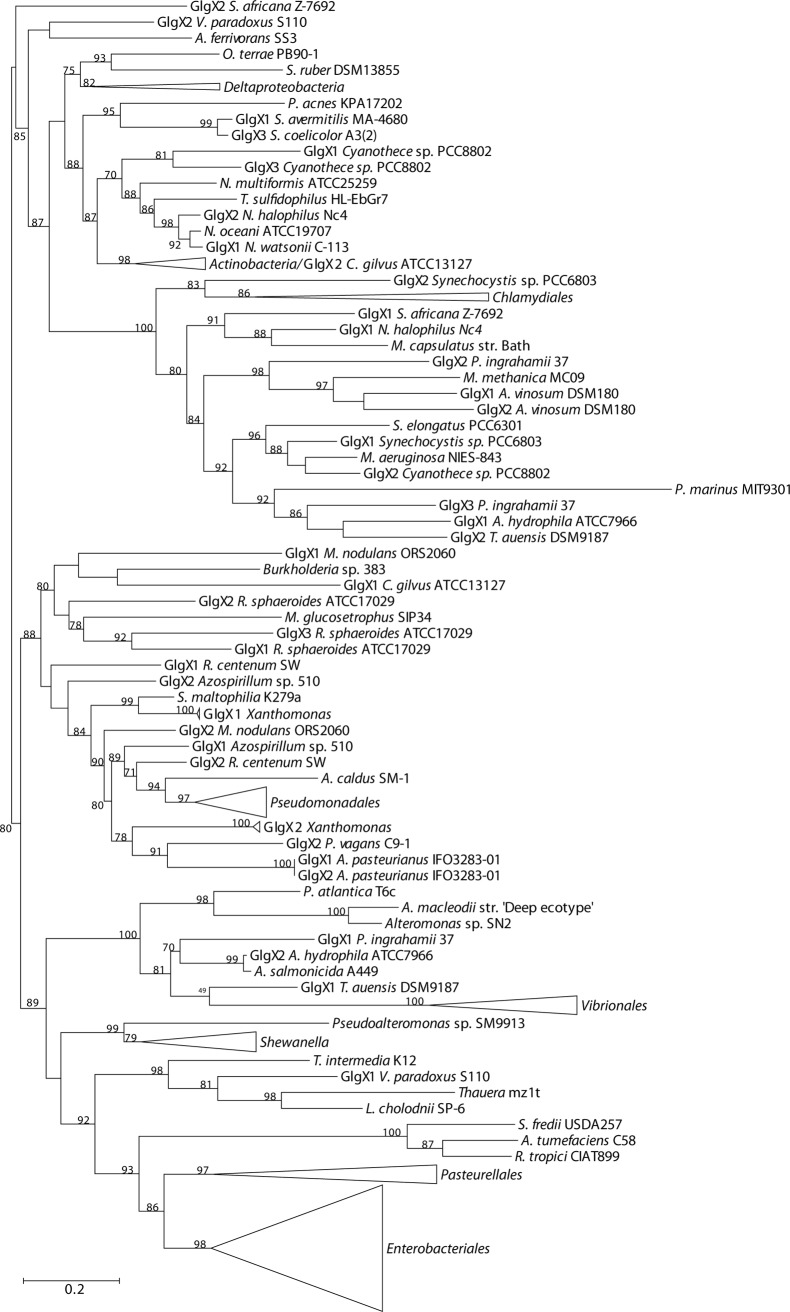
The above phylogenetic analyses further confirmed the E/P monophyly for the five glg genes and the lack of congruence between the Glg phylogenetic trees and the 16S rRNA reference tree (Figs. 8–13; S9–S14 Figs.). Remarkably, these analyses also revealed that the Glg proteins of the betaproteobacterial species Variovorax paradoxus S110, Thauera sp. mz1t, Leptothrix cholodnii SP-6 and Thiomonas intermedia K12 all clustered with their corresponding homologs of the E/P group, forming a sister clade of E/P in GlgB, GlgA and GlgP phylogenetic trees (Figs. 8, 11, 12; S9, S12, S13 Figs.). This close relationship among proteins of such distant lineages could be explained by horizontal gene transfer (HGT). HGT events can be detected by nucleotide compositional analyses. Therefore, compositional similarity analyses of V. paradoxus S110, Thauera sp. mz1t, L. cholodnii SP-6 and T. intermedia K12 genomes were carried out using GOHTAM web tool [30]. These analyses showed that glg genes of these betaproteobacterial species did not exhibit atypical compositional features in the context of their respective genomes (S3 Table). Finally, it is worth mentioning that among these betaproteobacterial species only V. paradoxus S110 possesses additional copies of glg genes (glgB2 and glgX2) (see below), which are related with glgB and glgX of other betaproteobacterial lineages (Figs. 8, 9; S9, S10 Figs.).
Figure 11. Summarized maximum-likelihood phylogenetic tree of the GlgA amino acid sequences of the analyzed gammaproteobacterial species and of the selected species belonging to main bacterial groups.
The tree was midpoint rooted. The complete tree is shown in S12 Fig. Bootstrap support values (>70%) are indicated. The branch of GlgA1 and GlgA2 A. pasteurianus IFO3283-01 has been shortened to facilitate its visualization.
Figure 9. Summarized maximum-likelihood phylogenetic tree of the GlgX amino acid sequences of the analyzed gammaproteobacterial species and of the selected species belonging to main bacterial groups.
The tree was midpoint rooted. The complete tree is shown in S10 Fig. Bootstrap support values (>70%) are indicated.
Genomic arrangement of glg genes
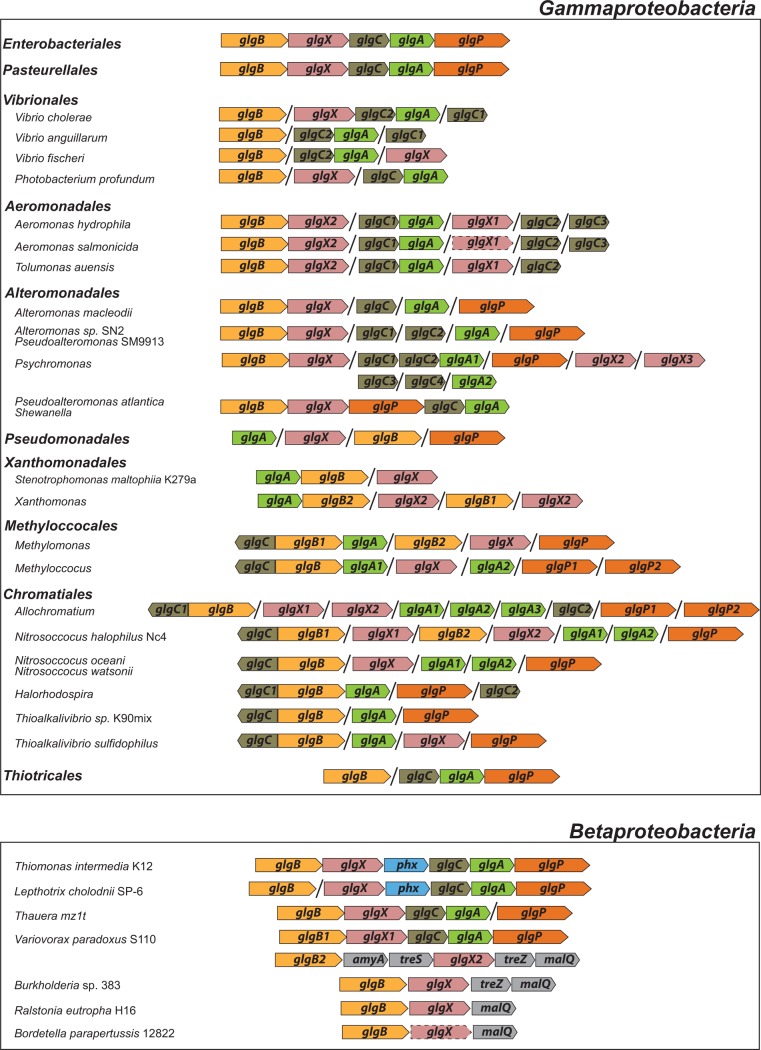
The analysis of the glg genes genomic context showed that the glgBXCAP arrangement exists not only in E. coli but also in all E/P species bearing glg genes (Fig. 14). This is not surprising since previous studies have shown that the gene order in operon structures in the Enterobacteriales and the Pasteurellales is well conserved [31,32]. Thus, 56% of operons of E. coli (order Enterobacteriales) were found to be identical to those of H. influenzae (order Pasteurellales) [31]. Remarkably, the phylogenetically distant betaproteobacterial species V. paradoxus S110, Thauera sp. mz1t, L. cholodnii SP-6 and T. intermedia K12 present a genomic arrangement of glg genes very similar to that of E/P (Fig. 14). In fact, the glg genes in V. paradoxus S110 are arranged following the glgBXCAP order (Fig. 14). No other analyzed species of any bacterial group exhibits the glgBXCAP arrangement.
Figure 14. Arrangements of glg genes in the specified species.
Colors indicate homologous genes. Arrows indicate the direction of transcription. Black lines indicate a physical separation between the genes and dashed lines indicate pseudogenes.
As noted above, V. paradoxus S110 possesses additional glgB and glgX copies to those of the glgBXCAP cluster (see above). These copies are arranged in a cluster similar to that occurring in the phylogenetically related betaproteobacterial species Burkholderia sp. 383, Ralstonia eutropha H16 and Bordetella parapertussis 12822 (Figs. 13, 14). Remarkably, T. intermedia K12 and L. cholodnii SP-6 present a phosphohexomutase encoding phx gene between glgX and glgC (Fig. 14).
Our studies of glg arrangements also revealed that glg genes are clustered in glgBXPCA disposition in the genus Shewanella and in the species P. atlantica T6c of the order Alteromonadales (Fig. 14). In addition, species of the orders Aeromonadales and Alteromonadales share the glgBX disposition of glg genes (Fig. 14), whereas the tandem glgCA is conserved in the species belonging to the orders Vibrionales and Aeromonadales (Fig. 14) and glgCAP is present in species of Thiotricales.
Discussion
The aim of this work was to elucidate the origin and evolutionary history of E. coli glg genes. Our analyses indicate that glg genes are present in most gammaproteobacterial lineages, from the earliest to the most recently emerged branches (Fig. 2). This widespread distribution in species displaying a wide range of lifestyles suggests that function(s) linked to glg genes would provide some advantages for survival under varied and varying environmental conditions. Yet, our analyses have also shown large variability in content, copy number and arrangement of glg genes among the different gammaproteobacterial lineages (S1 Table; Fig. 14). The phylogenetic analyses carried out in both the Gammaproteobacteria and other main bacterial groups revealed an important discordance between the evolution of glg genes (Figs. 3–12; S3–S13 Figs.) and the evolution of the analyzed bacterial species (Figs. 2, 13), thus strongly suggesting that HGT has played an important role in the evolutionary history of glg genes. However, a remarkable exception to this rule is constituted by species of the E/P group in which each individual glg gene forms a monophyletic group in the corresponding phylogenetic trees that agrees with the expected order of organismal descent as inferred from 16S rRNA phylogenetic analysis (Figs. 2, 13; S1, S14 Figs.). Our data strongly suggest that (a) E/P glg genes share a common origin in the last common ancestor (LCA) of the E/P group, (b) vertical inheritance has been the primary mode of transmission of these genes throughout evolution in this group and (c) the origin of the glgBXCAP cluster could be traced to the LCA of the E/P group as inferred from the same arrangement found in all analyzed E/P species. The complex evolutionary history of glg genes in the other bacterial lineages prevented us from further tracing the evolutionary history of gammaproteobacterial glg genes.
The most likely evolutionary explanation for the occurrence of species or groups totally or partially lacking glg genes is that both complete and partial losses of glg genes have occurred independently during the evolution of different gammaproteobacterial lineages. In the analyzed data set, partial glg losses are less frequent than the loss of all glg genes. In fact, the observed distribution of partial glg losses in the different gammaproteobacterial lineages can be explained by seven independent evolutionary events, whereas eighteen independent losses are necessary to explain the distribution of the species lacking all five glg genes (indicated by asterisks in Fig. 2). Examples of recent losses of all glg genes are provided by H. influenzae (order Pasteurellales) in which one isolate (F3031) lacks all glg genes whereas complete sets are present in phylogenetically close isolates such 86-028NP and PittGG (S1 Table; Fig. 2). Recent independent losses of all glg genes have also occurred in S. denitrificans OS217, S. halifaxensis HAW-EB4, S. paeleana ANG-SO1, S. sedimis HAW-EB3, S. woodyi ATCC51908, P. haloplanktis TAC125 (order Alteromonadales), S. maltophilia R551-3 (order Xanthomonadales) and Psychrobacter sp. PRwf-1 (order Pseudomonadales) (S1 Table; Fig. 2). The loss of all glg genes is also observed in the marine species belonging to the order Oceanospirillales, in the plant pathogenic species of Xylella, in the Acinetobacter species (which live in the soil and causes infections in humans), in the pathogenic species belonging to the order Legionellales, in P. mirabilis HI4320 or in the insect endosymbionts of the genera Buchnera, Blochmannia, Baumannia, Sodalis, Wigglesworthia and Photorhabdus (all belonging to the order Enterobacteriales) (S1 Table; Fig. 2).
Using 55 complete bacterial genomes (including 11 gammaproteobacterial genomes) Henrissat et al. (2002) [33] reported that bacteria lacking glycogen metabolism are parasitic, symbiotic or fastidious (i. e., difficult to cultivate under laboratory conditions). These authors thus hypothesized that (a) these bacteria rely on their host´s glycogen (or starch) metabolism and (b) the lack of glycogen metabolism is a trait associated with bacterial parasitic or symbiotic behaviors [33]. However, the analysis of a more comprehensive genome set conducted here fails to provide support to this hypothesis at least in the Gammaproteobacteria, since the lack of all glg genes is observed in species with drastically different lifestyles which are not necessarily parasitic, symbiotic or fastidious such as P. mirabilis HI4320, P. haloplanktis TAC125, S. denitrificans OS217, Psychrobacter sp. PRwf-1 or A. borkumensis SK2.
The absence of GlgC and GlgP from some gammaproteobacterial species (S1 Table) would imply the loss of ADPG synthesis and glycogen degradation, respectively. Alternatively, it is possible that the absence of these proteins could be compensated by others that are capable of carrying out the same function(s). In this respect we must emphasize that several reports have shown that multiple bacteria possess still unidentified sources of ADPG, other than GlgC, linked to glycogen biosynthesis [5,14,19,20,34]. In the absence of GlgP, it is likely that maltodextrin phosphorylase (MalP), an α-glucan phosphorylase with high similarity to GlgP, could control glycogen degradation [35–37]. On the other hand, the absence of GlgP in some gammaproteobacterial species could indicate that glg genes are not related to glycogen metabolism in these species but to other functions in which glycogen degrading enzymes are not necessary, such as the synthesis of exopolysaccharides. In this respect, it must be noted that Aeromonas hydrophila (a species lacking GlgP), possesses a GlgA enzyme recognizing both ADPG and UDP-glucose (UDPG) as substrates, and one GlgC homolog displaying UDPG pyrophosphorylase activity rather than ADPG pyrophosphorylase activity involved in the synthesis of a α-branched glucan surface polysaccharide linked to biofilm production [38].
Clustering of genes involved in the same metabolic pathway into a transcriptional unit or operon is frequently observed in bacteria [21–23]. Two models are generally considered to explain operon formation: (i) the selfish operon model postulates that HGT plays a key role in operon evolution [39]; (ii) the co-regulation model proposes that formation of operons facilitates co-regulation [40]. Grouping related genes under a common control mechanism would favour a more efficient regulation of gene expression levels and would allow bacteria to rapidly adapt their metabolism to environmental changes and biochemical needs [41–45]. In the case of glg genes, besides the glgBXCAP operon present in the gammaproteobacterial E/P group, different glg arrangements have been described in other phylogenetically distant bacteria such as in the alphaproteobacterial species Agrobacterium tumefaciens, Rizhobium tropici and Mesorhizobium loti, and also in the Gram-positive species Bacillus subtilis and Bacillus stearothermophilus [7]. In this work we have described the presence of the glgBXPCA arrangement in species of the gammaproteobacterial genus Shewanella and in the species P. atlantica T6c (Fig. 14). It is worth noting that our phylogenetic analyses showed that P. atlantica T6c and Shewanella glg genes are not closely related (Figs. 3–12; S3–S7, S9–S13 Figs.), which suggests an independent assembly of the glgBXPCA cluster in them. Moreover, the glgBX arrangement is shared by species of the orders Aeromonadales and Alteromonadales (Fig. 14), the tandem glgCA is present in Vibrionales and Aeromonadales (Fig. 14), and the glgCAP arrangement is present in Thiotricales. Therefore, it seems that along evolution glg genes have been clustered together in several independent occasions and in different order, probably responding to different metabolic needs imposed by the environment and lifestyles. Needless to say, further research on the glycogen metabolism and evolution of glycogen operons in a wide range of bacterial species is necessary to confirm (or refute) this hypothesis.
Our study has allowed tracing the evolutionary origin of the glgBXCAP operon to the LCA of the E/P group. We can just speculate about the advantages that would account for the widespread preservation of the glgBXCAP arrangement throughout the evolution of the E/P group. The transcription of the glgBXCAP operon implies the combined expression of glycogen synthetic and degradative enzymes, allowing the simultaneous synthesis and degradation of glycogen. It was previously proposed that the balance of parallel synthesis and degradation pathways serves to maintain glycogen structure and to function as a carbon capacitor thus allowing a sensitive regulation of downstream carbon and energy fluxes [17,46,47]. The resulting turnover of glycogen would entail advantages such as dissipation of excess energy, sensitive regulation and rapid channeling of metabolic intermediates toward various metabolic pathways in response to biochemical needs [48,49]. The latter is particularly relevant, especially when considering that previous reports have shown that glycogen metabolism is highly interconnected with a wide variety of cellular processes [19,50,51].
The observed clustering of the E/P group with phylogenetically distant betaproteobacterial species V. paradoxus S110, L. cholodnii SP-6, T. intermedia K12 and Thauera sp. mz1t in the Glg phylogenetic trees (Figs. 8–12; S9–S13 Figs.), along with the presence of glgBXCAP and/or gene clusters similar to glgBXCAP exclusively in these betaproteobacterial species (Fig. 14) can be explained by (i) an ancestral duplication of the glgBXCAP cluster in their LCA and subsequent loss in all intervening lineages, (ii) two independent HGT events of the glgBXCAP cluster from E/P, the first one to the common ancestor of V. paradoxus S110, L. cholodnii SP-6 and T. intermedia K12, and the second one to Thauera sp. mz1t, (iii) an HGT event of the glgBXCAP cluster from E/P to the common ancestor of V. paradoxus S110, L. cholodnii SP-6 and T. intermedia K12 or to Thauera sp. mz1t, and a second HGT event between them, or (iv) an HGT event of the glgBXCAP cluster from E/P to the LCA of the four betaproteobacterial species and followed by subsequent multiple, independent losses in the species Burkholderia sp. 383, R. eutropha H16, B. parapertussis 12822 and Thiobacillus denitrificans ATCC25259 (see Fig. 13). Previous studies based on parametric methods and aimed at predicting horizontally transferred genes did not identify the glg genes as horizontally transferred in the above betaproteobacterial species [52,53], thus favoring the hypothesis of the occurrence of an ancestral duplication of glg genes. Consistently, compositional analysis of V. paradoxus S110, L. cholodnii SP-6, T. intermedia K12 and Thauera sp. mz1t carried out in this work (S3 Table) did not identify glg genes as exhibiting atypical compositional features. However, we must emphasize that HGT events produce a localized nucleotide bias that tends to disappear in a relatively short period of evolutionary time, a process commonly known as amelioration [54]. Thus, failure of parametric methods in identifying glg genes as horizontally transferred in the above four betaproteobacterial species can be explained by this phenomenon in a situation where the putative HGT event(s) would have occurred before the differentiation of these betaproteobacterial lineages. Although data available cannot unequivocally confirm or rule out any of the above scenarios, it must be noted that the second and the third scenarios (both encompassing HGT events) are the most parsimonious since they would imply only two independent evolutionary events whereas the first would imply multiple and independent losses in other lineages, and the fourth requires five independent events (one HGT and four independent losses).
We must emphasize that V. paradoxus S110 possesses additional copies of both glgB and glgX (Figs. 8, 9; S9, S10 Figs.), which are very distant to their own homologs related with the E/P group and located in gene clusters similar to those found in their phylogenetically related betaproteobacterial species Burkholderia sp. 383, R. eutropha H16, and B. parapertussis 12822 (Fig. 14). This reinforces the possibility of an horizontal transfer of the complete glgBXCAP operon from E/P to the ancestor of V. paradoxus S110, L. cholodnii SP-6, T. intermedia K12 and/or to Thauera sp. mz1t. Subsequent gene rearrangements led to the clusters observed in these species. These rearrangements include the relocation of glgB in L. cholodnii SP-6 and of glgP in Thauera mz1t, as well as the acquisition of phx genes in T. intermedia K12 and L. cholodnii SP-6.
In agreement with researchers favoring a view in which HGT has played a major continuous role in evolution [55–59] our results indicate its prevalence in the evolution and distribution of glg genes within Bacteria. Two main pieces of evidence support this conclusion. First, the phylogenetic analysis of the five Glg proteins shows that the evolution of glg genes is in clear conflict with the order of organismal descent, inferred from the 16S rRNA analysis. Second, in species possessing more than one copy of a given glg gene, some of the copies are related to homologous copies of phylogenetically distant species as for example glgX2 of the gammaproteobacterial species Pantoea vagans C9-1 (order Enterobacteriales) which is more related to its homolog present in the alphaproteobacterial species Acetobacter pasteurianus IFO 3283-01 (Fig. 11; S8 Fig.), glgX2 of Cellvibrio gilvus ATCC13127 (gammaproteobacterial order Pseudomonadales) which is more related with homologs from Actinobacteria (Fig. 11; S8 Fig.), and glgC2 of Edwardsiella (gammaproteobacterial order Enterobacteriales) which is more related with homologs of the Pasteurellales (Fig. 12; S9 Fig.). Moreover, our results also suggest the occurrence of an horizontal transfer of the complete glgBXCAP operon from E/P group to some Betaproteobacteria, indicating that HGT is not restricted to individual glg genes, adding more complexity to the evolution of these genes.
Materials and Methods
Sequences
We have analyzed the complete genomes of 265 different gammaproteobacterial species and strains (see S1 Table) and of 75 species of the main bacterial groups outside the Gammaproteobacteria (see S2 Table) retrieved from the NCBI repository. GlgB, GlgX, GlgC, GlgA, and GlgP encoding genes were retrieved from whole genomes by using PSI-BLAST [60]. The PSI-BLAST searches were performed against the GenBank database using the E. coli GlgB, GlgX, GlgC, GlgA and GlgP (accession numbers NP_417890.1, NP_417889.1, NP_417888.1, NP_417887.1 and NP_417886.1 respectively) as query sequences with default settings. From all the sequences retrieved, only those from whole genomes were selected, and these were subsequently filtered attending to a coverage of at least 75% and an identity of at least 35% of the query sequence. The corresponding 16S rRNA sequences from each genome were downloaded using the tools implemented in the Ribosomal Database Project II (RDB-II) [61].
Alignments and phylogenetic information analyses
Multiple alignments were obtained with ClustalW [62] and were manually corrected. Positions of uncertain homology and extensive gaps were removed using GBLOCKS with default settings [63]. The final multiple alignments used for the analyses are available from the authors upon request. The best-fit models of amino acid substitution were determined using the program ProtTest [64]. The Akaike Information Criterion (AIC), which allows for a comparison of likelihoods from non-tested models, was adopted to select the best model [65]. For the five proteins the model LG [66] with a discrete gamma distribution to account for heterogeneity in evolutionary rates among sites, an estimation of the proportion of invariant sites and the empirical frequencies of amino acids (LG+G+I+F) was identified as the best-fit model. The phylogenetic signal contained in the different data sets was assessed by likelihood-mapping [67] using TreePuzzle 5.2 [68]. This method evaluates the resolution in quartets generated from combinations of the different sequences under study. Values below 90% resolved quartets were considered to indicate a low phylogenetic signal. In this evaluation we used the WAG model [28] of amino acid evolution and a discrete gamma distribution to account for heterogeneity in evolutionary rates among positions in the multiple alignments (S2, S8 Figs.).
Phylogenetic reconstructions
The model selected by ProtTest was implemented in PhyML 3.0 [69] to obtain maximum likelihood (ML) trees for the different multiple alignments. Bootstrap support values were obtained from 1000 pseudorandom replicates.
To obtain the phylogenetic reference trees encompassing all the analyzed species, sequences of genes encoding 16S rRNA were obtained using the tools implemented in the RDB-II. The sequences were aligned using the aligner implemented in RDB-II. The best fit-model of nucleotide substitution was selected using jModelTest [70] with the AIC criterion. The phylogenetic relationships were inferred using PhyML with the GTR model of nucleotide substitution and the proportion of invariant and rate heterogeneity categories estimated from the data set. Bootstrap support values were obtained from 1000 pseudorandom replicates.
For the E/P group we carried out a comparison between each glg gene tree and the 16S rRNA (reference tree) topology. The Shimodaira-Hasegawa´s test (SH test) [71] as implemented in the program TreePuzzle 5.2 was used to determine whether the likelihood of the data associated to each tree was significantly different at an alpha level of 0.05 (a value above the threshold indicating a non-significant difference). Phylogenetic trees of 16S rRNA sequences were obtained with the Tree Builder tool of the RDB-II and compared to ML phylogenetic trees of the corresponding Glg sequences from E/P species.
Compositional analyses
Nucleotide compositional analyses were carried out using the GOHTAM web tool [30]. This web tool allows to identify genomic regions and/or genes that exhibit atypical features compared to the rest of the sequence. The detection is based on a combination of the genomic signature [72,73] and a codon usage method [74].
Supporting Information
In the case of endosymbionts of insects, the corresponding host species is also indicated between brackets.
(DOCX)
(DOCX)
(XLS)
Support values >70% for the bootstrap analysis by maximum likelihood are given. The tree was rooted with the alphaproteobacterial species Azospirillum sp. B510.
(EPS)
The regions at the corners of the triangles correspond to the three possible tree topologies for a quartet; the lateral regions to partly resolved trees and the central region to unresolved trees. The numbers indicate the percentage of quartets falling in each region.
(EPS)
The tree was rooted with the alphaproteobacterial species Azospirillum sp. B510. Support values >70% for the bootstrap analysis by maximum likelihood are given.
(EPS)
The tree was rooted with the alphaproteobacterial species Azospirillum sp. B510. Support values >70% for the bootstrap analysis by maximum likelihood are given.
(EPS)
The tree was rooted with the alphaproteobacterial species Azospirillum sp. B510. Support values >70% for the bootstrap analysis by maximum likelihood are given.
(EPS)
The tree was rooted with the alphaproteobacterial species Azospirillum sp. B510. Support values >70% for the bootstrap analysis by maximum likelihood are given.
(EPS)
The tree was rooted with the alphaproteobacterial species Azospirillum sp. B510. Support values >70% for the bootstrap analysis by maximum likelihood are given.
(EPS)
The regions at the corners of the triangles correspond to the three possible tree topologies for a quartet; the lateral regions to partly resolved trees and the central region to unresolved trees. The numbers indicate the percentage of quartets falling in each region.
(EPS)
The tree is midpoint rooted. Support values >70% for the bootstrap analysis by maximum likelihood are given.
(EPS)
The tree is midpoint rooted. Support values >70% for the bootstrap analysis by maximum likelihood are given.
(EPS)
The tree is midpoint rooted. Support values >70% for the bootstrap analysis by maximum likelihood are given.
(EPS)
The tree is midpoint rooted. Support values >70% for the bootstrap analysis by maximum likelihood are given.
(EPS)
The tree is midpoint rooted. Support values >70% for the bootstrap analysis by maximum likelihood are given.
(EPS)
Support values >70% for the bootstrap analysis by maximum likelihood are given. The tree was midpoint rooted.
(EPS)
Data Availability
All relevant data are within the paper and its Supporting Information files.
Funding Statement
This research was partially supported by the grant [BIO2010-18239] from the Comisión Interministerial de Ciencia y Tecnología and Fondo Europeo de Desarrollo Regional (Spain). MR acknowledges a pre-doctoral JAE fellowship from the Consejo Superior de Investigaciones Científicas. AMV is grateful to the funding of the Programa Campus Iberus de Excelencia Internacional, Ministerio de Educación, Spain. His 2-month visit (January-March 2014) to the Institute of Agrobiotechnology, Public Universtity of Navarra, Pamplona, Spain, was included into the Proyecto financiado por el Ministerio de Educación en el marco del Programa Campus de Excelencia Internacional. FGC was supported by project [BFU2011-24112] from the Ministerio de Ciencia e Innovación (Spain).
References
- 1. Strange RE (1968) Bacterial ‘glycogen’ and survival. Nature 220: 606–607. [DOI] [PubMed] [Google Scholar]
- 2. Van Houte J, Jansen HM (1970) Role of glycogen in survival of Streptococcus mitis . J Bacteriol 101: 1083–1085. [DOI] [PMC free article] [PubMed] [Google Scholar]
- 3. Uttaro AD, Ugalde RA (1994) A chromosomal cluster of genes encoding ADP-glucose synthetase, glycogen synthase and phosphoglucomutase in Agrobacterium tumefaciens . Gene 150: 117–122. 10.1016/0378-1119(94)90869-9 [DOI] [PubMed] [Google Scholar]
- 4. Ugalde JE, Lepek V, Uttaro A, Estrella J, Iglesias A, et al. (1998) Gene organization and transcription analysis of the Agrobacterium tumefaciens glycogen (glg) operon: two transcripts for the single phosphoglucomutase gene. J Bacteriol 180: 6557–6564. [DOI] [PMC free article] [PubMed] [Google Scholar]
- 5. Sambou T, Dinadayala P, Stadthagen G, Barilone N, Bordat Y, et al. (2008) Capsular glucan and intracellular glycogen of Mycobacterium tuberculosis: biosynthesis and impact on the persistence in mice. Mol. Microbiol 70: 762–774. 10.1111/j.1365-2958.2008.06445.x [DOI] [PMC free article] [PubMed] [Google Scholar]
- 6. Preiss J (2009) Glycogen: biosynthesis and regulation. In: Böck A, Curtiss R, Kaper JB, Karp PD, Neidhardt FC, Nyström T, Slauch JM, Squires CL, Ussery D, editors. EcoSal- Cellular and molecular biology of Escherichia coli and Salmonella. Washington DC: ASM Press. [Google Scholar]
- 7. Wilson WA, Roach PJ, Montero M, Baroja-Fernández E, Muñoz FJ, et al. (2010) Regulation of glycogen metabolism in yeast and bacteria. FEMS Microbiol Rev 34: 952–985. 10.1111/j.1574-6976.2010.00220.x [DOI] [PMC free article] [PubMed] [Google Scholar]
- 8. Wang L, Wise MJ (2011) Glycogen with short average chain length enhances bacterial durability. Naturwissenschaften 98: 719–729. 10.1007/s00114-011-0832-x [DOI] [PubMed] [Google Scholar]
- 9. Quilès F, Polyakov P, Humbert F, Francius G (2012) Production of extracellular glycogen by Pseudomonas fluorescens: spectroscopic evidence and conformational analysis by biomolecular recognition. Biomacromolecules 13: 2118–2127. 10.1021/bm300497c [DOI] [PubMed] [Google Scholar]
- 10. Bonafonte MA, Solano C, Sesma B, Alvarez M, Montuenga L, et al. (2000) The relationship between glycogen synthesis, biofilm formation and virulence in Salmonella enteritidis . FEMS Microbiol Lett 191: 31–36. 10.1111/j.1574-6968.2000.tb09315.x [DOI] [PubMed] [Google Scholar]
- 11. Bourassa L, Camilli A (2009) Glycogen contributes to the environmental persistence and transmission of Vibrio cholerae . Mol Microbiol 72: 124–138. 10.1111/j.1365-2958.2009.06629.x [DOI] [PMC free article] [PubMed] [Google Scholar]
- 12. Chandra G, Chater KF, Bornemann S (2011) Unexpected and widespread connections between bacterial glycogen and trehalose metabolism. Microbiology 157: 1565–1572. 10.1099/mic.0.044263-0 [DOI] [PubMed] [Google Scholar]
- 13. Yamamotoya T, Dose H, Tian Z, Fauré A, Toya Y, et al. (2012) Glycogen is the primary source of glucose during the lag phase of E. coli proliferation. Biochim Biophys Acta 1824: 1442–1448. 10.1016/j.bbapap.2012.06.010 [DOI] [PubMed] [Google Scholar]
- 14. Guerra LT, Xu Y, Bennette N, McNeely K, Bryant DA, et al. (2013) Natural osmolytes are much less effective substrates than glycogen for catabolic energy production in the marine cyanobacterium Synechococcus sp. strain PCC 7002. J Biotechnol 166: 65–75. 10.1016/j.jbiotec.2013.04.005 [DOI] [PubMed] [Google Scholar]
- 15. Pieper R, Fisher CR, Suh MJ, Huang ST, Parmar P, et al. (2013) Analysis of the proteome of intracellular Shigella flexneri reveals pathways important for intracellular growth. Infect Immun 81: 4635–4648. 10.1128/IAI.00975-13 [DOI] [PMC free article] [PubMed] [Google Scholar]
- 16. Ballicora MA, Iglesias AA, Preiss J (2003) ADP-glucose pyrophosphorylase, a regulatory enzyme for bacterial glycogen synthesis. Microbiol Mol Biol Rev 67: 213–225. 10.1128/MMBR.67.2.213-225.2003 [DOI] [PMC free article] [PubMed] [Google Scholar]
- 17. Dauvillée D, Kinderf IS, Li Z, Kosar-Hashemi B, Samuel MS, et al. (2005) Role of the Escherichia coli glgX gene in glycogen metabolism. J Bacteriol 187: 1465–1473. 10.1128/JB.187.4.1465-1473.2005 [DOI] [PMC free article] [PubMed] [Google Scholar]
- 18. Alonso-Casajus N, Dauvillee D, Viale AM, Munoz FJ, Baroja-Fernandez E, et al. (2006) Glycogen phosphorylase, the product of the glgP gene, catalyzes glycogen breakdown by removing glucose units from the nonreducing ends in Escherichia coli . J Bacteriol 188: 5266–5272. 10.1128/JB.01566-05 [DOI] [PMC free article] [PubMed] [Google Scholar]
- 19. Eydallin G, Morán-Zorzano MT, Muñoz FJ, Baroja-Fernández E, Montero M, et al. (2007) An Escherichia coli mutant producing a truncated inactive form of GlgC synthesizes glycogen: further evidences for the occurrence of various important sources of ADPglucose in enterobacteria. FEBS Lett 581: 4417–4422. 10.1016/j.febslet.2007.08.016 [DOI] [PubMed] [Google Scholar]
- 20. Morán-Zorzano MT, Alonso-Casajús N, Muñoz FJ, Viale AM, Baroja-Fernández E, et al. (2007) Occurrence of more than one important source of ADPglucose linked to glycogen biosynthesis in Escherichia coli and Salmonella enterica . FEBS Lett 581: 4423–4429. 10.1016/j.febslet.2007.08.017 [DOI] [PubMed] [Google Scholar]
- 21. Lewin B (1997) GENES IV. Oxford: Oxford University Press. [Google Scholar]
- 22. Dandekar T, Snel B, Huynen M, Bork P (1998) Conservation of gene order: a fingerprint of proteins that physically interact. Trends Biochem Sci 23: 324–328. 10.1016/S0968-0004(98)01274-2 [DOI] [PubMed] [Google Scholar]
- 23. Lawrence J (1999) Selfish operons: the evolutionary impact of gene clustering in prokaryotes and eukaryotes. Curr Opin Genet Dev 9: 642–648. 10.1016/S0959-437X(99)00025-8 [DOI] [PubMed] [Google Scholar]
- 24. Montero M, Almagro G, Eydallin G, Viale AM, Muñoz FJ, et al. (2011) Escherichia coli glycogen genes are organized in a single glgBXCAP transcriptional unit possessing an alternative suboperonic promoter within glgC that directs glgAP expression. Biochem. J 433: 107–117. 10.1042/BJ20101186 [DOI] [PubMed] [Google Scholar]
- 25. Williams KP, Gillespie JJ, Sobral BW, Nordberg EK, Snyder EE, et al. (2010) Phylogeny of gammaproteobacteria. J Bacteriol 192: 2305–2314. 10.1128/JB.01480-09 [DOI] [PMC free article] [PubMed] [Google Scholar]
- 26. Garrity GM, Bell JA, Liburn TG (2005) Taxonomic outline of the prokaryotes, Bergey´s manual of systematic bacteriology. New York: Springer verlag. [Google Scholar]
- 27. Husnik F, Chrudimsky T, Hypsa V (2011) Multiple origins of endosymbiosis within the Enterobacteriaceae (gamma-Proteobacteria): convergence of complex phylogenetic approaches. BMC Biol 9: 87 10.1186/1741-7007-9-87 [DOI] [PMC free article] [PubMed] [Google Scholar]
- 28. Jones DT, Taylor WR, Thornton JM (1992) The rapid generation of mutation data matrices from protein sequences. Comput Appl Biosci 8: 275–282. [DOI] [PubMed] [Google Scholar]
- 29. Gao B, Mohan R, Gupta RS (2009) Phylogenomics and protein signatures elucidating the evolutionary relationships among the Gammaproteobacteria . Int J Syst Evol Microbiol 59: 234–247. 10.1099/ijs.0.002741-0 [DOI] [PubMed] [Google Scholar]
- 30. Ménigaud S, Mallet L, Picord G, Churlaud C, Borrel A, et al. (2012) GOHTAM: a website for genomic origin of horizontal transfers, alignment and metagenomics. Bioinformatics 28: 1270–1271. 10.1093/bioinformatics/bts118 [DOI] [PMC free article] [PubMed] [Google Scholar]
- 31. Watanabe H, Mori H, Itoh T, Gojobori T (1997) Genome plasticity as a paradigm of eubacteria evolution. J Mol Evol 44 Suppl 1: S57–S64. 10.1007/PL00000052 [DOI] [PubMed] [Google Scholar]
- 32. Itoh T, Takemoto K, Mori H, Gojobori T (1999) Evolutionary instability of operon structures disclosed by sequence comparisons of complete microbial genomes. Mol Biol Evol 16: 332–346. 10.1093/oxfordjournals.molbev.a026114 [DOI] [PubMed] [Google Scholar]
- 33. Henrissat B, Deleury E, Coutinho PM (2002) Glycogen metabolism loss: a common marker of parasitic behaviour in bacteria? Trends Genet 18: 437–440. 10.1016/S0168-9525(02)02734-8 [DOI] [PubMed] [Google Scholar]
- 34. Martin MC, Scheneider D, Bruton CJ, Chater KF, Hardisson C (1997) A glgC gene essential only for the first two spatially distinct phases of glycogen synthesis in Streptomyces coelicolor . J Bacteriol 179: 7784–7789. [DOI] [PMC free article] [PubMed] [Google Scholar]
- 35. Schwartz M, Hofnung M (1967) La maltodextrine phosphorylase d´Escherichia coli . Europ J Biochem 1: 132–145. [DOI] [PubMed] [Google Scholar]
- 36. Chen GS, Segel IH (1968) Escherichia coli polyglucose phosphorylases. Arch Biochem Biophys 127: 164–174. 10.1016/0003-9861(68)90213-0 [DOI] [PubMed] [Google Scholar]
- 37. Park JT, Shim JH, Tran PL, Hong IH, Yong HU, et al. (2011) Role of maltose enzymes in glycogen synthesis by Escherichia coli . J Bacteriol 193: 2517–2526. 10.1128/JB.01238-10 [DOI] [PMC free article] [PubMed] [Google Scholar]
- 38. Merino S, Bouamama L, Knirel YA, Senchenkova SN, Regué M, et al. (2012) Aeromonas surface glucan attached through the O-antigen ligase represents a new way to obtain UDP-glucose. PLoS One 7: e35707 10.1371/journal.pone.0035707 [DOI] [PMC free article] [PubMed] [Google Scholar]
- 39. Lawrence JG, Roth JR (1996) Selfish operons: horizontal transfer may drive the evolution of gene clusters. Genetics 143: 1843–1860. [DOI] [PMC free article] [PubMed] [Google Scholar]
- 40. Jacob F, Monod J (1961) On the regulation of gene activity. Cold Spring Harb Symp Quant Biol 26: 193–211. [DOI] [PubMed] [Google Scholar]
- 41. Lawrence JG (2002) Shared strategies in gene organization among prokaryotes and eukaryotes. Cell 110: 407–413. 10.1016/S0092-8674(02)00900-5 [DOI] [PubMed] [Google Scholar]
- 42. Price MN, Huang KH, Arkin AP, Alm EJ (2005) Operon formation is driven by co-regulation and not by horizontal gene transfer. Genome Res 15: 809–819. 10.1101/gr.3368805 [DOI] [PMC free article] [PubMed] [Google Scholar]
- 43. Price MN, Arkin AP, Alm EJ (2006) The life-cycle of operons. PLoS Genet 2: e96 10.1371/journal.pgen.0020096 [DOI] [PMC free article] [PubMed] [Google Scholar]
- 44. Tabor JJ, Bayer TS, Simpson ZB, Levy M, Ellington AD (2008) Engineering stochasticity in gene expression. Mol Biosyst 4: 754–761. 10.1039/b801245h [DOI] [PMC free article] [PubMed] [Google Scholar]
- 45. Sneppen K, Pedersen S, Krishna S, Dodd I, Semsey S (2010) Economy of operon formation: contranscription minimizes shortfall in protein complexes. MBio 1: e00177–10. 10.1128/mBio.00177-10 [DOI] [PMC free article] [PubMed] [Google Scholar]
- 46. Seibold GM, Eikmanns BJ (2007) The glgX gene product of Corynebacterium glutamicum is required for glycogen degradation and for fast adaptation to hyperosmotic stress. Microbiology 153: 2212–2220. 10.1099/mic.0.2006/005181-0 [DOI] [PubMed] [Google Scholar]
- 47. Belanger AE, Hatfull GF (1999) Exponential-phase glycogen recycling is essential for growth of Mycobacterium smegmatis . J. Bacteriol 181: 6670–6678. [DOI] [PMC free article] [PubMed] [Google Scholar]
- 48. Newsholme EA, Challiss RAJ, Crabtree B (1984) Substrate cycles: their role in improving sensitivity in metabolic control. TIBS 9: 277–280. [Google Scholar]
- 49. Neijssel OM, Buurman ET, Texeira de Matos MJ (1990) The role of futile cycles in the energetics of bacterial growth. Biochim Biophys Acta 1018: 252–255. 10.1016/0005-2728(90)90260-B [DOI] [PubMed] [Google Scholar]
- 50. Eydallin G, Montero M, Almagro G, Sesma MT, Viale AM, et al. (2010) Genome-wide screening of genes whose enhanced expression affects glycogen accumulation in Escherichia coli . DNA Res 17: 61–71. 10.1093/dnares/dsp028 [DOI] [PMC free article] [PubMed] [Google Scholar]
- 51. Montero M, Eydallin G, Viale AM, Almagro G, Muñoz FJ, et al. (2009) Escherichia coli glycogen metabolism is controlled by the PhoP-PhoQ regulatory system at submillimolar environmental Mg2+ concentrations, and is highly interconnected with a wide variety of cellular processes. Biochem J 424: 129–141. 10.1042/BJ20090980 [DOI] [PubMed] [Google Scholar]
- 52. García-Vallvé S, Guzmán E, Montero MA, Romeu A (2003) HGT-DB: a database of putative horizontally transferred genes in prokaryotic complete genomes. Nucleic Acids Res 31: 187–189. 10.1093/nar/gkg004 [DOI] [PMC free article] [PubMed] [Google Scholar]
- 53. Nakamura Y, Itoh T, Matsuda H, Gojobori T (2004) Biased biological functions of horizontally transferred genes in prokaryotic genomes. Nat Genet 36: 760–766. 10.1038/ng1381 [DOI] [PubMed] [Google Scholar]
- 54. Lawrence JG, Ochman H. (1997) Amelioration of bacterial genomes: rates of change and exchange. J Mol Evol 44: 383–397. 10.1007/PL00006158 [DOI] [PubMed] [Google Scholar]
- 55. Doolittle WF (1999) Lateral genomics. Trends Cell Biol 9: M5–M8. [PubMed] [Google Scholar]
- 56. Jain R, Rivera MC, Lake JA (1999) Horizontal gene transfer among genomes:The complexity hypothesis. Proc Natl Acad Sci USA 96: 3801–3806. 10.1073/pnas.96.7.3801 [DOI] [PMC free article] [PubMed] [Google Scholar]
- 57. De la Cruz F, Davies J (2000) Horizontal gene transfer and the origin of species: Lessons from bacteria. Trends Microbiol 8: 128–133. 10.1016/S0966-842X(00)01703-0 [DOI] [PubMed] [Google Scholar]
- 58. Ochman H, Lawrence JG, Groisman EA (2000) Lateral gene transfer and the nature of bacterial innovation. Nature 405: 299–304. 10.1038/35012500 [DOI] [PubMed] [Google Scholar]
- 59. Lawrence JG (2002) Gene transfer in bacteria: Speciation without species? Theor Popul Biol 61: 449–460. 10.1006/tpbi.2002.1587 [DOI] [PubMed] [Google Scholar]
- 60. Altschul F, Vyas V, Cornfield A, Goodin S, Ravikumar TS, et al. (1997) Basic local alignment search tool. J Mol Biol 215: 403–410. [DOI] [PubMed] [Google Scholar]
- 61. Cole JR, Chai B, Farris RJ, Wang Q, Kulam-Syed-Mohideen AS, et al. (2007) The ribosomal database project (RDP-II): introducing myRDP space and quality controlled public data. Nucleic Acids Res 35: D169–D172. 10.1093/nar/gkl889 [DOI] [PMC free article] [PubMed] [Google Scholar]
- 62. Thompson JD, Higgins DG, Gibson TJ (1994) CLUSTAL W: improving the sensitivity of progressive multiple sequence alignment through sequence weighting, position-specific gap penalties and weight matrix choice. Nucleic Acids Res 22: 4673–4680. 10.1093/nar/22.22.4673 [DOI] [PMC free article] [PubMed] [Google Scholar]
- 63. Castresana J (2000) Selection of conserved blocks from multiple alignments for their use in phylogenetic analysis. Mol Biol Evol 17: 540–552. 10.1093/oxfordjournals.molbev.a026334 [DOI] [PubMed] [Google Scholar]
- 64. Abascal F, Zardoya R, Posada D (2005) ProtTest: Selection of best-fit models of protein evolution. Bioinformatics 21: 2104–2105. 10.1093/bioinformatics/bti263 [DOI] [PubMed] [Google Scholar]
- 65. Akaike H (1974) A new look at the statistical model identification. IEEE Trans Automat Contr AC- 19: 716–723. [Google Scholar]
- 66. Le SQ, Gascuel O (2008) An improved general amino acid replacement matrix. Mol Biol Evol 25: 1307–1320. 10.1093/molbev/msn067 [DOI] [PubMed] [Google Scholar]
- 67. Strimmer K, von Haeseler A (1997) Likelihood-mapping: A simple method to visualize phylogenetic content of a sequence alignment. Proc Natl Acad Sci USA 94: 6815–6819. 10.1073/pnas.94.13.6815 [DOI] [PMC free article] [PubMed] [Google Scholar]
- 68. Schmidt HA, Strimmer K, Vingron M, von Haeseler A (2002) TREE-PUZZLE: maximum likelihood phylogenetic analysis using quartets and parallel computing. Bioinformatics 18: 502–504. 10.1093/bioinformatics/18.3.502 [DOI] [PubMed] [Google Scholar]
- 69. Guindon S, Dufayard JF, Lefort V, Anisimova M, Hordijk W, et al. (2010) New Algorithms and Methods to Estimate Maximum-Likelihood Phylogenies: Assessing the Performance of PhyML 3.0. Syst Biol 59: 307–321. 10.1093/sysbio/syq010 [DOI] [PubMed] [Google Scholar]
- 70. Darriba D, Taboada GL, Doallo R, Posada D (2012) jModelTest 2: more models, new heuristics and parallel computing. Nature Methods 9: 772 10.1038/nmeth.2109 [DOI] [PMC free article] [PubMed] [Google Scholar]
- 71. Shimodaira H, Hasegawa M (1999) Multiple comparisons of log-likelihoods with applications to phylogenetic inference. Mol Biol Evol 16: 1114–1116. [Google Scholar]
- 72. Deschavanne PJ, Giron A, Vilain J, Fagot G, Fertil B (1999) Genomic signature: characterization and classification of species assessed by chaos game representation of sequences. Mol Biol Evol. 16: 1391–1399. 10.1093/oxfordjournals.molbev.a026048 [DOI] [PubMed] [Google Scholar]
- 73. Dufraigne C, Fertil B, Lespinats S, Giron A, Deschavanne P (2005) Detection and characterization of horizontal transfers in prokaryotes using genomic signature. Nucleic Acids Res 33:e6 10.1093/nar/gni004 [DOI] [PMC free article] [PubMed] [Google Scholar]
- 74. Becq J, Churlaud C, Deschavanne P (2010) A benchmark of parametric methods for horizontal transfers detection. PLoS One 5:e9989 10.1371/journal.pone.0009989 [DOI] [PMC free article] [PubMed] [Google Scholar]
Associated Data
This section collects any data citations, data availability statements, or supplementary materials included in this article.
Supplementary Materials
In the case of endosymbionts of insects, the corresponding host species is also indicated between brackets.
(DOCX)
(DOCX)
(XLS)
Support values >70% for the bootstrap analysis by maximum likelihood are given. The tree was rooted with the alphaproteobacterial species Azospirillum sp. B510.
(EPS)
The regions at the corners of the triangles correspond to the three possible tree topologies for a quartet; the lateral regions to partly resolved trees and the central region to unresolved trees. The numbers indicate the percentage of quartets falling in each region.
(EPS)
The tree was rooted with the alphaproteobacterial species Azospirillum sp. B510. Support values >70% for the bootstrap analysis by maximum likelihood are given.
(EPS)
The tree was rooted with the alphaproteobacterial species Azospirillum sp. B510. Support values >70% for the bootstrap analysis by maximum likelihood are given.
(EPS)
The tree was rooted with the alphaproteobacterial species Azospirillum sp. B510. Support values >70% for the bootstrap analysis by maximum likelihood are given.
(EPS)
The tree was rooted with the alphaproteobacterial species Azospirillum sp. B510. Support values >70% for the bootstrap analysis by maximum likelihood are given.
(EPS)
The tree was rooted with the alphaproteobacterial species Azospirillum sp. B510. Support values >70% for the bootstrap analysis by maximum likelihood are given.
(EPS)
The regions at the corners of the triangles correspond to the three possible tree topologies for a quartet; the lateral regions to partly resolved trees and the central region to unresolved trees. The numbers indicate the percentage of quartets falling in each region.
(EPS)
The tree is midpoint rooted. Support values >70% for the bootstrap analysis by maximum likelihood are given.
(EPS)
The tree is midpoint rooted. Support values >70% for the bootstrap analysis by maximum likelihood are given.
(EPS)
The tree is midpoint rooted. Support values >70% for the bootstrap analysis by maximum likelihood are given.
(EPS)
The tree is midpoint rooted. Support values >70% for the bootstrap analysis by maximum likelihood are given.
(EPS)
The tree is midpoint rooted. Support values >70% for the bootstrap analysis by maximum likelihood are given.
(EPS)
Support values >70% for the bootstrap analysis by maximum likelihood are given. The tree was midpoint rooted.
(EPS)
Data Availability Statement
All relevant data are within the paper and its Supporting Information files.


