Macrophages have an important role in the maintenance of tissue homeostasis1. To perform this function, macrophages must have the capacity to monitor the functional states of their ‘client cells’: namely, the parenchymal cells in the various tissues in which macrophages reside. Tumours exhibit many features of abnormally developed organs, including tissue architecture and cellular composition2. Similarly to macrophages in normal tissues and organs, macrophages in tumours (tumour-associated macrophages) perform some key homeostatic functions that allow tumour maintenance and growth3–5. However, the signals involved in communication between tumours and macrophages are poorly defined. Here we show that lactic acid produced by tumour cells, as a by-product of aerobic or anaerobic glycolysis, has a critical function in signalling, through inducing the expression of vascular endothelial growth factor and the M2-like polarization of tumour-associated macrophages. Furthermore, we demonstrate that this effect of lactic acid is mediated by hypoxia-inducible factor 1a (HIF1a). Finally, we show that the lactate-induced expression of arginase 1 by macrophages has an important role in tumour growth. Collectively, these findings identify a mechanism of communication between macrophages and their client cells, including tumour cells. This communication most probably evolved to promote homeostasis in normal tissues but can also be engaged in tumours to promote their growth.
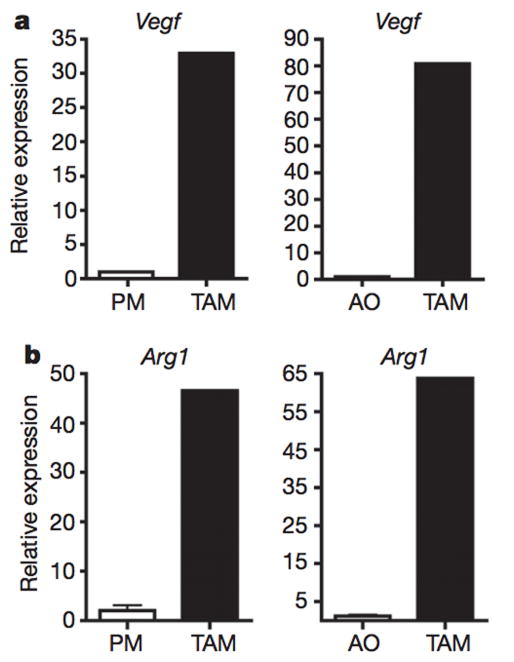
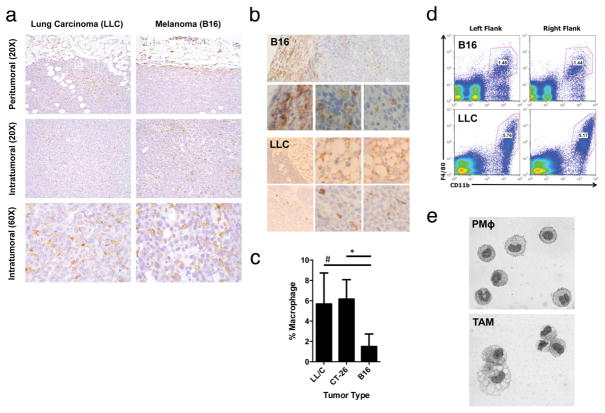
To study tumour–macrophage interactions, we used syngeneic murine tumour models of Lewis lung carcinoma (LLC) and B16-F1 (B16) melanoma cancer cell lines. LLC and B16 cells were subcutaneously injected into C57BL/6J mice. At day 19, the tumours were harvested and analysed for the presence of macrophages. Histological analysis showed that, in both LLC and B16 tumours, F4/801 macrophages and CD11b1 macrophages were present at a high density in the tumour periphery, as well as in cords and clusters throughout the interior of the tumours (Extended Data Fig. 1a, b). Fluorescence-activated cell sorting (FACS) analysis showed that the F4/801CD11b1 macrophages constituted between 1% and 6% of all cells within the tumours. Although the extent of macrophage recruitment varied between the tumour types, it remained constant for tumours of each type (Extended Data Fig. 1c, d). The sorted tumour-associated macrophages (TAMs) were vacuolated or foamy in appearance and thus morphologically distinct from peritoneal macrophages (Extended Data Fig. 1e). The TAMs expressed high levels of vascular endothelial growth factor (Vegf; also known as Vegfa) and arginase 1 (Arg1) messenger RNA compared with peritoneal macrophages (Fig. 1a, b), and they expressed more Vegf and Arg1 mRNA than all of the other cells within the tumour combined. Thus, consistent with the current thinking5, tumour cells recruit macrophages and induce their functional polarization into TAMs.
Figure 1. TAMs express high levels of Vegf and Arg1 mRNA.
a, b, Expression analysis by quantitative PCR (qPCR) of Vegf and Arg1 mRNA in FACS-sorted peritoneal macrophages (PM), TAMs and all other cells (AO) within the tumour from day 19 LLC tumours. Expression is shown relative to the left histogram bar.
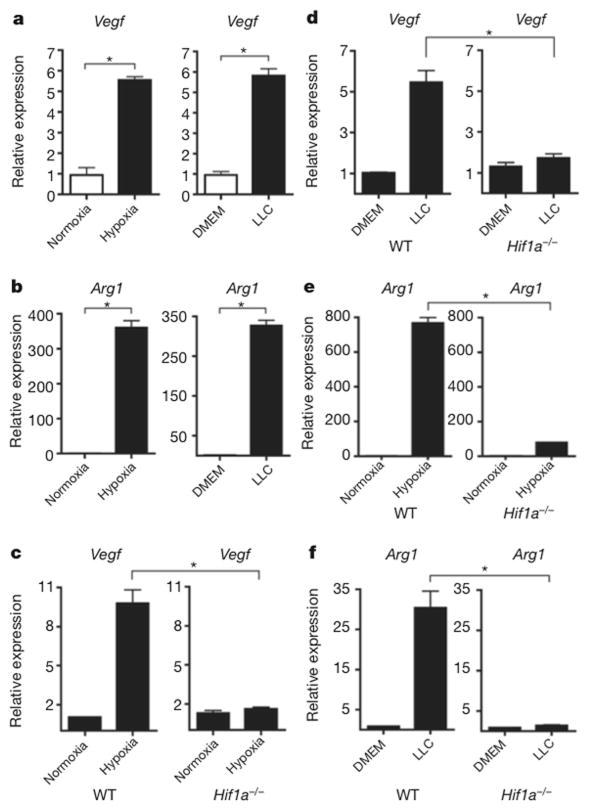
We hypothesized that tumour-derived signals activate macrophages to reach a tumour-promoting state that is characterized by the expression of Arg1 and Vegf. The upregulation of Vegf and Arg1 in macrophages might support tumour growth by inducing neovascularization and by providing the substrates for cancer cell proliferation, respectively5,6. Therefore, we used Vegf and Arg1 mRNA as read-outs to study the signals that tumours produce that promote the functional polarization of TAMs. The expression of Vegf has been characterized best in the context of hypoxia7, whereas Arg1 expression in macrophages has been best characterized in response to the T-helper-2-derived cytokines interleukin 4 (IL-4) and IL-13 (ref. 8). First, we tested whether Vegf and Arg1 induction in macrophages is mediated by a secreted tumour-derived signal. We incubated bone-marrow-derived macrophages with LLC-tumour-conditioned medium and measured Vegf and Arg1 expression in the macrophages. Tumour conditioned media induced both Vegf and Arg1 expression in bone-marrow derived macrophages under normoxic conditions (Fig. 2a, b).
Figure 2. A soluble factor in tumour-conditioned medium induces Vegf and Arg1 via HIF1α.
a, b, Expression analysis by qPCR of Vegf (a) and Arg1 (b) mRNA in bone-marrow-derived macrophages grown under conditions of normoxia (20% O2) or hypoxia (0.1% O2) (left panels) or stimulated with control medium (DMEM) or LLC-tumour-conditioned medium (right panels). c–f, Expression analysis by qPCR of Vegf (c, d) and Arg1 (e, f) mRNA in wild-type (WT) and Hif1a−/− bone-marrow-derived macrophages stimulated with LLC-tumour-conditioned medium (d, f) or hypoxia (0.1% O2) (c, e). The histogram bars represent the expression level of three biological replicates (relative to the left histogram bar), displayed as mean ± s.e.m. *P < 0.01, using a two-tailed, unpaired t-test. All experiments were performed at least twice.
Vegf expression is induced by ischaemia, during which the loss of both oxygen and nutrients can induce Vegf through different pathways: hypoxia induces Vegf expression via the transcription factor HIF1a, while nutrient deprivation induces Vegf expression through the transcriptional co-activator PGC1a (peroxisome-proliferator-activated receptor c, coactivator 1a)9. We found that a tumour-derived signal(s) induces Vegf expression in macrophages under normoxic conditions by the same pathway through which hypoxia induces Vegf expression: that is, stabilization of HIF1a. Macrophages stimulated by tumour-conditioned media had stabilized HIF1a protein under normoxic conditions (Extended Data Fig. 2a). Furthermore, using luciferase reporter assays that determined both the stability of the HIF1a protein’s oxygen-dependent domain and the activity of the Vegf promoter, we found that tumour-conditioned media stabilized HIF1a and induced the Vegf promoter under normoxic conditions to a level similar to that induced by hypoxia (Extended Data Fig. 2b, c). In addition to HIF1a protein stabilization, tumour-conditioned media induced the expression of the inducible isoform of the HIF1A gene (HIF1A I.1) but not the constitutive isoform (HIF1A I.2). Neither the Pgc1a nor Pgc1b co-activator, which are associated with the induction of Vegf during nutrient deprivation, was induced by tumour-conditioned media (Extended Data Fig. 2d, e). To determine whether HIF1a is critical for tumour-induced upregulation of Vegf and Arg1 expression, we used Hif1a fl/fl X Lysm cre/wt mice, in which HIF1a is specifically deleted in myeloid cells. In the resultant Hif1a−/− macrophages, neither Vegf nor Arg1 was induced by either hypoxia or tumour-conditioned media (Fig. 2c–f). Together, these findings indicate that a tumour-derived soluble factor(s) induce Vegf and Arg1 in macrophages via HIF1a under normoxic conditions.
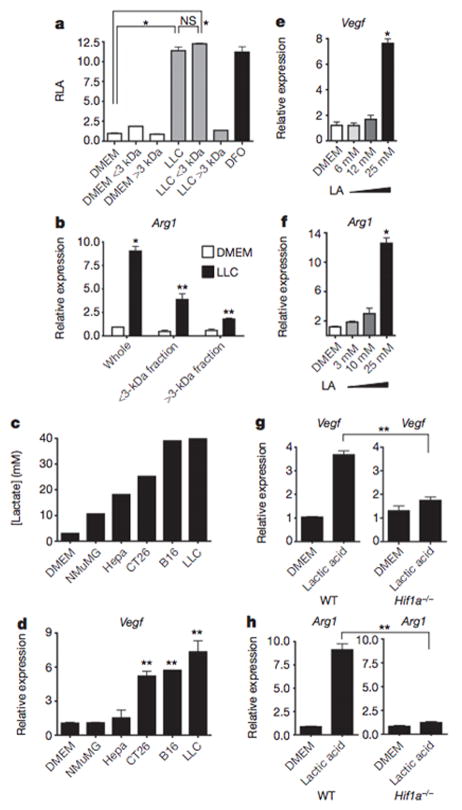
After determining that the tumours induced Vegf and Arg1 expression via HIF1a, we next sought to identify the tumour-derived soluble factor capable of activating HIF1a under normoxic conditions. The tumour conditioned medium was fractionated by size (<3 kDa and >3 kDa), and the activity of both fractions was tested. Both unfractionated tumour conditioned medium and the <3 kDa fraction stabilized HIF1a and upregulated Arg1 expression (Fig. 3a and Extended Data Fig. 2f); the >3 kDa fraction had none of these effects. Furthermore, the <3 kDa fraction strongly upregulated Arg1 and Vegf expression (Fig. 3b and Extended Data Fig. 2g). Its activity was also heat stable: that is, it induced Arg1 and Vegf after prolonged boiling (Extended Data Fig. 2h).
Figure 3. Lactic acid is sufficient to induce Vegf and Arg1 via HIF1α.
a, b, Control (DMEM) or LLC-tumour-conditioned medium was used unfractionated (whole) or as <3-kDa or >3-kDa fractions to stimulate cells as follows. A luciferase reporter assay of 293T cells transfected with HIF1α oxygen-dependent domain (ODD)-luciferase was carried out to measure protein stabilization of the ODD; deferoxamine (DFO) was used as a hypoxia mimetic (a). Expression analysis by qPCR of Arg1 mRNA in bone-marrow-derived macrophages (b). c, Lactic acid concentration in the tumour-conditioned media from five tumour cell lines, collected after culturing at confluence for 4 days. d, Expression analysis by qPCR of Vegf mRNA in bone-marrow-derived macrophages stimulated with the tumour-conditioned media in c. e, f, Expression analysis by qPCR of Vegf (e) and Arg1 (f) mRNA in bone-marrow-derived macrophages cultured with a concentration gradient of lactic acid (LA). g, h, Expression analysis by qPCR of Vegf and Arg1 mRNA in wild-type (WT) and Hif1a−/− bone-marrow-derived macrophages. b–h, The histogram bars represent the expression level of three biological replicates (relative to expression in DMEM), displayed as mean ± s.e.m. *P < 0.0001; **P < 0.001, using a two-tailed, unpaired t-test. All experiments were performed at least twice. NS, not significant; RLA, relative luciferase activity.
At least four soluble factors of <3 kDa are known to stabilize HIF1a under normoxic conditions: adenosine, acidic pH, pyruvate and lactate10–12. Acidic pH was not able to stabilize HIF1a in macrophages under normoxic conditions, and an inhibitor of adenosine did not abrogate the induction of Vegf by tumour-conditioned medium (Extended Data Fig. 2i,j). We therefore focused on the possibility that tumour-derived lactate is the soluble factor responsible for the polarization of TAMs. Warburg observed that cancer cells preferentially perform aerobic glycolysis: that is, they convert most glucose molecules into lactate regardless of the amount of oxygen present13. Furthermore, the eponymous Warburg effect is also observed in most cells undergoing rapid proliferation14. It has been hypothesized that aerobic glycolysis is conducive to cell proliferation because, despite the consequent reduction in ATP production, aerobic glycolysis produces metabolic precursors, such as lactate, for biosynthetic pathways, and these precursors may be the limiting factor during rapid cell proliferation14.
One of the key enzymes involved in aerobic glycolysisis pyruvate kinase, which catalyses the production of pyruvate from its precursor during glycolysis. Specifically, the M2 isoform—but not the M1 isoform—of pyruvate kinase is preferentially active during aerobic glycolysis15. When cells expressing the M2 isoform were compared with cells expressing the M1 isoform for differences in the intracellular metabolites that they produced, the levels of lactate and pyruvate produced proved to be the most different. We investigated the differential expression of the M1 (Pkm1) and M2 (Pkm2) isoforms in different tumour cell lines and normal tissues. As expected, whereas PKM1 was the predominant isoform in differentiated tissues, particularly in metabolically active brown adipose tissue, muscle and heart, Pkm2 was the predominant isoform in a variety of tumour cell lines (Extended Data Fig. 3a–c).
We next measured the levels of lactic acid in the media from a variety of tumour cell lines. Interestingly, LLC and B16 cells—the most malignant tumour lines tested—yielded the highest concentrations of lactate (Fig. 3c), suggesting that the Pkm2 expression level and the subsequent lactate production correlate with tumour malignancy. When macrophages were then stimulated with these tumour-conditioned media, the magnitude of Vegf induction correlated with the amount of lactate that accumulated in the media (Fig. 3d).
When the tumour-conditioned media were fractionated, the vast majority of the lactate partitioned into the <3 kDa fraction (Extended Data Fig. 3d). Furthermore, lactic acid alone was sufficient to induce Vegf and Arg1 expression in macrophages in a dose-dependent manner (Fig. 3e, f). Using mass spectroscopy for quantitation, we determined that the in vivo intratumoral lactate levels were equivalent to the lactate concentrations required for in vitro induction of Vegf and Arg1 (Extended Data Fig. 3e). When macrophages were stimulated with either lactic acid or hypoxia (0.1% O2), the induction of Vegf expression peaked at 6 h post stimulation, whereas Arg1 induction peaked at 24 h post stimulation (Extended Data Figs 4 and 5). The cellular uptake of lactic acid, mediated by monocarboxylate transporters (MCT1, MCT2, MCT3 and MCT4), is necessary for the induction of Vegf, as indicated by the abrogation of Vegf induction in macrophages by LLC-conditioned media after exposure to a-cyano-4-hydroxycinnamate, an MCT inhibitor (Extended Data Fig. 6a). Furthermore, as monocarboxylate transporters are proton-coupled symporters, the induction of Vegf by lactate was dependent on an acidic pH (Extended Data Fig. 6b). Although lactic acid was sufficient to induce Vegf in LLC and B16 tumour cells (Extended Data Fig. 6c), the relative levels of expression observed in vivo are greatest in TAMs (Fig. 1a).
Finally, similarly to the induction of Vegf and Arg1 by hypoxia, the induction of these genes by tumour-conditioned media and lactic acid was also dependent on HIF1a, as HIF1a-deficient macrophages were not able to upregulate Vegf or Arg1 on stimulation with lactic acid (Fig. 3g, h). Collectively, these findings suggest a model in which macrophages are recruited to the tumour micro-environment, where tumour-derived lactic acid induces HIF1a-dependent polarization of macrophages, including the induction of Vegf and Arg1.
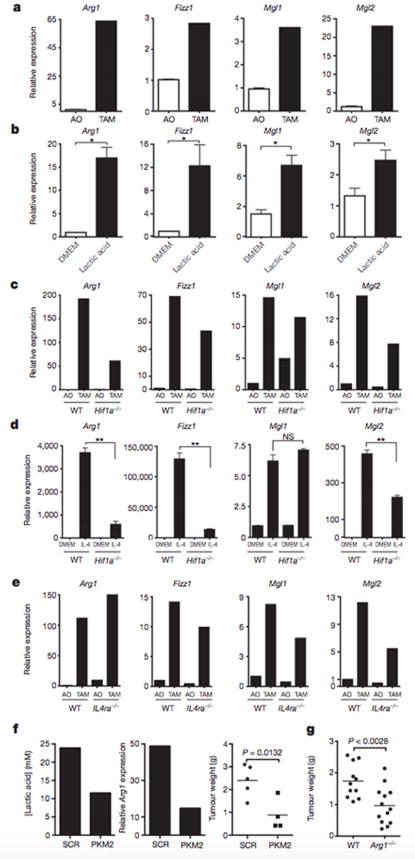
To determine whether lactic acid can induce an M2-like phenotype in TAMs, FACS sorting of F4/80+CD11b+ macrophages was performed on syngeneic LLC tumours at day 19 after injection. Gene expression analysis revealed that these TAMs have an M2-like profile, with the expression of Fizz1, Mgl1 and Mgl2 at levels higher than in all other tumour cells combined (Fig. 4a). Compared with F4/80+CD11b+ FACS sorted peritoneal macrophages, TAMs express higher levels of the M2- associated genes Arg1 and Mrc1 but not higher levels of Ym1, Mgl1, Mgl2 or Fizz1 (Extended Data Fig. 7). Since lactic acid is sufficient to induce Arg1 in macrophages, we asked whether the expression of other M2 markers is induced by lactic acid. We found that lactic acid was sufficient to induce the M2 markers Fizz1, Mgl1 and Mgl2 in bone-marrow derived macrophages (Fig. 4b and Extended Data Fig. 8a). Given that HIF1a is required for the induction of Arg1 by lactic acid in vitro, we asked whether HIF1a is required for the induction of other M2 markers in vivo. TAMs from LLC tumours injected into wild-type mice and mice with HIF1a-deficient macrophages were sorted by FACS, and their expression of M2 markers was compared. Arg1, Fizz1, Mgl1 and Mgl2 were all expressed at lower levels in TAMs from mice with HIF1a-deficient macrophages than from wild-type mice (Fig. 4c and Extended Data Fig. 8b).
Figure 4. Lactic acid polarizes macrophages to an M2-Iike state that is critical for tumour growth.
a–e, Expression analysis by qPCR of Arg1, Fizz1, Mgl1 and Mgl2 mRNA in the following cell types: TAMs and all other tumour cells (AO) from LLC tumours resected from wild-type (WT, C57BL/6J) mice (a), bone-marrow-derived macrophages stimulated with 25 mM lactic acid (LA) (b), TAMs and AO from LLC tumours resected from mice with either WT or Hif1a−/− macrophages (c), WT or Hif1a−/− bone-marrow-derived macrophages stimulated with control medium (DMEM) or IL-4 (10 ng ml−1) (d), and TAMs and AO from CT26 colon carcinoma tumours resected from mice with WT (BALB/c) or Il4ra−/− macrophages (e). f, Intratumoral lactic acid concentrations (mM) from tumours of LLC cells that had been stably transfected with a scrambled short hairpin RNA (shRNA) construct (SCR) or an shRNA targeting Pkm2 (centre panel). Expression analysis by qPCR of Arg1 mRNA in TAMs isolated from SCR-transfected and Pkm2-knockdown tumours. Weight of LLC tumours from cells bearing an SCR construct (mean ± s.e.m., 2.402 ± 0.310 g; n = 5) or Pkm2 shRNA construct (mean ± s.e.m, 0.8820 ± 0.341 g; n = 4); P = 0.0132 using a two-tailed, unpaired t-test (right panel). The F test revealed no significant difference in variance between the compared groups. g, Weight of LLC tumours resected on day 19 from mice with WT macrophages (mean ± s.e.m., 1.74 ± 0.161 g; n = 11) or ARG1-deficient macrophages (mean ± s.e.m., 0.965 ± 0.163 g; n = 13); P < 0.0028 using a two-tailed, unpaired t-test. The F test revealed no significant difference in variance between the compared groups. a–f, The histogram bars represent the expression level of three biological replicates, displayed as mean ± s.e.m., relative to AO (a, c, e, f) or DMEM (b, d). *P < 0.05; **P < 0.001, using a two-tailed, unpaired t-test. All experiments were performed at least twice. NS, not significant.
IL-4 and IL-13 are the best-characterized inducers of M2 polarization of macrophages8, but the downstream steps involved in M2 polarization are poorly defined16. To determine whether HIF1a is required for IL-4-induced M2 polarization, macrophages from HIF1a-deficient and wild-type mice were stimulated with IL-4, and their gene expression was compared. The induction of Arg1, Fizz1 and Mgl2 was significantly impaired in HIF1a-deficient macrophages compared with wild-type macrophages (Fig. 4d). By contrast, the induction of Mgl1 was intact, suggesting that HIF1a is required for a subset of M2-associated genes, whether stimulated by lactic acid, hypoxia or IL-4. To determine whether IL-4 and IL-13 signalling is required for the M2 polarization of LLC TAMs in vivo, we isolated TAMs from mice deficient in the IL-4 receptor a-chain (IL-4Ra), a component of the receptors for both IL-4 and IL-13, and compared their gene expression with that of TAMs from wild-type mice. The levels of Arg1 mRNA were higher in TAMs from IL-4Ra-deficient mice than from wild-type mice, and the other M2 markers were present at only moderately lower levels than in wild-type mice. Therefore, IL-4 and IL-13 signalling are not critical for the TAM M2-like phenotype in this model (Fig. 4e). Together, these findings suggest that there is an alternative pathway to an M2-like state that does not require IL-4 and IL-13 but is instead mediated by HIF1a. In addition, these results demonstrate that the induction of at least some M2-associated genes by IL-4 is dependent on HIF1a.
To determine whether lactic acid is driving macrophage polarization in vivo, we generated stable LLC tumour cell lines in which Pkm2 was knocked down and then injected these cells subcutaneously into wild-type mice. The Pkm2-knockdown tumours had a lower in vivo concentration of lactic acid than tumours bearing scrambled constructs. Furthermore, TAMs isolated from the Pkm2-knockdown tumours contained approximately half of the amount of Arg1 mRNA, and the tumours were significantly smaller (Fig. 4f). Although interpretation of this result is complicated by the probable cell-intrinsic effect of Pkm2 knockdown, this finding is at least consistent with the model in which PKM2-dependent lactic acid production by tumour cells has an important role in TAM polarization. As a converse correlate to these experiments, to determine whether lactic acid stimulation of bone-marrow-derived macrophages ex vivo confers a growth advantage on LLC tumours, we compared the tumour volumes in mice co-injected with LLC cells plus control-medium stimulated bone-marrow-derived macrophages and in mice co-injected with LLC cells plus lactic-acid-stimulated bone-marrow-derived macrophages. Co-injection of the lactic-acid-stimulated bone-marrow-derived macrophages resulted in significantly larger tumours than did co-injection of the control-medium-stimulated bone-marrow-derived macrophages (Extended Data Fig. 9a). To determine whether lactic acid is used as a metabolic substrate, as well as a polarizing signal, in TAMs, we measured the oxidation of 14C-lactic acid. TAMs oxidized more 14C-lactic acid to 14CO2 than either bone-marrow-derived macrophages or cultured LLC cells (Extended Data Fig. 9b), suggesting that TAM polarization allows increased utilization of lactic acid.
The role of VEGF in promoting neovascularization and subsequent growth of tumours is well established17. However, the role of macrophage derived ARG1 is unclear, despite being part of the signature of the TAM phenotype. ARG1 is known to be involved in a pathway that generates polyamines, which are essential metabolites during cell division and have been shown to regulate tumour cell proliferation in vitro6. ARG1 is also one of five urea cycle enzymes that is important in nitrogen metabolism. Therefore, we sought to determine whether macrophage-derived ARG1 is involved in tumour progression by using a syngeneic tumour model in Arg1fl/fl X Lysmcre/wt mice, whose macrophages are deficient in ARG1. Tumours from ARG1-deficient mice were approximately half the size of those from wild-type mice, indicating that macrophage-derived ARG1 has an important role in tumour progression (Fig. 4g and Extended Data Fig. 9c, d).
Together, these findings demonstrate that lactate, a by-product of glycolysis, induces TAM polarization characterized by the induction of Vegf expression and differentiation into an M2-like phenotype. Pioneering studies by Folkman demonstrated the crucial role of neovascularization in tumour growth18. It has generally been assumed that cancer cells experiencing hypoxia in a growing tumour are themselves the source of VEGF. However, our findings suggest that, at least in some cases, it is the tumour accessory cells, including macrophages, that are the main source of VEGF. It should be noted that the elimination of one source of VEGF will probably result in compensatory VEGF production by alternative cellular sources5. Further studies will be necessary to elucidate the specific tumour features that dictate the primary source of VEGF. ARG1 is widely accepted as a marker of M2 macrophages, but the functional role of ARG1 in M2 macrophages has been determined only in the context of helminth infection19. Our findings suggest that Arg1 expression in TAMs has an important role in tumour growth, possibly via an ARG1-dependent pathway responsible for producing polyamines, which are substrates that have a critical role in cell proliferation. In addition, TAMs may contribute to nitrogen metabolism in the tumour microenvironment, as all five enzymes of the urea cycle are expressed at higher levels in TAMs than in all other tumour cells (Extended Data Fig. 10). TAMs also express higher levels of the transaminase Gpt and of glutamine synthetase (Glul), which also facilitate nitrogen metabolism, than all other tumour cells.
We observed that the effect of lactate on tumour cell proliferation is mediated by HIF1a and, interestingly, is independent of IL-4Ra signalling. However, in other tumour models, IL-4 produced by T helper2 cells has an important role in the M2 polarization of TAMs20. Thus, multiple pathways for the induction of the M2 phenotype in TAMs probably exist, and further investigation is necessary to characterize the features of tumour cells or their tissue environment that dictate the induction of the M2 phenotype.
In conclusion, we found that tumour-cell-derived lactic acid has an important signalling role in the induction of several key features of TAM polarization and the subsequent promotion of tumour growth. Lactic acid, as a by-product of aerobic glycolysis, can be a ‘reporter’ of cell proliferation. Lactic acid is also a by-product of anaerobic glycolysis, which in metazoan cells is typically indicative of hypoxia. These features of lactic acid may explain its ability to induce Vegf, Arg1 and other M2-associated genes in TAMs. Finally, we expect that multiple signals are involved in the communication between tumour cells and macrophages. Indeed, recent findings demonstrate the important role of tumour-cell-derived versican21 and macrophage colony-stimulating factor22 in tumour–macrophage communication. These and other, yet to be discovered, signals involved in macrophage polarization are presumably not specific to tumours. That is, as tumours represent an abnormal and exaggerated version of normal tissue growth, the role of TAMs reflects the role of macrophages in normal tissue maintenance and repair.
METHODS SUMMARY
Syngeneic tumour model
LLC (LL/2), B16-F1 melanoma or CT.26WT colon carcinoma cells were injected subcutaneously into the flanks of mice (13 106, in 200 ml PBS). Both male and female C57BL/6J (LLC and B16) and BALB/c (CT26) strains of mice (Jackson Laboratory) were used. Mice were 6 to 8 weeks of age. The resultant tumours were resected and transferred to PBS on ice. Tumour weight (g) was measured on a scale after transferring the specimen to a sterile Petri dish. The tumours from all experiments were then processed for FACS analysis or sorting (see Methods) on the same day or fixed in formalin for immunohistochemistry.
Tumour supernatant preparation and collection
Cell lines were grown in DMEM plus supplements (DMEM-complete; containing 10% FBS, 1% penicillin and streptomycin, 1% HEPES, 1% L-glutamine and 1% sodium pyruvate). Fractionation of LLC tumour supernatants was achieved using Amicon Ultra centrifugal filters (3K Ultracel, Millipore). The supernatant fraction >3 kDa remained above the filter, and the fraction <3 kDa passed through to the lower chamber. The >3-kDa fraction was resuspended in unsupplemented DMEM to the pre-filtration volume.
Determination of lactate concentration
The lactate concentration was measured using a Lactate Assay Kit (BioVision) according to the manufacturer’s instructions. The mean values and s.e.m. of the lactate concentration were calculated for each condition. The mean intratumoral lactic acid concentration was determined for LLC and B16 tumours after homogenization (Polytron) and methanol extraction, using hydrophilic interaction chromatography and mass spectroscopy, as well as the colorimetric lactate assay.
METHODS
Materials
The anti-ARG1 antibody for western blotting was purchased from BD Transduction Laboratories (catalogue number, 610708). Rabbit anti-HIF-1a antibody was purchased from Novus Biologicals (catalogue number, NB100-449; lot A4). Anti-CD31 antibody for immunohistochemistry was purchased from Abcam (catalogue number, ab28364). Liberase TM Research Grade was purchased from Roche. ACK lysing buffer was purchased from BioWhittaker (Lonza). RLT buffer (lysis buffer) was purchased from QIAGEN (mat. no. 1015762). The Lactate Assay Kit was purchased from BioVision (catalogue number, K607-100). The SMARTer PCR cDNA Synthesis Kit was purchased from Clontech. PerfeCTa SYBR Green SuperMix was purchased from Quanta BioSciences (Lot 14699). RNA Bee was purchased from amsbio. Lactic acid was purchased from Sigma ($98% purity; catalogue number, L6402-1G). DNase I was purchased from Sigma. The HIF1a reporter was obtained from Add gene (plasmid 18965, ODD-Luciferase-pcDNA3).
Primers
The following primers were used to determine the relative gene expression using quantitative PCR (qPCR). Actb: FP, 5′-GGTCCACACCCGCCACCAG-3′; RP, 5′-CACATGCCGGAGCCGTTGTC-3′. Arg1: FP, 5′-CCACAGTCTGGCAGTTGGAAG-3′; RP, 5′-GGTTGTCAGGGGAGTGTTGATG-3′. Asl: FP, 5′-GGGAAGCTACACACAGGACG-3′; RP, 5′-GCTGAGCTCTCTGCAAGTGT-3′. Ass1: FP, 5′-GCCAAGTGTACATCCTCGGT-3′; RP, 5′-GACCTTGCTCTGAAGGCGAT-3′. Cd11c: FP, 5′-GGATAGCCTTTCTTCTGCTGT-3′; RP, 5′-TGTAGAGGCCACCTATTTGGTT-3′. Cps1: FP, 5′-CGGGAAGTAGAGATGGACGC-3′; RP, 5′-CCTTGGCTGATGGTCTGTGT-3′. Fizz1: FP, 5′-CCTGCTGGGATGACTGCTA-3′; RP, 5′-TGGGTTCTCCACCTCTTCAT-3′. Glul: FP, 5′-CCTTCCGCAAAGACCCCA-3′; RP, 5′-CATTCCAAACCAGGGGTGCT-3′. Gpt: FP, 5′-CTCTAAGGGCTACATGGGCG-3′; RP, 5′-ACCTGCTCCGTGAGTTTAGC-3′. Hif1 I.1: FP, 5′-AATACATTTTCTCTGCCAGTTTTCTG-3′; RP, 5′-TTGCTGCATCTCTAGACTTTTCTTTT-3′. Hif1a I.2: FP, 5′-CACCGATTCGCCATGGA-3′; RP: 5′-TTTCTTTTCGACGTTCAGAACTCAT-3′. Mgl1: FP, 5′-CAGAATCGCTT AGCCAATGTGG-3′; RP, 5′-TCCCAGTCCGTGTCCGAAC-3′. Mgl2: FP, 5′-TTCAAGAATTGGAGGCCACT-3′; RP, 5′-CAGACATCGTCATTCCAACG-3′. MHC II: FP, 5′-TTTGCTTTCTGAAGGGGGCA-3′; RP, 5′-TCGCCCATGAACTGGTACAC-3′. Mrc1: FP, 5′-AAGGCTATCCTGGTGGAAGAA-3′; RP, 5′-AGGGAAGGGTCAGTCTGTGTT-3′. Otc: FP, 5′-GCTAGCAGAGCAGTATGCCA-3′; RP, 5′-ATACATTGCCTCCACGTGCT-3′. Pkm1: FP, 5′-ATTACCAGCGACCCCACAG-3′; RP, 5′-TAGAAGAGGGGCTCCAGAGG-3′. Pkm2: FP, 5′-AGGATGCCGTGCTGAATG-3′; RP, 5′-TAGAAGAGGGGCTCCAGAGG-3′. Rpl13a: FP, 5′-GAGGTCGGGTGGAAGTACCA-3′; RP, 5′-TGCATCTTGGCCTTTTCCTT-3′. Vegfa: FP, 5′-CCACGACAGAAGGAGAGCAGAAGTCC-3′; RP, 5′-CGTTACAGCAGCCTGCACAGCG-3′. Ym1: FP, 5′-GCCACTGAGGTCTGGGA TGC-3′; RP, 5′-TCCTTGAGCCACTGAGCCTTC-3′.
Short hairpin RNA constructs
The following short hairpin RNA (shRNA) constructs, cloned into the pGFP-V-RS plasmid, were obtained from OriGene and used for transfection: TR30013 (scrambled control used in Fig. 4f), 5′-GCACTACCAGAGCTAACTCAGATAGTACT-3′; HT122914B (Pkm2 knockdown 1 used in Fig. 4f), 5′-GCCTCCTTCAAGTGCTGCA-3′; and HT122915A (Pkm2 knockdown 2), 5′-CAGCTATTCGAGGAACTCC-3′.
Mice
Lysmcre/wt and Arg1fl/fl mice were purchased from the Jackson Laboratory and bred in our facility. C57BL/6J and BALB/c mice were purchased from the National Cancer Institute. Macrophage-specific ARG1-deficient mice were generated by crossing Lysmcre/wt and Arg1fl/fl mice. Lysmwt/wt X Arg1fl/fl mice were used as controls. All mice used were on a C57BL/6J background. Hif1afl/fl mice were purchased from the Jackson Laboratory. Macrophage-specific HIF1a-deficient mice were created by crossing Lysmcre/wt and Hif1afl/fl mice. Lysmwt/wt X Hif1afl/fl mice were used as controls. Il4ra−/− mice were provided by K. Bottomly. All animal experiments were performed in accordance with the guidelines of Yale University’s Institutional Animal Care and Use Committee.
Syngeneic tumour model
LLC, B16-F1 melanoma (B16) or CT.26WT colon carcinoma (CT26) cells (1 × 10⁶, in 200 ml PBS) were injected subcutaneously into the flanks of mice. Both male and female C57BL/6J (LLC and B16) and BALB/c (CT26) strains of mice were used. Mice were 6 to 8 weeks of age. There was no systematic means of randomization of mice. Three-digit codes identified the mice, and the experiment was carried out blindly throughout. The mice were killed on day 19. Tumours were resected and transferred to 5 ml PBS on ice. Tumour weight (g) was measured on a scale by transferring the specimen to a sterile Petri dish after removal of surface moisture with Kimwipes. The tumours from all experiments were then processed for FACS analysis or sorting on the same day or fixed in formalin for immunohistochemistry. For co-injection experiments, 1 × 10⁶ bone-marrow-derived macrophages (BMDMs) were plated in 1 ml macrophage-growth medium (MGM) in 12-well non-tissue culture plates and stimulated with 1 ml 50 mM lactic acid in DMEM (final concentration, 25 mM lactic acid) or unsupplemented DMEM for 24 h. LLC cells (1 × 10⁶) were combined with 1 × 10⁶ control or lactic-acid-stimulated BMDMs, resuspended in 200 ml PBS and co-injected subcutaneously. Mice that developed ulcers overlying the tumours were killed according to the guidelines of Yale University’s Institutional Animal Care and Use Committee protocol. There were no exclusion criteria for the tumours.
Preparation of single cell suspensions from tumours
The resected mouse tumours were mechanically dissociated with surgical scissors and digested with 2 U Liberase TM and DNase I in PBS for 30 min in a 37 °C shaking incubator (150 r.p.m.). After enzymatic dissociation, the samples were transferred to ice to stop the reaction. The tumour suspension was then strained using a 70 mm cell strainer (Becton Dickinson) and washed with FACS buffer (0.5% FBS in PBS) and centrifuged at 1,300 r.p.m. at 4 °C (similar centrifugation parameters were used throughout). Red blood cells were lysed with ACK lysing buffer followed by washing with FACS buffer. The samples were then resuspended in FACS buffer. The samples were kept on ice throughout the rest of the staining process.
FACS of TAMs
Anti-mouse CD16/32 antibody (eBioscience) was added to the samples at a 1:200 dilution for 20 min at 4 uC to block non-specific Fc receptor binding. Samples were then washed with FACS buffer and stained with anti-CD11b–PerCP antibody (eBioscience; clone, M1/70; catalogue number, 45-0112-82; used at 1:100) and anti-F4/80–APC antibody (eBioscience; clone, BM8; catalogue number, 17-4801-82; used at 1:100) at 4 °C for 15 min in the dark. The samples were then washed twice and resuspended in FACS buffer for sorting. The samples were sorted on a MoFlo cell sorter (Beckman Coulter) equipped with Summit software. Photomultiplier tube (PMT) voltages were set with the unstained tumour cell suspension, and compensations were performed with single colour controls. For sorting, live cells were initially selected on the basis of forward scatter (FSC) and side scatter (SSC), followed by gating on singlets to ensure that individual cells were obtained. Next, the CD11b–PerCP and F4/80–APC double-positive population was selected and sorted. Other cells, negative for CD11b and F4/80, were also sorted simultaneously. An aliquot of sorted cells was removed for preparation of a Cytospin. The sorted cells were kept on ice and immediately resuspended in RLT buffer. Samples were then stored at −80 °C for subsequent gene expression analysis.
Histological characterization of sorted TAMs
The cellular morphology of the Sorted macrophages was analysed by Cytospin followed by haematoxylin and eosin staining. After sorting TAMs, 100 ml single cell suspension was transferred to Cytospin funnels and centrifuged in a Cytospin Cytocentrifuge (Thermo Scientific) for 5 min at 800 r.p.m. The slides were then stained with a Diff-Quik kit (Baxter Merz & Dade). Haematoxylin and eosin stained slides of sorted cells were visualized with an Optiphot Nikon microscope with a camera.
Immunohistochemistry
Resected tumours were fixed in formalin, embedded in paraffin, sectioned and stained with haematoxylin and eosin. Immunohistochemistry with an anti-F4/80 antibody (eBioscience, clone BM8) and an anti-CD11b antibody (eBioscience, clone M1/70) was performed by the Yale Dermatopathology Laboratory.
Tumour supernatant preparation and collection
Conditioned media (tumour supernatants)from the following American Type Culture Collection cell lines were prepared: B16, LLC (LL/2), CT-26 (CT26. WT, colon carcinoma), Hepa (Hepa 1-6, hepatoma) and NMuMG (normal murine mammary gland). All cell lines tested negative for Mycoplasma and Acholeplasma using the Venor GeM Mycoplasma Detection Kit (Sigma-Aldrich, catalogue number, MP0025). Each cell line was grown in DMEM-complete (containing 10% FBS, 1% penicillin and streptomycin, 1% HEPES, 1% L-glutamine and 1% sodium pyruvate) in 75 cm2 BD Falcon flasks at 37 °C. When the cells reached 70% confluence, the DMEM-complete medium was aspirated, and the cells were rinsed with 10 ml Dulbecco’s PBS (Sigma-Aldrich) and incubated with 3 ml 0.05% trypsin-EDTA (Gibco) for 5 min. To inhibit the trypsin reaction, DMEM-complete (7 ml) was added and mixed completely. Each cell suspension was counted with a haemocytometer and plated into three 25 cm2 BD Falcon flasks (63 106 cells in 9 ml medium). Supernatants were collected on days 1, 2, 3 and 4. Conditioned medium from each of the flasks was transferred to a 15 ml BD Falcon tube and centrifuged at 1,300 r.p.m. for 10 min. The supernatant was sterile filtered using a 22 mm filter (Millex-GV) with a 10 ml syringe barrel. The samples were stored at −20 °C for future experiments. Fractionation of the LLC tumour supernatants was achieved using Amicon Ultra centrifugal filters (3K Ultracel, Millipore). The supernatant was centrifuged at 4,000 r.p.m. for 1 h. The supernatant fraction that was >3 kDa remained above the filter and that which was <3 kDa passed through to the lower chamber. The >3-kDa fraction was resuspended in unsupplemented DMEM to the pre-filtration volume.
Determination of lactate concentration
Lactate concentration was measured using a Lactate Assay Kit (BioVision) as per the manufacturer’s instructions (catalogue number, K607-100). Conditioned tumour media (from NMuMG, Hepa, CT26, B16 and LLC cells) were diluted 1:400 with lactate assay buffer and prepared as quadruplicates for the colorimetric lactate assay. The absorbance was measured at 570 nm using a SpectraMax M5 microplate reader (Molecular Devices) immediately after sample preparation. Background absorbance was subtracted. The mean values for lactate concentration (mM) and the s.e.m. were calculated for each condition. The mean intratumoral lactic acid concentration was determined for the LLC and B16 tumours after homogenization (Polytron) and methanol extraction, using hydrophilic interaction chromatography and mass spectroscopy, as well as the colorimetric assay described above.
Isolation of BMDMs
To prepare BMDMs, mice were killed (CO2 gas for 60 s) and disinfected with 70% ethanol. A long midline abdominal incision was made, starting at the ventral abdomen and extending inferiorly to the coccyx. Additional vertical incisions were made on each leg, to separate the skin completely from the underlying muscle layer. Both lower extremities were excised, and the muscular layers were gently removed. The long bones, femur and tibia were then placed in RPMI medium (Sigma). To extract BMDMs, the long bones and medium were placed into a clean, dry mortar. The RPMI was then aspirated. The long bones were cleansed with ethanol for no more than 30 s, and the ethanol was removed by aspiration. The bones were then washed three times with RPMI. Fresh RPMI (10 ml) was added, and a mortar was used to pulverize the long bones. A 70 mm nylon BD Falcon cell strainer was placed atop a 50 ml BD Falcon tube, and the suspension was filtered into the 50 ml tube. To grind the long bones for a second time, RPMI (10 ml) was added to the mortar, and this suspension was filtered as before. This step was repeated for a third time. The resultant suspension was centrifuged at 1,200 r.p.m. for 5 min. The supernatant was then aspirated. ACK lysing buffer (2 ml) was then added, and the contents were incubated for 5 min at 21 °C. To stop the lysis reaction, 20 ml RPMI was added. The contents were then centrifuged. The supernatant was aspirated, and the resultant cell pellet was resuspended in 20 ml MGM. The cells were then plated at 3 × 10⁷ cells in 20 ml Falcon Petri dishes (150 mm3 15 mm). On day 4, 20 ml MGM was added.
Preparation of peritoneal macrophages
Peritoneal macrophages were harvested by peritoneal lavage. Cold PBS was injected into the peritoneal cavity and extracted after gentle agitation. The peritoneal cell suspension was centrifuged at 1,300 r.p.m., and the cell pellet was mixed with 2 ml ACK lysing buffer. After centrifugation, cells were then resuspended in DMEM-complete and used for further experiments.
In vitro stimulation of BMDMs and peritoneal macrophages
BMDMs were plated at 1 × 10⁶ cells per well in a sterile six-well tissue culture plate in 1 ml MGM. The BMDM stimulation experiments included the following conditions: DMEM complete (1 ml, negative control), 50mM lactic acid in DMEM-complete (1ml, 25mM final concentration), LLC supernatant (1 ml) and 20 ng ml−1 IL-4 in DMEM-complete (1 ml, 10 ng ml−1 final concentration). For normoxic experiments, the BMDMs were incubated at 37 °C in a humidified tissue culture incubator (5% CO2). For hypoxic experiments, the BMDMs were plated in 1 ml DMEM-complete and incubated in an Autoflow NU-8500 incubator (0.1% O2 and 5% CO2) (Nuaire). The cells were harvested at 6 h and 24 h. The cells were used in subsequent experiments for qPCR and western blotting. The peritoneal macrophages were plated in DMEM-complete and prepared in the same way for in vitro stimulation studies as the BMDMs.
Gene expression analysis
RNA was extracted from cells using RNA Bee according to the manufacturer’s protocol. The RNA concentration was measured by using a Nanodrop ND-1000 spectrophotometer (Thermo Scientific). cDNA was synthesized using a SMARTer PCR cDNA Synthesis Kit, in accordance with the manufacturer’s protocol. qPCR reactions were performed with 0.25 mM each respective primer, 3 ml 1:10 dilution of cDNA and 6 ml PerfeCTa SYBR Green SuperMix in a total volume of 12 ml. qPCR was performed on an Mx3000P Thermocycler (Stratagene), and Rpl13a and Actb were used as housekeeping genes. The primers used in our gene expression experiments are shown in the Primers subsection above. Gene expression data were analysed by calculation of threshold values (Ct) and fold changes relative to an internal control.
Oxidation of lactic acid
TAMs (1 × 10⁶), all other tumour cells, BMDMs and LLC cells were cultured for 2 h in DMEM containing 100 mCi 14C-lactic acid (MP Biomedicals). After 2 h incubation, 600 ml 3 M perchloric acid was injected to deproteinize and to displace the dissolved carbonic acid into the gas phase. Filter paper in a trap was saturated with, 300 ml phenethylamine: methanol (1:1, v/v) to trap CO2. Sealed flasks were incubated overnight. The following day, the filter paper in the CO2 trap and the entire supernatant were transferred to scintillation vials containing 5 ml scintillation fluid, and the radioactivity was quantitated in a b-counter.
Western blotting
For HIF1a expression analysis, 13 ml cell lysate was loaded onto a NuPAGE 4–12% Bis-Tris gel (Novex, Life Technologies, Invitrogen, NP0321 BOX) and separated for 50 min at 180 V using 203 NuPAGE MES SDS Running Buffer (Invitrogen, catalogue number, NP0002). The transfer to polyvinylidene fluoride (PVDF) membrane was performed using transfer buffer (containing Tris, glycine and methanol) for 60 min at 30 V. The membrane was then stained with rabbit anti HIF1a antibody (Novus, NB100-449; lot A4) overnight at a dilution of 1:1,000 in 5% milk in TTBS (253 TTBS: 60 g Tris, 435 g NaCl, pH adjusted to 8.0, 25 ml Tween 20, H2O to 2 l). The membrane was washed for 45 min (three times for 15 min each), stained for 1 h using goat anti-rabbit secondary antibody (Jackson ImmunoResearch; catalogue number, 111-035-144) at a dilution of 1:5,000 in 5% milk in TTBS. The membrane was then washed for 45 min (three times for 15 min each), developed for 2 min using ECL Western Blotting Substrate (Pierce; product number, 32106; lot MJ161892A) and visualized by exposure to autoradiography film (catalogue number, E3018; Denville Scientific). The membrane was then stripped for 60 min at 4 °C, rinsed in TTBS and stained with anti-b-actin antibody (Sigma). The membrane was then washed for 45 min (three times for 15 min each), developed for 2 min using ECL Western Blotting Substrate and visualized by exposure to autoradiography film. For ARG1 expression analysis, BMDMs were plated (3 × 10⁶ cells, 2 ml MGM) in six-well tissue-culture-treated plates and incubated overnight at 37 °C. To stimulate the BMDMs, 1 ml of the following was added in duplicate: PBS, DMEM complete, LLC supernatant or DMEM-complete containing 10 ng ml 21 IL-4 (R&D Systems; catalogue number, 404-ML-010). After incubation for 20 h at 37 °C, medium from each condition was aspirated, and the cells were washed with PBS. Pepstatin A (1 mg ml 21), 1 mM phenylmethylsulphonyl fluoride (PMSF), 5 mM EDTA and 50X protease inhibitor (Sigma; catalogue number, S8830) were added immediately to Tris-Triton buffer (1% Triton X-100, 30 mM Tris, pH 7.4, 150 mM NaCl and 1 mM EDTA), which was added to each well at 250 ml per well; the cells were then scraped off, and the suspension was collected and placed on ice. Whole cell lysis was carried out by vortexing at intervals of 5 min for a total of 15 min at 4 °C. The samples were stored at −80 °C until use. Each sample was mixed well with 5X SDS protein sample buffer (125 mM Tris, pH 6.8, 10% SDS, 50% glycerol, 0.06% bromophenol blue and 1% b-mercaptoethanol), heated for 5 min at 95 uC, vortexed and centrifuged at 1,300 r.p.m. for a few seconds. The samples (20 ml) were loaded onto a NuPAGE 4–12% Bis-Tris gel and separated for 50 min at 180 V using 103 TGS running buffer (25 mM Tris, 192 mM glycine and 0.1% (w/v) SDS). The membrane transfer process was performed using transfer buffer (containing Tris, glycine, and methanol) for 60 min at 30 V. The membrane was then stained with mouse anti-ARG1 antibody (BD Transduction Laboratories; catalogue number, 610708) overnight at a dilution of 1:1,000 in 5% milk in TTBS. The membrane was then washed for 45 min (three times for 15 min each), stained for 1 h using goat anti-mouse secondary antibody (Jackson ImmunoResearch; catalogue number, 115-035-146) at a dilution of 1:5,000 in 5% milk in TTBS. The membrane was then washed for 45 min (three times for 15 min each), developed for 2 min using ECL Western Blotting Substrate and visualized using autoradiography film.
Extended Data
Extended Data Figure 1. Tissue density and histological features of TAMs.
a, LLC and B16 tumours excised at day 19 and stained for F4/80 reveal a similar distribution pattern of macrophages at the periphery and within the centre of the tumours. b, Immunohistochemistry of B16 and LLC cells injected subcutaneously and harvested on day 19. Stains are for F4/80 (B16) and CD11b (LLC). c, d, The density of TAMs within tumours is conserved and depends on the tumour type. LLC (n = 10), B16 (n = 10) and CT26 (n = 5) tumours were harvested 19 days after subcutaneous injection. c, The percentage of macrophages that were F4/80+CD11b+ was determined by FACS analysis. (#, P = 0.0128; *P < 0.0001 using a two-tailed, unpaired t-test). The histograms represent the mean ± s.e.m. Whereas an F test revealed no significant difference in the variance between B16 and CT26, there was a significant difference (P = 0.0128) in the variance between B16 and LLC. Non-parametric analysis using the Mann–Whitney test revealed a significant difference in the percentage of macrophages between LLC and B16 tumours (P = 0.0007) and between CT26 and B16 tumours (P = 0.0007). d, FACS plot of B16 and LLC tumours harvested at day 19 after subcutaneous injection and stained for F4/80 and CD11b. e, Cytology of sorted peritoneal macrophages (PMΦ) and TAMs. The cytology is representative often different experiments.
Extended Data Figure 2. Tumour-conditioned medium stabilizes HIF1α and induces expression of Vegf and Arg1.
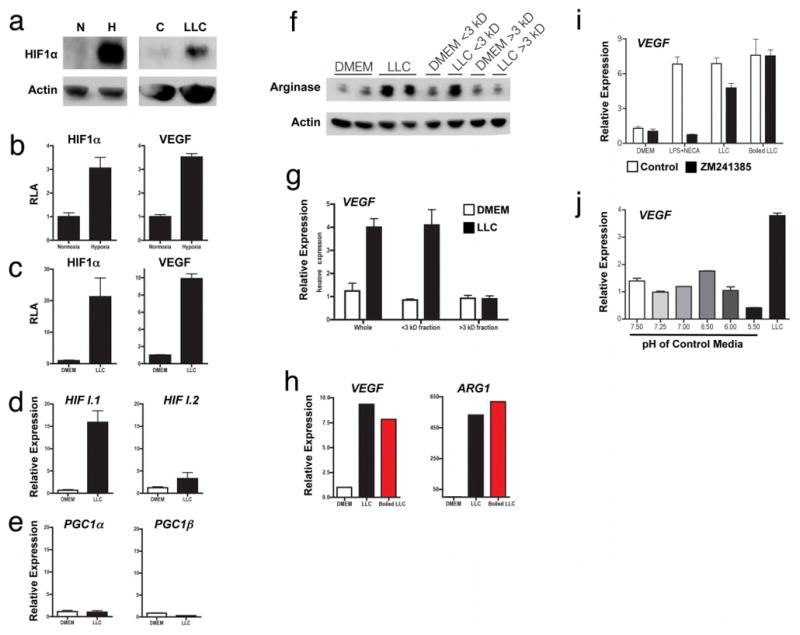
a. Western blotting of HIF1α and actin on cells grown under conditions of normoxia (N; 20.0% O2) or hypoxia (H; 0.1% O2) or stimulated with control DMEM (C) or LLC-tumour-conditioned medium (LLC). b, c, Luciferase reporter assay of 293T cells transfected with a HIF1α oxygen-dependent domain–luciferase reporter (for protein stabilization) and a Vegf promoter–luciferase reporter (for gene expression). d, e, Expression analysis by qPCR of Hif1a I.1, Hif1a I.2, Pgc1a and Pgc1b mRNA in bone-marrow-derived macrophages stimulated with LLC tumour-conditioned medium, f–h, The active factor in tumour-conditioned medium is <3 kDa and is heat stable. Western blotting for ARG1 in bone-marrow-derived macrophages (f). Expression analysis by qPCR of Vegf mRNA in bone-marrow-derived macrophages (g). Expression analysis by qPCR of Vegf and Arg1 mRNA in bone-marrow-derived macrophages stimulated with boiled (100 °C) or non-boiled LLC tumour-conditioned medium (h). i, j, Adenosine and low pH do not induce the Vegf gene. Expression analysis by qPCR of Vegf mRNA in bone-marrow-derived macrophages stimulated as follows: control medium (DMEM), 50ng ml−1 lipopolysaccharide (LPS) plus the adenosine agonist NECA (10 μM 5′-N-ethylcarboxamidoadenosine), LLC-tumour-conditioned medium, and boiled LLC tumour-conditioned medium, all ± 1 μM ZM241385 (an adenosine A2A receptor inhibitor) (i); macrophage growth medium titrated to a range of pHs using sterile HCl (j). LLC-tumour-conditioned medium has a pH of 6.8. Where indicated, the relative expression histograms represent three biological replicates displayed as the mean ± s.e.m.
Extended Data Figure 3. The splice isoform PKM2 is the predominant isoform expressed in tumour cell lines that produce high concentrations of lactic acid in vitro and in vivo.
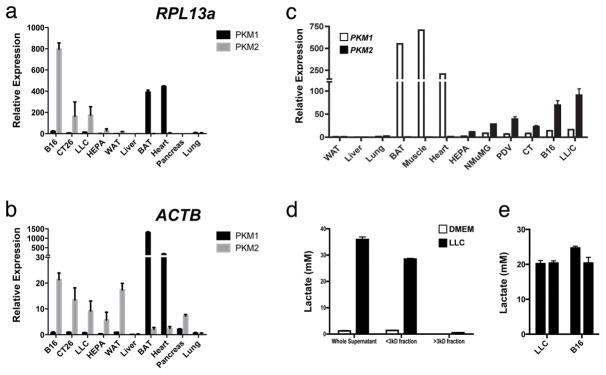
a, b, Expression analysis by qPCR of Pkm1 and Pkm2 mRNA in tissues from wild-type mice and from four tumour cell lines, normalized to Actb and Rpl13a as housekeeping genes. c, Expression analysis by qPCR of Pkm1 and Pkm2 mRNA in tissues from wild-type mice and from six tumour cell lines. qPCR results were normalized to the housekeeping gene Rpl13a. d, e, The in vivo intratumoral lactate levels in LLC and B16 tumours correspond to the concentrations that have been determined to activate macrophages in vitro. Lactate concentration (mM) in control (DMEM) or LLC-tumour-conditioned medium (unfractionated, <3-kDa fraction and >3-kDa fraction). Most of the lactic acid is present in the <3-kDa fraction (d). The mean in vivo lactic acid concentrations in LLC and B16 tumours were measured using hydrophilic interaction chromatography and mass spectroscopy (e). All relative expression histograms represent three biological replicates displayed as mean ± s.e.m. BAT, brown adipose tissue; WAT, white adipose tissue.
Extended Data Figure 4. Lactic acid induces Vegf at 6 h and Arg1 at 24 h in bone-marrow-derived macrophages.
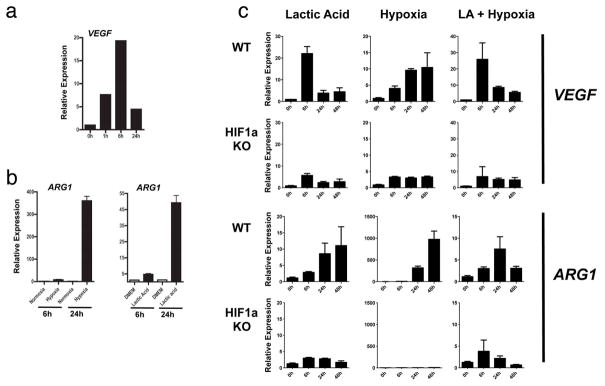
a, Expression analysis by qPCR of Vegf mRNA in bone-marrow-derived macrophages stimulated with LLC-tumour-conditioned medium at 0 h, 1 h, 6 h and 24 h. b, Expression analysis by qPCR of Arg1 mRNA in bone-marrow-derived macrophages cultured under normoxic conditions (20% O2), hypoxic conditions (0.1% O2) and with 25 mM lactic acid, at 6 h and 24 h. c, Time course of Vegf and Arg1 induction by lactic acid (25 mM), hypoxia (0.1% O2) and lactic acid plus hypoxia in bone-marrow-derived macrophages. Expression analysis by qPCR of Vegf and Arg1 mRNA in wild-type (WT) or Hif1a knockout (KO) bone-marrow-derived macrophages at 0 h, 6 h, 24 h and 48 h. Where indicated, the relative expression histograms represent three biological replicates displayed as mean ± s.e.m.
Extended Data Figure 5. Neither lactic acid nor hypoxia induces foamy cell morphology in peritoneal macrophages.
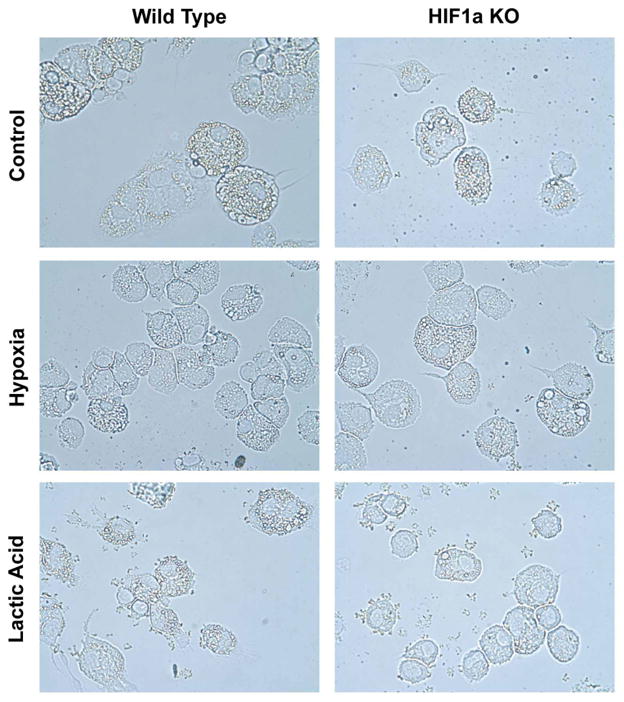
Wild-type (WT) or Hif1a knockout (KO) peritoneal macrophages were plated in control medium (DMEM) or stimulated with lactic acid (25 mM) or hypoxia (0.1%) for 24 h.
Extended Data Figure 6. Inhibition of monocarboxylate transporters abrogates the activity of lactic acid.
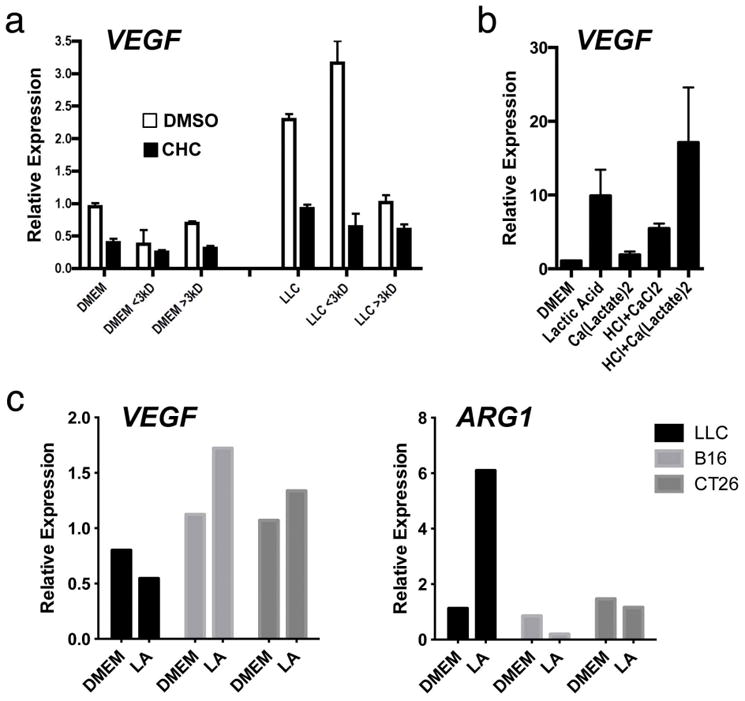
a, Expression analysis by qPCR of bone-marrow-derived macrophages stimulated with unfractionated or fractionated (<3kDa and >3kDa) control or LLC-tumour-conditioned medium ±5 mM CHC (α-cyano-4-hydroxycinnamate), a monocarboxylate channel transporter inhibitor. b, Acidic pH is necessary for the effect of lactate on bone-marrow-derived macrophages. Expression analysis by qPCR of bone-marrow-derived macrophages stimulated for 6 h with lactic acid, calcium lactate, HCl plus calcium chloride, or HCl plus calcium lactate. c, Effect of lactic acid on LLC, B16 and CT26 tumour cells. Expression analysis by qPCR of LLC, B16 and CT26 tumour cells stimulated for 6h (Vegf, left) and 24h (Arg1, right). Where indicated, the relative expression histograms represent three biological replicates displayed as mean ± s.e.m.
Extended Data Figure 7. TAMs from LLC tumours express a unique profile of TAM-associated and M2-associated markers compared with peritoneal macrophages.
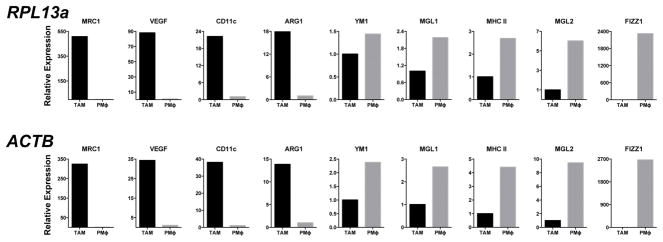
Expression analysis by qPCR of FACS-sorted peritoneal macrophages and LLC TAMs. Results using either Rpl13a or Actb as a housekeeping gene are shown.
Extended Data Figure 8. A subset of TAM markers can be induced by lactic acid and require HIF1α.
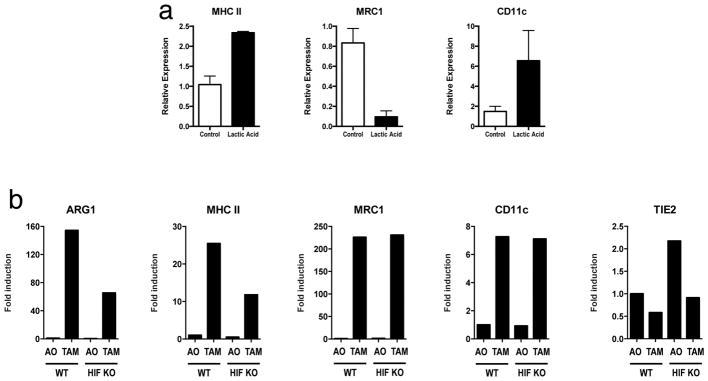
Expression analysis by qPCR of MHC II, Mrc1 and Cd11c mRNA from the following cell types: bone-marrow-derived macrophages stimulated with 25 mM lactic acid (a); TAMs from LLC tumours resected from mice with macrophages that are either wild-type (WT; C57BL/6J) or in which Hif1a has been deleted (b). Where indicated, the relative expression histograms represent three biological replicates displayed as mean ± s.e.m.
Extended Data Figure 9. Lactic acid is oxidized by and activates TAMs, characterized by the induction of Arg1, which is important for tumour growth.
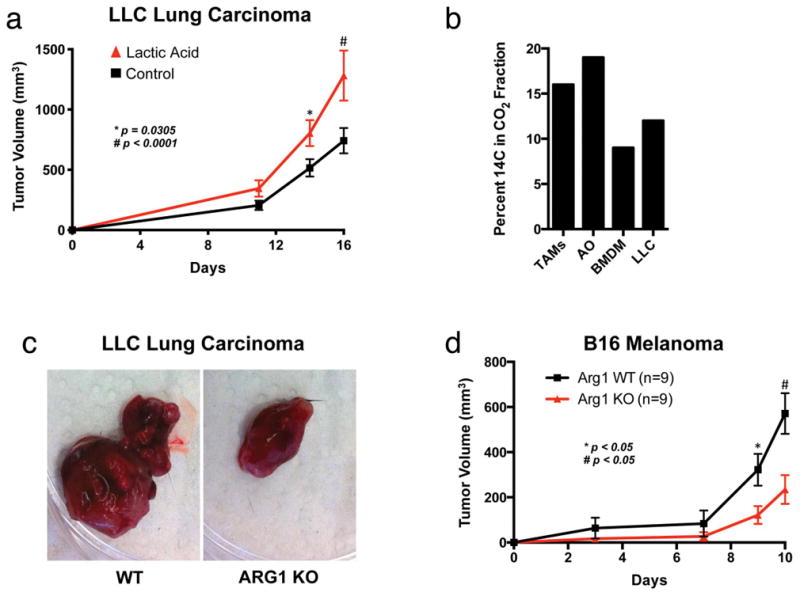
a, Lactic acid stimulation of bone-marrow-derived macrophages results in larger tumours when these macrophages are co-injected with LLC cells. The growth rate of LLC tumours in which LLC cells were co-injected 1:1 with bone-marrow-derived macrophages that had been stimulated for 24 h with either control DMEM (n = 15) or 25 mM lactic acid (n = 12) is shown. The tumour volumes were calculated using the formula (width)2 × length × 0.52 (ref. 23); *P = 0.0305 on day 14; #P < 0.0001 on day 16, using a two-tailed, unpaired t-test. Whereas the F test revealed no significant difference in variance between the groups on day 14, there was a significant difference (P = 0.0477) in the variance between the groups on day 16. Non-parametric analysis using the Mann–Whitney test revealed a significant difference between the groups on both days 14 (P = 0.0240) and 16 (P = 0.0467). The data are presented as the mean volume ± s.e.m. b, TAMs oxidize more 14C-lactic acid to CO2 than bone-marrow-derived macrophages and cultured LLC cells. TAMs, all other tumour cells (AO), bone-marrow-derived macrophages and LLC cells (1 × 10⁶) were cultured for 2 h in DMEM containing 100 μCi of 14C-laclic acid. c, d, Deletion of Arg1 in macrophages slows the growth of LLC and B16 tumours. c, The images are representative of LLC tumours from wild-type (WT) and Arg1 KO mice. d, The growth rate of B16 tumours in mice with WT (n = 9) versus Arg1 KO (n = 9) macrophages. The tumour volumes were calculated using the formula (width)2 × length × 0.52 (ref. 23). The data are presented as the mean ± s.e.m. P < 0.05 on days 9 and 10 using a two-tailed, unpaired t-test. The F test revealed no significant difference in variance between the compared groups.
Extended Data Figure 10. TAMs express higher levels of urea cycle enzymes than all other tumour cells from LLC tumours.
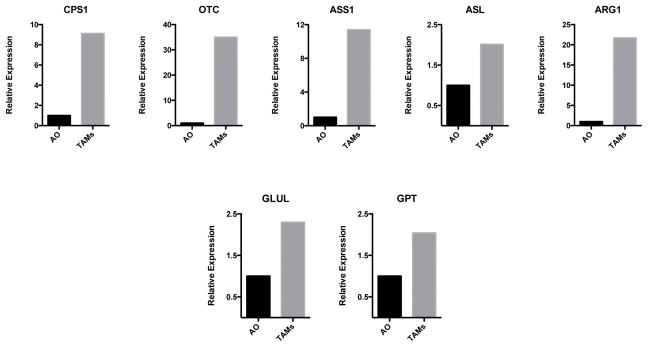
Expression analysis by qPCR of Cps1, Otc, Ass1, Asl, Arg1, Glul and Gpt mRNA in FACS-sorted TAMs and all other (AO) tumour cells from day 19 LLC tumours.
Acknowledgments
We thank members of the Medzhitov laboratory for discussions, L. Xu, C. Annicelli, S. Cronin and G. Tokmoulina for animal care and technical help, and N. Palm for critical feedback on the manuscript. O.R.C. is supported by the National Cancer Institute (1K08CA172580-01), the Yale Center for Clinical Investigation (5KL2RR024138), the Yale SPORE in Skin Cancer (1 P50 CA121974), the Damon Runyon Cancer Research Foundation (DRG 108-09) and the Dermatology Foundation. R.M.’s laboratory is supported by The Blavatnik Family Foundation, grants from the National Institutes of Health (AI046688, AI089771 and CA157461) and the Howard Hughes Medical Institute.
Footnotes
Author Contributions O.R.C. and R.M. conceived the project, designed the experimental approach, interpreted data and wrote the manuscript. N.-Q.C. and A.L.S. designed and performed experiments and wrote the manuscript. T.C., A.M.R., V.J., N.C., C.E.B., G.M.P. and G.W.C. designed and performed experiments and analysed data. S.C.E. and A.J.P. designed experiments, analysed data and provided key expertise.
Author InformationThe authors declare no competing financial interests. Readers are welcome to comment on the online version of the paper.
Online Content Methods, along with any additional Extended Data display items and Source Data, are available in the online version of the paper; references unique to these sections appear only in the online paper.
References
- 1.Pollard JW. Trophic macrophages in development and disease. Nature Rev Immunol. 2009;9:259–270. doi: 10.1038/nri2528. [DOI] [PMC free article] [PubMed] [Google Scholar]
- 2.Egeblad M, Nakasone ES, Werb Z. Tumors as organs: complex tissues that interface with the entire organism. Dev Cell. 2010;18:884–901. doi: 10.1016/j.devcel.2010.05.012. [DOI] [PMC free article] [PubMed] [Google Scholar]
- 3.Grivennikov SI, Greten FR, Karin M. Immunity, inflammation, and cancer. Cell. 2010;140:883–899. doi: 10.1016/j.cell.2010.01.025. [DOI] [PMC free article] [PubMed] [Google Scholar]
- 4.Mantovani A, Allavena P, Sica A, Balkwill F. Cancer-related inflammation. Nature. 2008;454:436–444. doi: 10.1038/nature07205. [DOI] [PubMed] [Google Scholar]
- 5.Qian BZ, Pollard JW. Macrophage diversity enhances tumor progression and metastasis. Cell. 2010;141:39–51. doi: 10.1016/j.cell.2010.03.014. [DOI] [PMC free article] [PubMed] [Google Scholar]
- 6.Chang CI, Liao JC, Kuo L. Macrophage arginase promotes tumor cell growth and suppresses nitric oxide-mediated tumor cytotoxicity. Cancer Res. 2001;61:1100–1106. [PubMed] [Google Scholar]
- 7.Shweiki D, Itin A, Soffer D, Keshet E. Vascular endothelial growth factor induced by hypoxia may mediate hypoxia-initiated angiogenesis. Nature. 1992;359:843–845. doi: 10.1038/359843a0. [DOI] [PubMed] [Google Scholar]
- 8.Gordon S, Martinez FO. Alternative activation of macrophages: mechanism and functions. Immunity. 2010;32:593–604. doi: 10.1016/j.immuni.2010.05.007. [DOI] [PubMed] [Google Scholar]
- 9.Arany Z, et al. HIF-independent regulation of VEGF and angiogenesis by the transcriptional coactivator PGC-1a. Nature. 2008;451:1008–1012. doi: 10.1038/nature06613. [DOI] [PubMed] [Google Scholar]
- 10.Lu H, Forbes RA, Verma A. Hypoxia-inducible factor 1 activation by aerobic glycolysis implicates the Warburg effect in carcinogenesis. J Biol Chem. 2002;277:23111–23115. doi: 10.1074/jbc.M202487200. [DOI] [PubMed] [Google Scholar]
- 11.De Ponti C, et al. Adenosine A2a receptor-mediated, normoxic induction of HIF-1 through PKC and PI-3K-dependent pathways in macrophages. J Leukoc Biol. 2007;82:392–402. doi: 10.1189/jlb.0107060. [DOI] [PubMed] [Google Scholar]
- 12.Mekhail K, Gunaratnam L, Bonicalzi ME, Lee S. HIF activation by pH-dependent nucleolar sequestration of VHL. Nature Cell Biol. 2004;6:642–647. doi: 10.1038/ncb1144. [DOI] [PubMed] [Google Scholar]
- 13.Warburg O. On the origin of cancer cells. Science. 1956;123:309–314. doi: 10.1126/science.123.3191.309. [DOI] [PubMed] [Google Scholar]
- 14.Vander Heiden MG, Cantley LC, Thompson CB. Understanding the Warburg effect: the metabolic requirements of cell proliferation. Science. 2009;324:1029–1033. doi: 10.1126/science.1160809. [DOI] [PMC free article] [PubMed] [Google Scholar]
- 15.Christofk HR, et al. The M2 splice isoform of pyruvate kinase is important for cancer metabolism and tumour growth. Nature. 2008;452:230–233. doi: 10.1038/nature06734. [DOI] [PubMed] [Google Scholar]
- 16.Murray PJ, Wynn TA. Protective and pathogenic functions of macrophage subsets. Nature Rev Immunol. 2011;11:723–737. doi: 10.1038/nri3073. [DOI] [PMC free article] [PubMed] [Google Scholar]
- 17.Lin EY, et al. Macrophages regulate the angiogenic switch in a mouse model of breast cancer. Cancer Res. 2006;66:11238–11246. doi: 10.1158/0008-5472.CAN-06-1278. [DOI] [PubMed] [Google Scholar]
- 18.Folkman J. Tumor angiogenesis: therapeutic implications. N Engl J Med. 1971;285:1182–1186. doi: 10.1056/NEJM197111182852108. [DOI] [PubMed] [Google Scholar]
- 19.Wynn TA, Barron L. Macrophages: master regulators of inflammation and fibrosis. Semin Liver Dis. 2010;30:245–257. doi: 10.1055/s-0030-1255354. [DOI] [PMC free article] [PubMed] [Google Scholar]
- 20.DeNardo DG, et al. CD41 T cells regulate pulmonary metastasis of mammary carcinomas by enhancing protumor properties of macrophages. Cancer Cell. 2009;16:91–102. doi: 10.1016/j.ccr.2009.06.018. [DOI] [PMC free article] [PubMed] [Google Scholar]
- 21.Kim S, et al. Carcinoma-produced factors activate myeloid cells through TLR2 to stimulate metastasis. Nature. 2009;457:102–106. doi: 10.1038/nature07623. [DOI] [PMC free article] [PubMed] [Google Scholar]
- 22.Wyckoff J, et al. A paracrine loop between tumor cells and macrophages is required for tumor cell migration in mammary tumors. Cancer Res. 2004;64:7022–7029. doi: 10.1158/0008-5472.CAN-04-1449. [DOI] [PubMed] [Google Scholar]
- 23.O’Reilly MS, et al. Endostatin: an endogenous inhibitor of angiogenesis and tumor growth. Cell. 1997;88:277–285. doi: 10.1016/s0092-8674(00)81848-6. [DOI] [PubMed] [Google Scholar]


