

Abstract
Background
Recent studies of anesthetic-induced unconsciousness in humans have focused predominantly on the intravenous drug propofol and have identified anterior dominance of alpha rhythms and frontal phase-amplitude coupling patterns as neurophysiological markers. However, it is unclear whether the correlates of propofol-induced unconsciousness are generalizable to inhaled anesthetics, which have distinct molecular targets and which are used more commonly in clinical practice.
Methods
We recorded 64-channel electroencephalogram in healthy human participants during consciousness, sevoflurane-induced unconsciousness, and recovery (n=10; n=7 suitable for analysis). Spectrograms and scalp distributions of low-frequency (1 Hz) and alpha (10 Hz) power were analyzed, and phase-amplitude modulation between these two frequencies was calculated in frontal and parietal regions. Phase lag index was used to assess phase relationships across the cortex.
Results
At concentrations sufficient for unconsciousness, sevoflurane did not result in a consistent anteriorization of alpha power; the relationship between low-frequency phase and alpha amplitude in the frontal cortex did not undergo characteristic transitions. By contrast, there was significant cross-frequency coupling in the parietal region during consciousness that was not observed after loss of consciousness. Furthermore, a reversible disruption of anterior-posterior phase relationships in the alpha bandwidth was identified as a correlate of sevoflurane-induced unconsciousness.
Conclusion
In humans, sevoflurane-induced unconsciousness is not correlated with anteriorization of alpha and related cross-frequency patterns, but rather by a disruption of phase-amplitude coupling in the parietal region and phase-phase relationships across the cortex.
Introduction
In recent years there has been extensive study of the intravenous anesthetic propofol in humans, using functional magnetic resonance imaging, electreoencephalography, and electrocorticography. Neurophysiologically, propofol-induced unconsciousness is characterized by an increase in the power of slow-wave oscillations (0.1-1 Hz)1–3 and the anteriorization of alpha rhythms (8-14 Hz).2,4–6 Furthermore, cross-frequency coupling relationships between the amplitude of alpha and the phase of the slow oscillation demonstrate characteristic associations with transitions into and out of propofol-induced unconsciousness (peak-trough) and deeper levels of unconsciousness (peak-max).2,6
Despite significant advances in understanding the neural basis and neurophysiological markers of propofol-induced unconsciousness, there has been less systematic study of inhaled anesthetics using high-density electroencephalography. Unlike propofol, which is relatively selective for the γ-aminobutyric acid (GABA)A receptor, the potent inhaled anesthetics in common clinical use have a more diverse set of molecular targets7 and thus may not be associated with the same neurophysiological profile. It is therefore of neuroscientific interest to assess whether the electroencephalographic correlates of sevoflurane-induced unconsciousness are similar to those of propofol-induced unconsciousness. Furthermore, inhaled anesthetics are used more commonly than propofol for maintenance of general anesthesia. As such, understanding the electroencephalographic correlates of this class of drugs may be of greater importance for clinical monitoring and the prevention of intraoperative awareness with explicit recall.8–10
In the current study, we recorded high-density electroencephalography in human volunteers to assess the neurophysiological correlates of unconsciousness induced by the inhaled anesthetic sevoflurane. Given its distinct molecular targets compared to propofol, we assessed whether sevoflurane-induced unconsciousness is characterized by the anteriorization of alpha rhythms as well as particular cross-frequency coupling patterns in frontal or parietal cortices. We also analyzed phase lag index (PLI) as a measure of phase relationships across the cortex.
Materials and Methods
This study was conducted at the University of Michigan Medical School and was approved by the Institutional Board Review (HUM00061087); written consent was obtained from all participants after a careful discussion of risks and benefits.
Study Population
We recruited 10 healthy volunteers for the study based on similar studies of propofol-induced unconsciousness; 2 two volunteers withdrew during administration of sevoflurane due to discomfort and one subject's electroencephalographic data were suboptimal due to excessive motion. Thus, data from seven healthy volunteers (4 male, 20 – 23 years of age) were included in the analysis. Participants were American Society of Anesthesiologists Class 1 physical status, body mass index <30, with Mallampati 1 or 2 airway classifications and no other factors predictive of difficult airway. We excluded subjects who were pregnant, or with a history of obstructive sleep apnea, gastroesophageal reflux, cardiac conduction abnormalities, asthma, epilepsy, history of problems with anesthesia, family history of problems with anesthesia, history of drug use, and any neurologic or psychiatric history. Pregnancy and illicit drug use were ruled out through both urine and blood analysis.
Anesthetic Protocol
Standard intraoperative monitors (noninvasive blood pressure measurement, electrocardiogram, pulse oximetry, capnography) and temperature probes were employed; at least two fully-trained anesthesiologists conducted all studies. Participants were instructed to keep their eyes closed during waking states throughout the experiment and received sevoflurane anesthesia by a secured face mask with an initial concentration of 0.4% in high-flow oxygen (8L/min). Prior to anesthetic delivery, adequate face-mask seal was confirmed by analyzing inspired and expired concentrations of oxygen while delivering an FiO2 of 1. Sevoflurane was administered at a given level for a 15-min equilibration period to achieve steady state, followed by 10 min at the target concentration. Sevoflurane concentration was increased by increments of 0.2% until loss of consciousness was achieved. This protocol is based on that of Suzuki et al,11 who found that 0.7% was the approximate concentration of sevoflurane at which consciousness was lost. After at least 10 minutes of unconsciousness, the reverse protocol (equilibration followed by steady-state period) was employed until participants regained consciousness. After recovery of consciousness, anesthetic concentration was still titrated downward until end-tidal values were 0% (Figure 1A). Prior to sevoflurane exposure, participants had objects placed in each hand that would emit a sound when squeezed. At the beginning of sevoflurane administration, participants were instructed to squeeze the object in either their left hand or right hand; instructions were delivered every 30s through an audio loop and left/right commands were randomized. Positive or negative responses were observed and recorded in the data collection software by two investigators throughout the experimental period.
Figure 1. Pharmacological and behavioral profiles.

(A) Sevoflurane concentration profile for the experimental session of 6 of the 7 participants (one subject experienced loss of consciousness at 0.4% concentration so was not included in this figure but is included in all other analyses). (B) Behavioral responsiveness profile for participant 5. Loss and recovery of consciousness occurs many times before the participant remains unconscious for at least 10 minutes. Shaded areas highlight the 5-minute alignment epochs used to compare and pool data across participants. EON=effect onset, TransUN=transition to unconsciousness, TransCON=transition to consciousness, LOC=loss of consciousness, ROC=return of consciousness
Electroencephalography Data Acquisition and Preprocessing
The electroencephalogram was acquired using a 64-channel sensor net from Electrical Geodesics, Inc. (Eugene, OR); all channels were referenced to the vertex. Electrode impedance was reduced to below 50 kΩ prior to data collection (as per manufacturer recommendations) and electroencephalographic signals were collected using a 64-channel biosignal amplifier at a rate of 500 Hz. The electroencephalogram was visually monitored in real-time to ensure continued signal integrity throughout the data collection period. After the experiment, electroencephalographic signals were highpass filtered at 0.1 Hz, and re-referenced to an average reference. An investigator experienced in reading electroencephalograms (S.B.M.) visually inspected the data to reject epochs and channels with noise or non-physiological artifacts.
Behavioral State Analysis
Each participant's experimental session was divided into non-overlapping 5 minute epochs. Within each epoch, the time-series of positive and negative responses to auditory commands (every 30 s) was used to calculate the percentage of time the participant was responsive. Changes in responsiveness were assumed to reflect changes in levels of consciousness over the course of the experiment. To compare and pool data across participants, we defined two behavioral time markers for each subject: 1) Loss of consciousness (LOC) – the first negative response to an auditory command during induction that was followed by at least 5 minutes of 0% responsiveness; and 2) Recovery of consciousness (ROC) – the first positive response to an auditory command following LOC. We further defined six 5-minute ‘alignment epochs’ based on experimental conditions and individual responsiveness profiles: 1) Baseline – prior to sevoflurane exposure, participants at rest with their eyes closed (100% responsiveness); 2) Effect onset of sevoflurane (EON) - during induction, immediately following the first negative response to an auditory command (≤ 90% responsiveness); 3) Transition to unconsciousness (Transun) – during induction, immediately prior to LOC (> 0% responsiveness); 4) Unconscious – between LOC and ROC (0% responsiveness); 5) Transition to recovery (Transcon) – during emergence, immediately following ROC (> 0% responsiveness); and 6) Recovery – after emergence, participant at rest with their eyes closed (100% responsiveness). These defined epochs are illustrated in Figure 1B.
Electroencephalographic Analysis
Spectral Analysis
Spectrograms were computed in Chronux*, using the multitaper method, with window lengths of T = 2 s, step size of 0.1 s, time-bandwidth product NW = 2, number of tapers K = 3. These parameters were chosen to replicate the spectral analysis in a recent study of propofol-induced unconsciousness.2 Electroencephalographic data from all 64-channels were used in the spectral analysis for each participant. To compute group-level spectrograms, we aggregated all electroencephalogram channels from each participant across the six alignment epochs described in the Behavioral State Analysis section.
Topographic Analysis
Scalp power distributions were calculated using the topoplot function in EEGLab.12
Phase-Amplitude Coupling Analysis
Phase-amplitude coupling was conducted using the Phase-Amplitude Coupling Toolbox (PACT)13 in EEGlab. We used band-pass filters to extract low-frequency (0.1 – 1 Hz) and alpha (8 – 14 Hz) oscillations from the electroencephalogram for each participant. Next, we used a Hilbert transform to extract the instantaneous amplitude and phase from each bandwidth. We computed a phase-amplitude modulogram6 by assigning each temporal sample to one of N = 18 equally spaced phase bins based on the instantaneous value of the low-frequency phase, and then averaging the corresponding instantaneous amplitude of alpha within a 1 minute epoch. The modulogram was calculated for five frontal electrodes near Fz and four parietal electrodes near Pz, and the results were averaged across all participants.
Phase Lag Index (PLI) Analysis
A surrogate of functional connectivity across frontal-parietal, frontal-temporal and frontal-occipital brain regions was calculated using PLI, which is sensitive only to nonzero phase lead/lag relationships in order to avoid the problem of volume conduction.14 The instantaneous phase of each channel of the electroencephalogram was extracted using a Hilbert transform. Phase difference Δφt was calculated between channels, where Δφt = φi,t − φj,t, t = 1, 2, …, n, n is the number of samples within one epoch, and i and j were set to include all channels in frontal, parietal, temporal and occipital brain regions. We then calculated PLI as follows:
In this equation, the sign() function results in 1 if Δφt > 0, 0 if Δφt = 0, and 1 if Δφt < 0. A PLI value close to 1 indicates that the instantaneous phase of one signal is consistently ahead of another signal and the phases are locked, while a PLI value close to 0 indicates that there is no consistent phase lead or lag relationship between signals. We controlled for spurious PLI values by performing a surrogate data analysis as follows. Surrogate data sets were generated for each combination of channel pairs i and j by maintaining the phase time series (calculated using a Hilbert transform) of channel i, and interchanging the phase time series from 0 to n/2 with the phase time series from n/2 to n of channel j, where n is the number of samples within one epoch. This method ensured that the true phase relationships between channels were eliminated while maintaining the spectral properties of each epoch. As with the empirical datasets, the PLI was calculated for surrogate datasets derived from frontal-parietal, frontal-temporal and frontal-occipital combinations.
Methodological Control
To establish a methodological control condition that validated the algorithms employed in this study, we tested our methods on two sets of electroencephalographic data collected from participants undergoing propofol-induced unconsciousness. Dataset P1 was obtained using the same 64-channel electroencephalograph and was collected over 15 minutes from a single human volunteer. Propofol infusion began at 100 μg/kg/min and increased by this amount every five minutes until loss of consciousness, defined by the same criteria as used in sevoflurane experiments. Dataset P2 consisted of 8-channel electroencephalographic data previously collected from nine surgical patients.15 Propofol was administered at an initial target controlled infusion of 2.0 μg/mL and increased at a rate of 1.0 μg/mL every 20 seconds until loss of consciousness. Five minutes of electroencephalographic activity were analyzed from five periods: 1) baseline; 2) propofol induction, ending in loss of consciousness; 3) unconsciousness; 4) recovery, beginning with cessation of propofol delivery and ending with return of consciousness; and 5) post-recovery. Note that periods 4 and 5 reflect the effects of surgery as well as drugs other than propofol. The identification of increased alpha power, alpha anteriorization, and expected cross-frequency coupling changes confirmed the ability of our algorithms to detect these patterns when present (Supplemental Digital Content, Figure 1).
Statistical Analysis
Spectrogram
We determined whether or not there was a significant increase from baseline in low-frequency and alpha power in the group-level spectrogram by performing a two-tailed sign test at each time-frequency location in these bandwidths, treating each participant as an independent sample. Values were considered significant at α < 0.05.
Phase Amplitude Coupling
Canolty's phase-amplitude coupling Modulation Index was calculated for each minute of the phase-amplitude modulogram.16,17 To test the null hypothesis that the phase and amplitude are decoupled, we used the surrogate data method proposed in Canolty et al.16 For each minute of data, we generated a random time shifts Δt that ranged between 0 and 60 seconds. We then shifted the amplitude series by Δt while keeping the phase series fixed, and calculated the Modulation Index for the resulting surrogate time series. We repeated this procedure 2000 times to produce distributions of values of the Modulation Index for datasets in which the null hypothesis should hold. The Modulation Index of the non-shifted time series was then compared to this distribution and was considered significant if it exceeded 95% of the surrogate values (p < 0.05).
PLI
PLI values were compared among baseline, unconscious and recovery epochs using a one-way ANOVA with a post-hoc Tukey correction for each of the following channel combinations: frontal-parietal, frontal-temporal and frontal-occipital. For each of these combinations, a student's t-test (two-tailed) was used to compare PLI values from baseline, unconscious and recovery epochs with the PLI from the randomized counterpart of surrogate datasets. All statistical analyses were conducted in MATLAB (Natick, MA) and differences were considered significant at α < 0.05.
Results
Pharmacological and Behavioral Characteristics of Sevoflurane-Induced Unconsciousness
Six of the seven participants experienced loss of consciousness that lasted for at least 10 minutes as sevoflurane levels were being increased from 0.6% to 0.8%, which is consistent with the protocol described by Suzuki et al.11 The sevoflurane concentration profile over the experimental session for these six participants is illustrated in Figure 1A. One participant lost consciousness at a steady-state concentration of 0.4% sevoflurane; for this participant, unconsciousness was maintained for 10 minutes, and sevoflurane was subsequently reduced to 0%. Each participant demonstrated a unique behavioral responsiveness profile to the auditory commands as sevoflurane levels changed, with some losing and recovering consciousness once, and others many times throughout the experimental session. One such responsiveness profile is presented in Figure 1B, with an overlay of the six alignment epochs used to group electroencephalographic data.
Sevoflurane-Induced Unconsciousness is not Correlated with an Overall Increase in Alpha Power or Low-Frequency Power
The group-level channel spectrograms demonstrated no increase in alpha (8 – 14 Hz) power or low-frequency (0.1 – 1 Hz) power in any of the alignment epochs compared to baseline power (Figure 2, sign test, p=0.125 for alpha and p=0.453 for slow oscillations). In particular, increases in power were not observed during the epoch of sevoflurane-induced unconsciousness. There were also no characteristic changes observed in alpha or low-frequency power in the individual-level spectrograms (Supplemental Digital Content, Figure 2).
Figure 2. Group spectral analysis.

Scalp electroencephalogram across all channels does not demonstrate an increase in alpha or low-frequency power during sevoflurane-induced unconsciousness. EON=effect onset, TransUN=transition to unconsciousness, TransCON=transition to consciousness
Sevoflurane-Induced Unconsciousness is not Correlated with Anterior Dominance of Alpha Power
Topographic analyses of the spatial distribution of alpha in all six alignment epochs for each individual participant are presented in Figure 3. In the group-level analysis, alpha power is greatest over the occipital cortex throughout all six epochs; this is true even during the period of sevoflurane-induced unconsciousness. In the individual-level analysis, three of the seven participants demonstrated some degree of anteriorized alpha power during the period of sevoflurane-induced unconsciousness, but there was no strict correlation with state across subjects.
Figure 3. Individual and average topography of alpha power.

During sevoflurane-induced unconsciousness, alpha power remains primarily in occipital cortex for 4 participants and undergoes some degree of anteriorization in 3 participants. On average, anteriorization of alpha power is not correlated with sevoflurane-induced unconsciousness. Subject 6 became unconscious at the first concentration of sevoflurane and thus the effective onset period is not applicable (N/A). EON=effect onset, TransUN=transition to unconsciousness, TransCON=transition to consciousness, LOC=loss of consciousness, ROC=return of consciousness
Sevoflurane-Induced Unconsciousness is Correlated with Disrupted Phase-Amplitude Coupling in Parietal Cortex
We examined cross-frequency coupling between slow oscillation phase and alpha amplitude. In frontal channels, no significant coupling was observed during any period of consciousness or unconsciousness (Figure 4A). In parietal channels, significant coupling was observed in 60% of the conscious epochs but in none of the unconscious epochs (Figure 4B). The average modulation index over time for all frontal and parietal channels is presented in Figure 4C.
Figure 4. Cross-frequency coupling between low-frequency (0.1 – 1 Hz) phase and alpha (8 – 14 Hz) amplitude.

(A) Frontal channels. No significant coupling is observed during conscious epochs or sevoflurane-induced unconsciousness. (B) Modulation index for frontal (purple) and parietal (blue) channels. Values above the dotted line are significant at p < 0.05. (C) Parietal channels. Significant coupling is observed during conscious epochs but not during sevoflurane-induced unconsciousness. EON=effect onset, TransUN=transition to unconsciousness, TransCON=transition to consciousness, LOC=loss of consciousness, ROC=return of consciousness
Sevoflurane-Induced Unconsciousness is Correlated with Decreased Phase Lag Index in the Alpha Bandwidth across Frontal-Parietal, Frontal-Temporal and Frontal-Occipital Regions
We calculated PLI between frontal-parietal, frontal-temporal and frontal-occipital channel combinations in the alpha bandwidth during baseline, unconscious and recovery alignment epochs. In each comparison, a one-way ANOVA yielded significant differences between epochs (frontal-parietal: p = 0.013; frontal-temporal: p = 0.0043; frontal-occipital: p = 0.0002; Figure 5A). A post hoc Tukey test showed that the unconscious epoch had significantly lower PLI values than baseline or recovery epochs (frontal-parietal: p = 0.025; frontal-temporal: p = 0.01; frontal-occipital: p = 0.0006); PLI values in baseline and recovery epochs were not significantly different. Decreased PLI during sevoflurane-induced unconsciousness was observed for each individual participant between frontal and occipital brain regions in the alpha bandwidth, despite the fact that dominance of alpha power did not shift from occipital to frontal regions in the majority of subjects (Figure 5B). Surrogate PLI analysis did not, as expected, result in nonzero values; empirical PLI values were significantly higher than all surrogate PLI counterpart values across baseline (frontal-parietal: p = 0.003; frontal-temporal: p = 0.001; frontal-occipital: p = 0.00004), unconsciousness (frontal-parietal: p = 0.0005; frontal-temporal: p = 0.00003; frontal-occipital: p =0.0004), and recovery (frontal-parietal: p = 0.003; frontal-temporal: p = 0.001; frontal-occipital = 0.0006).
Figure 5. Phase lag index (PLI) analysis.
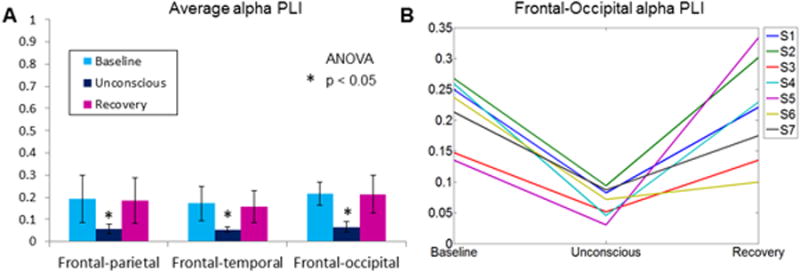
A PLI value of 1 reflects perfectly consistent phase lead/lag relationship and a value of 0 reflects no consistent phase relationship. (A) Average PLI in the alpha bandwidth across aligned baseline, unconscious and recovery epochs. PLI values significantly decrease during sevoflurane-induced unconsciousness across three brain region combinations. (B) Individual PLI values across baseline, unconsciousness and recovery alignment epochs between frontal and occipital channels. Each individual participant demonstrates a reversible decrease in PLI upon sevoflurane-induced unconsciousness, despite the lack of a consistent shift of alpha power from occipital to frontal cortices. Note that for all empirical data analyses shown in this figure, counterpart surrogate datasets suggested no spurious phase-phase relationships.
Discussion
The current study demonstrates that the stepwise, steady-state induction of unconsciousness with sevoflurane is not characterized by high-power frontal slow oscillations, anterior dominance of alpha rhythms, or a specific phase-amplitude relationship between these frequencies in the frontal cortex. Instead, sevoflurane-induced unconsciousness was correlated with disrupted phase-amplitude relationships in parietal cortex and disrupted phase-phase relationships across frontal-parietal, frontal-temporal and frontal-occipital regions of the brain.
Past Studies of Anteriorized Power and Cross-Frequency Coupling
In the 1970s, Tinker et al18 were the first to test the hypothesis (in Java monkeys) that anteriorization or “frontal dominance” of electroencephalographic power was correlated with the loss of ability to respond to a stimulus, as induced by various anesthetic drugs. In the mid-1990s, the reduction of the expected posterior alpha in the awake, eyes-closed state and the shift to more anterior structures was identified during propofol sedation and during unconsciousness induced by a combination of isoflurane and nitrous oxide.19,20 In 2001, John et al21 suggested that electroencephalographic anteriorization of alpha and slow-wave activity was an agent-independent feature of general anesthesia, based on the study of 176 surgical patients undergoing general anesthesia with a wide variety of intravenous and inhaled anesthetics. In 2004, Feschenko et al22 demonstrated the disappearance of occipital alpha oscillations and the appearance of high-power frontal alpha oscillations during propofol-induced unconsciousness in 52 healthy human participants.
More recently, Purdon et al2 used high-density electroencephalography to demonstrate that anteriorized alpha rhythms are associated with propofol-induced unconsciousness. During propofol-induced unconsciousness, slow oscillations have also been associated with anterior structures; peak slow-wave activity correlates with gray matter volume of the frontal cortex.3 Cross-frequency coupling analysis of alpha rhythms and slow oscillations reveals characteristic phase-amplitude relationships across states. The “trough-max” pattern is associated with transitions around the loss or recovery of consciousness and is defined by the maximal alpha amplitude occurring at the trough of the slow oscillation. Conversely, the “peak-max” pattern is associated with deeper levels of propofol-induced unconsciousness and is defined by the maximal alpha amplitude occurring at the peak of the slow oscillation. This trough-max and peak-max relationship had been previously demonstrated in a study of desflurane, but at higher relative doses than those used in the current study.23
Alpha Rhythms and Sevoflurane-Induced Unconsciousness
Using methodology that is comparable to recent studies, we were not able to demonstrate a consistent association of unconsciousness induced by sevoflurane with the anterior dominance of alpha and slow oscillations. Gugino et al24 compared the electroencephalographic topography of propofol and sevoflurane, finding an increased tendency to anteriorization of alpha with propofol at induction and prior to recovery of consciousness. Findings related to sevoflurane in this study were possibly confounded by polypharmacy, since volunteers received fentanyl premedication and remifentanil during administration of propofol and sevoflurane. The addition of remifentanil to an anesthetic can potentially alter level of sedation as well as the characteristics of frontal electroencephalography.25 By contrast, the current investigation was conducted using sevoflurane exclusively.
There are several reasons why our findings could be discrepant with past studies of propofol and other anesthetics. First, it is possible that anteriorization occurs at higher concentrations of sevoflurane than those tested in the current study. Indeed, Gugino et al24 reported a dose-dependent effect on anteriorization during administration of sevoflurane but not propofol (which had already reached maximal levels at loss of consciousness). However, we were specifically testing the hypothesis that anterior dominance was a marker of sevoflurane-induced unconsciousness, rather than the hypothesis that sevoflurane can—at some dose—cause anteriorized electroencephalographic activity in the alpha bandwidth.
Second, the data presented in the current study were acquired during anesthetic-induced unconsciousness in the absence of a noxious stimulus. By contrast, the protocol of Gugino et al24 included graded attempts to arouse the participants. As such, higher concentrations of anesthetic may have been required in order to suppress a response to command compared to the simple auditory stimulus that we employed. As noted, opioids were also included in the Gugino et al study, which can facilitate sedation and alter electroencephalographic patterns in the frontal cortex.
Third, it is possible that distinct underlying molecular mechanisms account for the distinct neurophysiological profile. Ching et al4,26 and Vijayan et al5 have developed models for the anteriorization of alpha rhythms induced by propofol—and potentially other anesthetics—based on agonism of the GABAA receptor in the thalamus. Accordingly, the phenomenon of anteriorization in relationship to unconsciousness should be determined by an anesthetic's (1) selectivity for the GABAA receptor, and (2) dependence on modulating GABA transmission to achieve the behavioral endpoint of unconsciousness. Sevoflurane is a halogenated ether that is less selective for the GABAA receptor and less dependent than propofol on GABAA agonism to achieve anesthetic endpoints.27,28 For example, in a rat hippocampal slice model, propofol primarily enhanced inhibitory pathways (mediated by GABAA receptors), whereas sevoflurane primarily depressed excitatory pathways (mediated by glutamate receptors).28 Furthermore, changes in ambient GABA concentrations result in altered cellular and behavioral responses to propofol but only minimally affect responses to sevoflurane.29 Based on these considerations, we suggest that, as would be predicted by recent modeling studies, the electroencephalographic anteriorization associated with propofol reflects a certain threshold of GABAA agonism, which is a critical molecular mechanism of propofol-induced unconsciousness. By contrast, sevoflurane is less selective than propofol for GABAA receptors and less dependent on GABAA agonism for the induction of unconsciousness. Therefore, anteriorization does not appear consistently at the state transition of sevoflurane-induced unconsciousness but rather at higher doses of sevoflurane24 when the reduced selectivity for the GABAA receptor is overcome by increased concentrations of the drug. This hypothesis is further supported by comparing our results to a past study of unconsciousness induced by ketamine, for which the GABAA receptor is not a major target.30 Lee et al. demonstrated a significant decrease in relative alpha power during ketamine-induced unconsciousness.31 These parallel findings reinforce the hypothesis that the electroencephalographic characteristics associated with propofol-induced unconsciousness (e.g. anterior dominance of alpha, increased alpha power) are mediated by GABAA agonism.
Phase-Amplitude Relationships and Sevoflurane-Induced Unconsciousness
We did not observe significant phase-amplitude coupling in the frontal electroencephalogram during any of the alignment epochs. Our results are distinct from phase-amplitude relationships observed during propofol-induced unconscious, where the loss and recovery of consciousness have been characterized by a trough-max coupling pattern.2 Mukamel et al6 associated this trough-max pattern with anterior structures such as the anterior cingulate and the frontal cortices; this coupling occurs at approximately the same time as an increase in alpha power in the frontal electrodes. We did not observe either alpha anteriorization or the emergence of a trough-max pattern, which suggests that the two phenomena are coupled. We also did not observe the emergence of a peak-max phase amplitude coupling pattern. This result was somewhat expected, as peak-max coupling has been associated with profound unconsciousness and we did not increase sevoflurane concentrations beyond what was necessary to achieve loss of consciousness. Again, it is possible that the characteristic changes of cross-frequency coupling in frontal channels are mediated specifically by changes in GABAA receptor function. Blain-Moraes et al32 recently demonstrated that the pattern of phase-amplitude modulation observed during propofol-induced unconsciousness does not occur during ketamine-induced unconsciousness.
An important positive finding of our cross-frequency coupling analysis was the significant trough-max coupling observed in parietal channels during 60% of epochs before loss of consciousness and after recovery of consciousness. By contrast, there was no significant coupling observed during the unconscious epoch. This observed coupling disruption in parietal but not frontal regions is consistent with studies that have demonstrated that parietal networks are more affected by anesthetics than frontal networks.33,34 The fact that significant coupling only occurred 60% of the time outside of the unconscious epoch may potentially be explained by noting that participants were only conscious for a fraction of the time during transitions into and out of unconsciousness.
Sevoflurane-Induced Unconsciousness is Correlated with Disrupted Phase-Phase Relationships across the Brain
Loss of consciousness during exposure to sevoflurane was characterized by a significant and reversible decrease of PLI, a surrogate functional connectivity measure based on phase lead/lag relationships that preferentially reflects longer-range phase relationships. Importantly, the frontal-occipital PLI in the alpha bandwidth was reduced in each volunteer during the period of unconsciousness. The fact that this anterior-posterior functional disconnection was observed consistently despite the absence of uniform alpha anteriorization suggests that disrupted phase-phase relationships may be mechanistically independent and a more sensitive indicator of sevoflurane-induced unconsciousness. Furthermore, this phase-phase disruption across the cortex may be independent of GABAA modulation. In support of this, we have recently demonstrated that ketamine-induced unconsciousness is also associated with a decrease in PLI.32 Thus, unlike anteriorization, anesthetic actions at distinct molecular targets may nonetheless result in a functional disconnection across the cortex, suggesting a state-specific vs. a drug-specific phenomenon. Functional disconnections between the frontal cortex and other brain regions may represent a “top-down” mechanism for anesthetic-induced unconsciousness,35 which is supported by the fact that molecularly diverse anesthetics can disrupt long-range coupling in a cortical slice model that does not include a thalamus.36 However, it is also possible that anesthetic actions in higher-order nuclei of the thalamus37 could destabilize corticocortical or corticothalamocortical interactions.38 In either case, the results of this and past investigations in humans suggest that multiple classes of anesthetics can disrupt phase relationships across the cortex,1,32,39 resulting in a fragmentation of networks that might represent the common mediator and proximate cause of anesthetic-induced unconsciousness.40
Limitations
This study has numerous limitations. First, this was a small study of young healthy volunteers and, despite the significant differences identified in parietal phase-amplitude relationships and cortical phase-phase relationships, we cannot extrapolate our data to a broad population of surgical patients of varying ages and comorbidities. Second, we did not study doses of sevoflurane beyond those required to achieve a consistently unconscious state. Third, we cannot extend our findings to other volatile anesthetics since we did not study all halogenated ethers or haloalkanes in current clinical use. Finally, it is important to note that sevoflurane has unique electroencephalographic effects, including epileptiform activity. However, this is a dose-dependent phenomenon and typically observed at far higher concentrations than used in the current study.41
Conclusions
Unconsciousness during administration of sevoflurane is not characterized by the anterior dominance of alpha rhythms and slow oscillations, or specific phase-amplitude relationships between these frequencies in the frontal cortex. Instead, reversible disruptions of parietal phase-amplitude coupling and cortical phase-phase relationships in the alpha bandwidth are correlated with sevoflurane-induced unconsciousness.
Supplementary Material
Acknowledgments
We gratefully acknowledge GyuJeong Noh, M.D., Ph.D., Department of Anesthesiology at Asan Medical Center and SeungWoo Kim, M.D., Ph.D., Department of Anesthesiology at Asan Medical Center, Seoul, South Korea for allowing us to reanalyze data (for our methodologic control using propofol) originally gathered during a collaborative project.
Funding: Supported by the National Institutes of Health, Bethesda, Maryland, Grant RO1GM098578 (to Dr. Mashour) and the Department of Anesthesiology, University of Michigan.
Footnotes
www.chronux.org, (Last accessed 08/28/2014).
Conflicts of Interest: The authors declare no competing interests.
References
- 1.Lewis LD, Weiner VS, Mukamel EA, Donoghue JA, Eskandar EN, Madsen JR, Anderson WS, Hochberg LR, Cash SS, Brown EN, Purdon PL. Rapid fragmentation of neuronal networks at the onset of propofol-induced unconsciousness. Proc Natl Acad Sci. 2012;109:19891–2. doi: 10.1073/pnas.1210907109. [DOI] [PMC free article] [PubMed] [Google Scholar]
- 2.Purdon PL, Pierce ET, Mukamel EA, Prerau MJ, Walsh JL, Wong KFK, Salazar-Gomez AF, Harrell PG, Sampson AL, Cimenser A, Ching S, Kopell NJ, Tavares-Stoeckel C, Habeeb K, Merhar R, Brown EN. Electroencephalogram signatures of loss and recovery of consciousness from propofol. Proc Natl Acad Sci. 2013;110:E1142–51. doi: 10.1073/pnas.1221180110. [DOI] [PMC free article] [PubMed] [Google Scholar]
- 3.Mhuircheartaigh RN, Warnaby C, Rogers R, Jbabdi S, Tracey I. Slow-wave activity saturation and thalamocortical isolation during propofol anesthesia in humans. Sci Transl Med. 2013;5:208ra148. doi: 10.1126/scitranslmed.3006007. [DOI] [PubMed] [Google Scholar]
- 4.Ching S, Cimenser A, Purdon PL, Brown EN, Kopell NJ. Thalamocortical model for a propofol-induced α-rhythm associated with loss of consciousness. Proc Natl Acad Sci. 2010;107:22665–70. doi: 10.1073/pnas.1017069108. [DOI] [PMC free article] [PubMed] [Google Scholar]
- 5.Vijayan S, Ching S, Purdon PL, Brown EN, Kopell NJ. Thalamocortical mechanisms for the anteriorization of alpha rhythms during propofol-induced unconsciousness. J Neurosci. 2013;33:11070–5. doi: 10.1523/JNEUROSCI.5670-12.2013. [DOI] [PMC free article] [PubMed] [Google Scholar]
- 6.Mukamel EA, Pirondini E, Babadi B, Wong KFK, Pierce ET, Harrell PG, Walsh JL, Salazar-Gomez AF, Cash SS, Eskandar EN, Weiner VS, Brown EN, Purdon PL. A transition in brain state during propofol-induced unconsciousness. J Neurosci. 2014;34:839–45. doi: 10.1523/JNEUROSCI.5813-12.2014. [DOI] [PMC free article] [PubMed] [Google Scholar]
- 7.Forman SA, Chin VA. General anesthetics and molecular mechanisms of unconsciousness. Int Anesthesiol Clin. 2008;46:43–53. doi: 10.1097/AIA.0b013e3181755da5. [DOI] [PMC free article] [PubMed] [Google Scholar]
- 8.Avidan MS, Jacobsohn E, Glick D, Burnside BA, Zhang L, Villafranca A, Karl L, Kamal S, Torres B, O'Connor M, Evers AS, Gradwohl S, Lin N, Palanca BJ, Mashour GA. Prevention of intraoperative awareness in a high-risk surgical population. N Engl J Med. 2011;365:591–600. doi: 10.1056/NEJMoa1100403. [DOI] [PubMed] [Google Scholar]
- 9.Mashour GA, Shanks A, Tremper KK, Kheterpal S, Turner CR, Ramachandran SK, Picton P, Schueller C, Morris M, Vandervest JC, Lin N, Avidan MS. Prevention of intraoperative awareness with explicit recall in an unselected surgical population: A randomized comparative effectiveness trial. Anesthesiology. 2012;117:717–25. doi: 10.1097/ALN.0b013e31826904a6. [DOI] [PMC free article] [PubMed] [Google Scholar]
- 10.Avidan MS, Mashour GA. Prevention of intraoperative awareness with explicit recall: Making sense of the evidence. Anesthesiology. 2013;118:449–56. doi: 10.1097/ALN.0b013e31827ddd2c. [DOI] [PubMed] [Google Scholar]
- 11.Suzuki A, Katoh T, Ikeda K. The effect of adenosine triphosphate on sevoflurane requirements for minimum alveolar anesthetic concentration and minimum alveolar anesthetic concentration-awake. Anesth Analg. 1998;86:179–83. doi: 10.1097/00000539-199801000-00035. [DOI] [PubMed] [Google Scholar]
- 12.Delorme A, Makeig S. EEGLAB: An open source toolbox for analysis of single-trial EEG dynamics including independent component analysis. J Neurosci Methods. 2004;134:9–21. doi: 10.1016/j.jneumeth.2003.10.009. [DOI] [PubMed] [Google Scholar]
- 13.Miyakoshi M, Delorme A, Mullen T, Kojima K, Makeig S, Asano E. Automated detection of cross-frequency coupling in the electrocorticogram for clinical inspection. Conf Proc IEEE Eng Med Biol Soc. 2013:3282–5. doi: 10.1109/EMBC.2013.6610242. [DOI] [PMC free article] [PubMed] [Google Scholar]
- 14.Stam CJ, Nolte G, Daffertshofer A. Phase lag index: Assessment of functional connectivity from multi channel EEG and MEG with diminished bias from common sources. Hum Brain Mapp. 2007;28:1178–93. doi: 10.1002/hbm.20346. [DOI] [PMC free article] [PubMed] [Google Scholar]
- 15.Ku SW, Lee U, Noh GJ, Jun IG, Mashour GA. Preferential inhibition of frontal-to-parietal feedback connectivity is a neurophysiologic correlate of general anesthesia in surgical patients. PLoS ONE. 2011;6:e25155. doi: 10.1371/journal.pone.0025155. [DOI] [PMC free article] [PubMed] [Google Scholar]
- 16.Canolty RT, Edwards E, Dalal SS, Soltani M, Nagarajan SS, Kirsch HE, Berger MS, Barbaro NM, Knight RT. High gamma power is phase-locked to theta oscillations in human neocortex. Science. 2006;313:1626–8. doi: 10.1126/science.1128115. [DOI] [PMC free article] [PubMed] [Google Scholar]
- 17.Penny WD, Duzel E, Miller KJ, Ojemann JG. Testing for nested oscillation. J Neurosci Methods. 2008;174:50–61. doi: 10.1016/j.jneumeth.2008.06.035. [DOI] [PMC free article] [PubMed] [Google Scholar]
- 18.Tinker JH, Sharbrough FW, Michenfelder JD. Anterior shift of the dominant EEG rhythm during anesthesia in the java monkey: Correlation with anesthetic potency. Anesthesiology. 1977;46:252–9. doi: 10.1097/00000542-197704000-00005. [DOI] [PubMed] [Google Scholar]
- 19.Kishimoto T, Kadoya C, Sneyd R, Samra SK, Domino EF. Topographic electroencephalogram of propofol-induced conscious sedation. Clin Pharmacol Ther. 1995;58:666–74. doi: 10.1016/0009-9236(95)90023-3. [DOI] [PubMed] [Google Scholar]
- 20.Kochs E, Bischoff P, Pichlmeier U, am Esch JS. Surgical stimulation induces changes in brain electrical activity during isoflurane/nitrous oxide anesthesia: A topographic electroencephalographic analysis. Anesthesiology. 1994;80:1026–34. doi: 10.1097/00000542-199405000-00012. [DOI] [PubMed] [Google Scholar]
- 21.John ER, Prichep LS, Kox W, Valdés-Sosa P, Bosch-Bayard J, Aubert E, Tom M, diMichele F, Gugino LD. Invariant reversible QEEG effects of anesthetics. Conscious Cogn. 2001;10:165–83. doi: 10.1006/ccog.2001.0507. [DOI] [PubMed] [Google Scholar]
- 22.Feshchenko VA, Veselis RA, Reinsel RA. Propofol-induced alpha rhythm. Neuropsychobiology. 2004;50:257–66. doi: 10.1159/000079981. [DOI] [PubMed] [Google Scholar]
- 23.Molaee-Ardekani B, Shamsollahi MB, Tirel O, Vosoughi-Vahdat B, Wodey E, Senhadji L. Investigation of the modulation between EEG alpha waves and slow/fast delta waves in children in different depths of Desflurane anesthesia. IRBM. 2010;31:55–66. [Google Scholar]
- 24.Gugino LD, Chabot RJ, John ER, Formanek V, Aglio LS. Quantitative EEG changes associated with loss and return of consciousness in healthy adult volunteers anaesthetized with propofol or sevoflurane. Br J Anaesth. 2001;87:421–8. doi: 10.1093/bja/87.3.421. [DOI] [PubMed] [Google Scholar]
- 25.Strachan AN, Edwards ND. Randomized placebo-controlled trial to assess the effect of remifentanil and propofol on bispectral index and sedation. Br J Anaesth. 2000;84:489–90. doi: 10.1093/oxfordjournals.bja.a013474. [DOI] [PubMed] [Google Scholar]
- 26.Ching S, Brown EN. Modeling the dynamical effects of anesthesia on brain circuits. Curr Opin Neurobiol. 2014;25:116–22. doi: 10.1016/j.conb.2013.12.011. [DOI] [PMC free article] [PubMed] [Google Scholar]
- 27.Solt K, Forman SA. Correlating the clinical actions and molecular mechanisms of general anesthetics. Curr Opin Anaesthesiol. 2007;20:300–6. doi: 10.1097/ACO.0b013e32816678a5. [DOI] [PubMed] [Google Scholar]
- 28.Asahi T, Hirota K, Sasaki R, Mitsuaki Y, Roth SH. Intravenous anesthetics are more effective than volatile anesthetics on inhibitory pathways in rat hippocampal CA1. Anesth Analg. 2006;102:772–8. doi: 10.1213/01.ane.0000196536.60320.f9. [DOI] [PubMed] [Google Scholar]
- 29.Nishikawa K, Kubo K, Obata H, Yanagawa Y, Saito S. The influence of manipulations to alter ambient GABA concentrations on the hypnotic and immobilizing actions produced by sevoflurane, propofol, and midazolam. Neuropharmacology. 2011;61:172–80. doi: 10.1016/j.neuropharm.2011.03.025. [DOI] [PubMed] [Google Scholar]
- 30.Yamamura T, Harada K, Okamura A, Kemmotsu O. Is the site of action of ketamine anesthesia the N-methyl-D-aspartate receptor? Anesthesiology. 1990;72:704–10. doi: 10.1097/00000542-199004000-00021. [DOI] [PubMed] [Google Scholar]
- 31.Lee U, Ku S, Noh G, Baek S, Choi B, Mashour GA. Disruption of frontal-parietal communication by ketamine, propofol, and sevoflurane. Anesthesiology. 2013;118:1264–75. doi: 10.1097/ALN.0b013e31829103f5. [DOI] [PMC free article] [PubMed] [Google Scholar]
- 32.Blain-Moraes S, Lee U, Ku S, Noh G, Mashour GA. Electroencephalographic effects of ketamine on power, cross-frequency coupling, and connectivity in the alpha bandwidth. Front Syst Neurosci. 2014;8:114. doi: 10.3389/fnsys.2014.00114. [DOI] [PMC free article] [PubMed] [Google Scholar]
- 33.Lee U, Müller M, Noh GJ, Choi B, Mashour GA. Dissociable network properties of anesthetic state transitions. Anesthesiology. 2011;114:872–81. doi: 10.1097/ALN.0b013e31821102c9. [DOI] [PubMed] [Google Scholar]
- 34.Kuhlmann L, Foster BL, Liley DTJ. Modulation of functional EEG networks by the NMDA antagonist nitrous oxide. PLoS ONE. 2013;8:e56434. doi: 10.1371/journal.pone.0056434. [DOI] [PMC free article] [PubMed] [Google Scholar]
- 35.Mashour GA. Top-down mechanisms of anesthetic-induced unconsciousness. Front Syst Neurosci. 2014;8:115. doi: 10.3389/fnsys.2014.00115. [DOI] [PMC free article] [PubMed] [Google Scholar]
- 36.Voss LJ, Hansson Baas C, Hansson L, Steyn-Ross DA, Steyn-Ross M, Sleigh J. Investigation into the effect of the general anaesthetics etomidate and ketamine on long-range coupling of population activity in the mouse neocortical slice. Eur J Pharmacol. 2012;689:111–7. doi: 10.1016/j.ejphar.2012.06.003. [DOI] [PubMed] [Google Scholar]
- 37.Liu X, Lauer KK, Ward BD, Li SJ, Hudetz AG. Differential effects of deep sedation with propofol on the specific and nonspecific thalamocortical systems: A functional magnetic resonance imaging study. Anesthesiology. 2013;118:59–69. doi: 10.1097/ALN.0b013e318277a801. [DOI] [PMC free article] [PubMed] [Google Scholar]
- 38.Saalmann YB. Intralaminar and medical thalamic influence on cortical synchrony, information transmission and cognition. Front Syst Neurosci. 2014;8:83. doi: 10.3389/fnsys.2014.00083. [DOI] [PMC free article] [PubMed] [Google Scholar]
- 39.Lee H, Mashour GA, Noh GJ, Kim S, Lee U. Reconfiguration of network hub structure after propofol-induced unconsciousness. Anesthesiology. 2013;119:1347–59. doi: 10.1097/ALN.0b013e3182a8ec8c. [DOI] [PMC free article] [PubMed] [Google Scholar]
- 40.Mashour GA. Cognitive unbinding: A neuroscientific paradigm of general anesthesia and related states of unconsciousness. Neurosci Biobehav Rev. 2013;37:2751–9. doi: 10.1016/j.neubiorev.2013.09.009. [DOI] [PMC free article] [PubMed] [Google Scholar]
- 41.Julliac B, Guehl D, Chopin F, Arne P, Burbaud P, Sztark F, Cros AM. Risk factors for the occurrence of electroencephalogram abnormalities during induction of anesthesia with sevoflurane in nonepileptic patients. Anesthesiology. 2007;106:243–51. doi: 10.1097/00000542-200702000-00011. [DOI] [PubMed] [Google Scholar]
Associated Data
This section collects any data citations, data availability statements, or supplementary materials included in this article.