

Abstract
The combination of molecular diagnostic technologies is increasingly used to overcome limitations on sensitivity, specificity or multiplexing capabilities, and provide efficient lab-on-chip devices. Two such techniques, PCR amplification and microarray hybridization are used serially to take advantage of the high sensitivity and specificity of the former combined with high multiplexing capacities of the latter. These methods are usually performed in different buffers and reaction chambers. However, these elaborate methods have a high complexity cost related to reagent requirements, liquid storage and the number of reaction chambers to integrate into automated devices. Furthermore, microarray hybridizations have a sequence dependent efficiency not always predictable. In this work, we have developed the concept of a structured oligonucleotide probe which is activated by cleavage from polymerase exonuclease activity. This technology is called SCISSOHR for Structured Cleavage Induced Single-Stranded Oligonucleotide Hybridization Reaction. The SCISSOHR probes enable indexing the target sequence to a tag sequence. The SCISSOHR technology also allows the combination of nucleic acid amplification and microarray hybridization in a single vessel in presence of the PCR buffer only. The SCISSOHR technology uses an amplification probe that is irreversibly modified in presence of the target, releasing a single-stranded DNA tag for microarray hybridization. Each tag is composed of a 3-nucleotidesequence-dependent segment and a unique “target sequence-independent” 14-nucleotide segment allowing for optimal hybridization with minimal cross-hybridization. We evaluated the performance of five (5) PCR buffers to support microarray hybridization, compared to a conventional hybridization buffer. Finally, as a proof of concept, we developed a multiplexed assay for the amplification, detection, and identification of three (3) DNA targets. This new technology will facilitate the design of lab-on-chip microfluidic devices, while also reducing consumable costs. At term, it will allow the cost-effective automation of highly multiplexed assays for detection and identification of genetic targets.
Introduction
Since the invention of PCR, research in the field of nucleic acid detection technologies has progressed tremendously, allowing for rapid and precise identification of genetic targets. These technologies have resulted in significant advances in infectious disease diagnostics, epidemiology, food safety, and bio-threat detection1, 2. The use of molecular biology methods in biomedical applications has led to improvements in both the management of patients and their health outcome. Nucleic acid detection methods, mainly in human genetics and for infectious diseases, accelerate the detection and/or identification of genetic biomarkers or targets and improve the chances of patient survival 3, 4.
Nucleic acids amplification tests are important tools enabling sensitive, specific, and rapid detection of genetictargets5. Of these techniques, real-time polymerase chain reaction (rtPCR) is the basis for a majority of molecular assays6. However, the usefulness of rtPCR can be limited by the specificity of primers and probes, and also by the genetic variability and number of targets that can be simultaneously detected and identified in a single reaction (typically no more than six) due to overlap of fluorescence spectra3-5, 7.
The number of targets detected and identified can be increased by hybridizing multiplex PCR amplicons onto an array of capture probes 6, 8. Microarrays area preferred method for the detection of multiple targets and these tools are expected to become a significant part of clinical diagnostic testing in the future along with next generation nucleotide sequencing methods9, 10. A major limitation hampering the implementation of microarrays in clinical setups derives from complex workflow, requiring numerous steps from sample to results5, 11. Furthermore, PCR produces double-stranded DNA targets requiring denaturation or preferably digestion of the complementary strand prior to hybridization onto capture probes immobilized on a solid support12, 13. The number of nucleotides in microarray targets is directly correlated with the time to reach hybridization equilibrium. Failure to reach equilibrium results in a stochastic distribution of targets on capture probes leading to variability and reproducibility issues 14. Thus, for rapid and reproducible hybridizations, short targets are desirable. Furthermore, microarray probe design is dependent of the target DNA sequence which can result in cross-hybridization with closely related microorganisms15, 16, not predictable by existing models 17, 18.
The integration of PCR and microarray technologies onto a microfluidic device is desirable to take advantage of each technique while enabling the automation of these complex processes 19. However, these technologies generally require separate steps due to specific reagents and conditions 5, 11. This requires separate liquid handling and reaction chambers resulting in complex design and manufacturing of the device, thereby complicating low-cost integration.
Real-time PCR has become a standard method in the field of molecular diagnostics. However, it is not always suitable for some applications where detection of more than 5-6 targets is necessary. Real-time PCR has traditionally been limited to 5-6 targets because of optical physics limitation in relation to fluorophore specters and filters20 whereas technically microarray based detection are limited by the size of the feature and the overall size of the microarray surface itself. New PCR-based technologies have been recently introduced on the market to overcome those limits. One such technology, the Film Array of BioFire Diagnostics (Salt Lake City, UT) first performs a PCR with the complete sample, then automatically dilutes and splits the resulting mixture into up to 102 wells where a real-time nested PCR reaction can identify the target(s) present in the sample 21. Partly because there are many reagents and reaction chambers to manage, the cost per reagent/test is relatively high at 129$ 22 which could be a limiting factor to its adoption and implementation in clinical setups23. Others have developed oligonucleotide based strategies to increase multiplexing capabilities or to have target sequence independent detection strategies allowing use of universal components. Seegene24 has designed a serial, two amplifications method where a fragment of a nucleic acid probe then serves as a primer for a second amplification with a single-stranded DNA template. Detection and identification is performed by high resolution melting of the second amplicon, which can be custom-made to allow for optimal discrimination of melting curves. However, the reaction mixture contains a significantly higher quantity of DNA sequences than other detection methods which can limit the multiplexing capabilities by creating nonspecific amplification. Faltin et al. 25 have developed a system using a universal reporter comprised of an amplification probe containing a target independent sequence and a separate hairpin oligonucleotide labeled with fluorophore and quencher moieties. The sequence independent segment of the amplification probe serves as a primer for the hairpin structure. Elongation of this secondary primer causes opening of the hairpin resulting in the physical separation of the quencher and fluorophore moieties and emission of fluorescence. However, multiplexing capabilities are not superior to real-time PCR.
In this work, we report a new approach to perform PCR amplification and microarray hybridization in the same reaction chamber and with a single buffer. To achieve this, we have designed labeled structured oligonucleotides called SCISSOHR which adopt a particular secondary structure comprising a first moiety that recognizes a specific target sequence and a second moiety that enables the specific efficient hybridization on a surface-immobilized capture probe (Fig. 1). These SCISSOHRs are used as specific probes during PCR amplification which, upon recognition of their specific complementary sequence, trigger their irreversible structural modification. Modified SCISSOHRs hybridize to microarray capture probes exposed to the reaction medium. Multiplex detection is possible through the use of multiple SCISSOHR probes and spatial localization of different capture probes on the microarray.
Fig. 1. Structured Cleavage Induced Single-Stranded Oligonucleotide Hybridization Reaction probe.

Complementary arm C (slashes) is the reverse-complement to the amplification target and T1.1+T1.2 segment (bold slashes). Loop L (white squares) is complementary to the amplification target but not to other parts of the SO. Tag segment T divided in three parts: T1.1 (bold slashes), T2 (dots) and T1.2 (bold slashes). T1.1 and T1.2 are complementary to the C segment. T2 is complementary to a portion of the microarray capture probe and its sequence can be designed to ensure unique encoding for each amplicon species while ensuring optimal hybridization with immobilized capture probes. Three nucleotides from the 5′ end of T1.2 are also complementary to the capture probe. A quencher (Q = BHQ-2) is positioned on a thymine of the C segment, while a fluorophore (F= Quasar-670) is positioned on a thymine of segment T1.1 within at most 17 nucleotides and in close secondary structure proximity to the quencher. For each target the SO's length segments are described in the table underneath the SCISSOHR probe schematic.
A test capable of identifying multiple targets is an important prerequisite for pathogen detection in clinical situations where different organisms can produce serious and similar symptoms such as low respiratory tract infection 3, 26. We present a proof-of-concept multiplex amplification and hybridization assay with SCISSOHR technology for the detection of three important human respiratory viruses: influenza A (FluA) virus, influenza B (FluB) virus, and respiratory syncytial virus (RSV).
Materials and methods
Function of SCISSOHR probes
A SCISSOHR probe is composed of three (3) main segments forming a hairpin structure (Fig. 1). One segment, complementary (C) to the target strand, constitutes one half of the stem, while the second segment is also complementary to the target strand but forms the main loop(L) of the SCISSOHR probe. The third segment serves two functions: 1° it completes the stem part with the first segment, and 2° it contains a tag (T) sequence complementary to the microarray capture probe. The tag and capture probe possess a different sequence than the target recognized by the SCISSOHR probe. Microarray hybridization is thus independent from target sequences since the SCISSOHR oligonucleotide serves as an indexing probe between aqueous phase targets and solid-support capture probes. A fluorophore and a quencher moieties are present on the SCISSOHR probe and are within FRET distance in the sequence and secondary structure27, 28. This proximity ensures sufficient quenching in all conformations. Finally, a phosphate moiety is added at the 3′-end of T1.2 to prevent elongation29, 30.
Figure 2 illustrates the concept of the indexing probe, as well as the use of the secondary structure when the probe is subjected to PCR reaction either containing a target (Fig. 2A) or not (Fig. 2B). When a target is present, segments C and L are digested, separating the quencher from the fluorophore, and concomitantly releasing an indexed tag for microarray hybridization. When no target is present, the SCISSOHR probe is not digested and the quencher remains in close proximity to the fluorophore. Furthermore, in microarray hybridization conditions, the SCISSOHR probe is designed to preferentially adopt a hairpin conformation over hybridization of T2 and the first three nucleotides 5′ of T1.2 to the capture probe. This limits the number of undigested SCISSOHR probes hybridized on capture probes and keeps Q in close proximity to F for optimal quenching.
Fig. 2. Schematics of the SCISSOHR biodetection system.
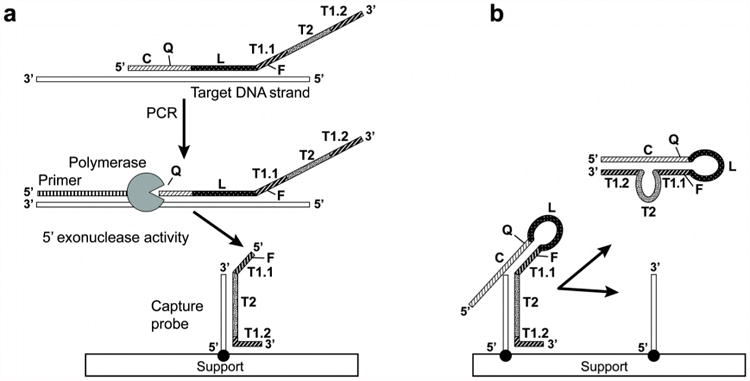
A) When an amplification target is present (white), the SCISSOHR probe opens and the C (slashes) and L (white squares) parts hybridize to the target. A thermostable DNA polymerase with both extension and 5′->3′exonuclease activities (circle with missing sector) recognizes the primer (hashes) and extends (hashes) the strand until it reaches the SCISSOHR probe-target complex and digests the C and L segments, releasing the quencher and releasing the T segment. The released segment T1.1+T2+T1.2 then hybridizes to a microarray capture probe (white) and fluorescence from F is read.
B) No amplification target is present; the SCISSOHR probe is not digested. During thermal cycling, the SCISSOHR probe opens and may hybridize with the microarray capture probe, theoretically creating an equilibrium between the open (T2+ 3 first nt in 5′ of T1.2 available for hybridization with capture probe) and the structured conformation (when segment C is hybridized to T1.1+T1.2) where quencher Q is in close proximity to fluorophore F. The structured conformation is favored, resulting in low fluorescence from F on the microarray.
Design of SCISSOHR probes
The C+L segments sequences are designed using conserved regions found on the genetic target. It should be approximately 27 to 31 nucleotides long. Its Tm should be of approximately 70°C, i.e. at least 10°C above the annealing temperature of the primers. The C segment was fixed at the minimal length to form a hairpin structure in the presence of T1.1+T1.2 from the same oligonucleotide while limiting intermolecular interactions with T1.1+T1.2 from another identical SCISSOHR probe. The optimal length for C was set at 16 to 18 nucleotides. The T1.1 and T1.2 segments are complementary to the full length of the C segment. They are separated by the T2 segment in roughly equal lengths. The T2 segment bears an artificial sequence carefully selected for having minimal interactions with other sequences on the microarray. It consists of 14 nucleotides with a G+C content of 35-40%. These sequences were inserted between the T1.1 and T1.2 segments. All SOs are described in Table 1.
Table 1. Structural and thermodynamic properties of the SCISSOHR probes used for amplification and hybridization.
| Virus | Genetic target | Nucleotide sequencea | Length (nt) | SOs | Tm on targetc (°C) | |
|---|---|---|---|---|---|---|
|
| ||||||
| Tmb (°C) | ΔG (kCal/mol) | |||||
| FluA | Matrix | 5′-GGAAAGAGGGCCTTCTACGGAAGGAGTGTAGAAGGATACAACATACTTCCCCTCTTTCC-3′ | 59 | 62.7 | -2.21 | 69.2 |
| FluB | Matrix | 5′-GGTGTCTCATGGTCATGTACCTGAATCCTGGACATGACCAATTTCTCTTCGGGATGAGACACC-3′ | 63 | 64.0 | -2.70 | 67.5 |
| RSV | Nucleocapsid | 5′-GTGGCTCCAGAATACAGGCATGACTCTCCTGTATTCTACTTTCCAAGAATGGGAGCCAC-3′ | 59 | 64.4 | -2.29 | 70.3 |
highlighted nucleotides represent labeled nucleotides (quencher and fluorophore)
Tm: melting temperature
Tm of the C and L part on the genetic target
Modeling the theoretical hybridization behavior of SCISSOHR probes
The resulting assemblies and the PCR primers were loaded in Plexiglad, a homemade software designed to calculate intermolecular interactions based on the model of Preparata and Oliver 31. This was done to select the best T2 sequence showing minimal SCISSOHR-SCISSOHR probes interactions (ΔG > -8 kcal/mol, ΔG > -6 kcal/mol for 3′ interactions) and minimal primer-SCISSOHR probe interactions (ΔG > -5 kcal/mol). The best T2 sequence could be modified manually to limit undesirable interactions. The chosen T2 sequence was submitted to BLAST to ensure that it is not significantly complementary to a sequence present in the genome of the target organism. Afterwards, the chosen SCISSOHR probe sequence was tested using Mfold32 to confirm the folding pattern and calculate Tm and ΔG of putative secondary structures. The hairpin structure must have a Tm 5 to 8°C below that of C+L Tm and ΔG < -2 kcal/mol. Parameters used for Mfold were: 50 mM Na+, 2.5 mM Mg2+ and folding temperature of 57°C. The position of T2 between T1.1 and T1.2 could be adjusted to ensure proper folding by moving 1 or 2 nucleotides from one segment to another. In some cases, a GG stretch was added at the 5′-end of the C segment, while a CC stretch was added to the 3′-end of T1.2 for SCISSOHR probes that did not properly fold on the extremities. Capture probes were designed to have a lower Tm than that at which the SCISSOHR probe structure opens. They are complementary to T2 plus the first 3 nucleotides at the 5′ end of T1.2.
Model targets
Approximately 200 viruses are known to cause respiratory symptoms nearly indistinguishable by clinical diagnosis8, 33. Clearly, rapid multiparametric diagnostics is essential to precisely identify the pathogen(s) associated with a respiratory tract infection, for adequate and timely treatment selection and epidemiological purposes. As a proof of concept of our technology, we have developed an assay targeting respiratory viruses FluA, FluB, and RSV. FluA and FluB are the most prevalent viruses in adults 34 while RSV is the most prevalent virus in children35.
PCR
PCR mixtures were made with 5 different commercially-available buffers to validate their compatibility with microarray hybridization. The buffers used were those provided with the GoTaq (Promega, Madison, WI), HotGoldStar (Eurogentec, Liège, Belgium), KlenTaq(PC2 buffer, DNA Polymerase Technology, St-Louis, MO), AptaTaq (Roche Applied Sciences, Laval, QC), and One-step RT-PCR (Life Technologies, Burlington, ON) enzymes or reagent kits (Table 4). All other amplifications were performed with the GoTaq buffer and enzyme. A master mix for the multiplex assay targeting FluAFluB and RSV was prepared with the three specifics SCISSOHR probes at 0.1 μM/reaction and with three specific primer pairs(Table 2) at 0.4 μM/reaction. DNA plasmids containing either the cloned matrix gene of human FluA, human FluB, or the nucleocapsid gene of RSV were used at 104 copies/reaction. Concentrated plasmids at 1010 copies/μl were serially diluted to a final concentration of 104 copies/μl in TE 1×, then 1μl of that mixture was added to PCR reactions for a final volume of 25 μl. A reaction mix containing SCISSOHR probes and microarray capture probes without target DNA was used as a negative control. Amplifications were carried in Rotor-Gene 6000 thermal cycler (Corbett Research, Mortlake, Australia) under the following conditions: a denaturation step of 3 min at 94°C followed by 40 cycles of 5 sec at 95°C, 20 sec at 57°C, and 20 sec at 72°C.
Table 4. Composition of master mix and PCR buffer.
|
|
|||||||
|---|---|---|---|---|---|---|---|
| GoTaq buffer | PC2 buffer | AptaTaq buffer | Hot Gold Star buffer | RT-Invitrogen buffer | Homemade RT-buffer a | ||
| Buffer composition | Tris-HCl (mM) | 10 | 50 | 50 | 15 | na | - |
| Tris-SO4 (mM) | - | - | - | - | na | 60 | |
| KCl (mM) | 50 | - | 10 | 50 | na | 40 | |
| (NH4)2SO4 (mM) | - | 16 | 5 | - | na | 18 | |
| MgCl2 | - | 3.5 | - | - | na | - | |
| Triton (%) | 0.1 | - | - | - | na | - | |
| Tween 20 (%) | - | - | - | 0.01 | na | - | |
| DTT (mM) | - | - | - | - | na | 1 | |
| pH | 9.0 | 9.1 | 8.3 | 8.0 | na | 9.1 | |
|
| |||||||
| Added to master mix | MgCl2 (mM) | 2.5 | 2.5 | 3.5 | 3.5 | - | 1.6 |
| BSA (mg/ml) | 3.3 | 3.3 | 3.3 | 0.3 | - | 0.66 | |
| dNTPs (mM) | 0.2 | 0.2 | 0.2 | 0.2 | - | 0.2 | |
| (NH4)2SO4 (mM) | - | - | - | - | 8 | - | |
| KCl (mM) | - | - | - | - | 14 | - | |
| Rnasin Inhibitor (U)b | - | - | - | - | 0.3 | - | |
| Superscript 111/platinum (U)b | - | - | - | - | 0.04 | - | |
Homemade RT-buffer is the deducted composition of One step RT-PCR using patent data and empirical testing
No enzymes were added to the master mixes except for One step RT-PCR because hybridization did not work without Rnasin Inhibitor and Superscript 111/platinum.
Table 2. Primers used for PCR amplification.
| Genetic target | Primer name | Nucleotide sequencea | Length (nt) | Tmb(°C) |
|---|---|---|---|---|
| FluA matrix | mxHinfA796b | 5′-GCACCTGATATTGTGGATTACTGAT-3′ | 25 | 61.0 |
| mxHinfA896i | 5′-GATAYTCTTCCCTCATRGACTC-3′ | 22 | 58.9 | |
| FluB matrix | mxHinfB328 | 5′-CATGAAGCATTTGARATAGCAGA-3′ | 23 | 57.4 |
| mxHinfB457a | 5′-CTGTGTGARTGTGATGCTTGTTT-3′ | 23 | 59.2 | |
| RSV nucleocapsid | nuHRSV399 | 5′-GAATCTAGAAARTCCTACAAAAAAATGCT-3′ | 29 | 59.0 |
| nuHRSV510a | 5′-CCTGCTGCTAATTTRGTTATTAC-3′ | 23 | 57.4 |
Y: C or T, R : A or G
Tm: melting temperature
Microarray fabrication
Capture probes (Table 3) were spotted at 30 μM in Arrayit printing buffer (Array it Corporation, Sunnyvale, CA) onto Aldehyde Plus array slides (Molecular Devices, Sunnyvale, CA) or custom-made Zeonor® 1060R using an Omnigrid microarray spotter (Digilab, Marlborough, MA) and SMP2 Pins (Arrayit Corporation, Sunnyvale, CA). Zeonor® microarrays were cut into subarrays small enough (approximately 2 × 5 mm) to fit into 0.2-mL microcentrifuge tubes. Labeled probes were printed on the microarray at a specific concentration of 7.5 μM to control printing and to compare microarrays fluorescence on the optical set-up.
Table 3. Capture probes used for microarray hybridization.
| Complementary | Capture probe name | Nucleotide sequence | Length (nt) | Tma (°C) |
|---|---|---|---|---|
| FluA SCISSOHR tag | A-S-FluA-T2-T1.2r | 5′-GGGGAAGTATGTTGTAT-3′ | 17 | 52.4 |
| FluB SCISSOHR tag | A-S-FluB-T2-T1.2a | 5′-CATCCCGAAGAGAAATT-3′ | 17 | 52.4 |
| RSV SCISSOHR tag | A-S-HRSV-T2-T1.2a | 5′-TCCCATTCTTGGAAAGT-3′ | 17 | 52.4 |
| Not applicable | Negative control | 5′-TTCGCTGAACAGGTAAAAGT-3′ | 20 | 56.3 |
Tm: melting temperature
Hybridization
To evaluate the efficiency of amplification buffers to enable DNA hybridization, Aldehyde Plus array glass slides (Molecular Devices, Sunnyvale, CA) were used. The five PCR buffers listed previously were used as hybridization buffers. Hybridizations were performed at 40°C to compensate for the absence of formamide. We compared the results to a hybridization buffer (Hybbuffer) with a final concentration of 6× saline-solution-phosphate-EDTA (SSPE), 30% formamide, 0.03% polyvinyl-pyrrolidone previously used in other experiments 12, 36. A synthetic oligonucleotide (F-T.1-T2-T1.2) representing the digested form of the FluB SCISSOHR probe was used at a concentration of 0.1 μM/reaction for each tested buffer, which was also the concentration used for undigested SCISSOHR probes in multiplex assays. This concentration was selected after optimization and is comparable to concentrations of Taqmans or molecular beacons in rt-PCR assays. HybriWell hybridization chambers (Grace Bio-Lab, Bend, OR) were used to perform hybridization on Aldehyde Plus array glass slides. For each buffer mix, we loaded 20 μL of their respective master mix in a hybridization chamber in triplicate. Non-specific capture probes were printed on the microarray to validate the specificity of amplification buffers. Amplification buffer hybridizations were carried in a MJ Research PTC 200 thermal cycler (GMI Inc, Ramsey, MN) using a slide hybridization module under the following conditions: 72°C during 3 min and finally 40°C during 10 min. PCR hybridization buffers were used at 40°C while Hyb buffer was used at 23°C. After hybridization, the reaction mixture was removed followed by the disposable chamber, before the microarray slides were spun to dry in a centrifuge. No washing was performed. For SCISSOHR probe digestion and hybridization experiments, Zeonor® 1060R subarrays were deposited inside the 0.2 mL amplification tubes after PCR. Hybridization was performed for 10 min at 40°C. The subarrays were spun dried before fluorescence acquisition. A schematic of the experimental design is shown on Fig. 3.
Fig. 3. Experimental design for multiplexed amplification and hybridization assay with SCISSOHR probes.
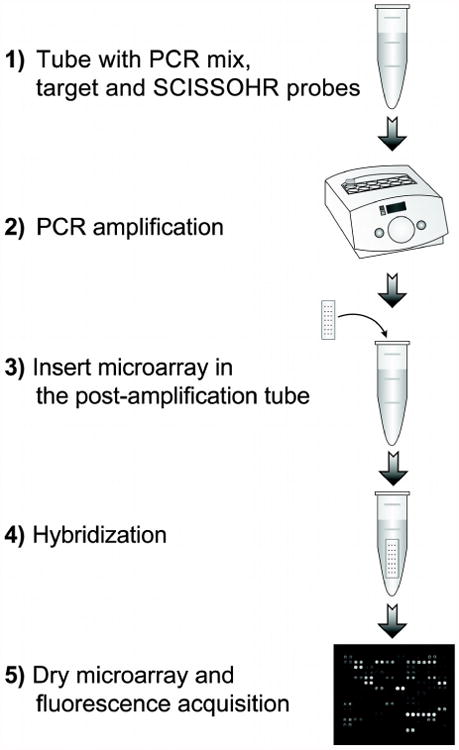
1) Tube with PCR reagents, FluA, FluB, RSV SCISSOHR probes and target. 2) Thermocycling (95°C, 5 sec; 57°C, 20 sec; 72°C, 20 sec; 40 times) to perform PCR amplification and SCISSOHR probes digestion. 3) Insert microarray in the PCR tube. 4) Hybridization (40°C, 10 min) in the PCR tube. 5) Drying and fluorescence acquisition.
Fluorescence acquisition and analysis
Glass slide microarrays were scanned with an Agilent GB2565BA Microarray Scanner System (Agilent Technologies, Inc. Santa Clara, CA). Plastic microarrays were scanned using a custom setup. The excitation source consists of a 627 nm LED (Luxeon Star Red, Quadica Developments, Brantford, ON) with a 615-635 nm bandpass interference filter (Semrock, Rochester, NY). The detector consists of an Apogee Alta U32 camera (Apogee Imaging System, Roseville, CA) with a 696-736 nm bandpass interference filter (also from Semrock). The excitation source and the detector are placed on opposite sides of the plastic microarray. Data acquisition is performed using μManager which runs as a plugin of ImageJ, an open-source image processing and analysis software37. Microarray images were analysed using GenePix Pro software (version 6.1.0.4; MDS Analytical Technologies, Downingtown, PA). From GenePix Pro 6.0 analyses, the foreground raw median signal (Fmed) of the spot and the background raw median signal(Bmed,) around the spot are obtained. The rest of the analyses are performed with homemade software called MINABLE (data mining and analysis, version 6.0/3744). The raw median fluorescence signal (Fmed-Bmed) is calculated for each spot and the interquartile range (IQR) are used to filter data. The outliers (outside of Q2±1.5 × IQR) were eliminated.
For a given assay, printing control spots of negative controls are filtered using IQR. Negative controls having a mean fluorescence from printing control spots outside of Q2±1.5 × IQR were eliminated from further analyses. The fluorescence of the mean printing control spots from positive assays are compared to IQR calculated for the negative control. The mean printing control spots from positive assays outside of the negative Q2±1.5 × IQR are eliminated from analyses. Printing controls from different slides should theoretically produce the same mean fluorescence. Differences between fluorescence intensity from these printing control spots can be attributable to variability in excitation conditions of the optical set-up. Extreme results presenting a mean fluorescence of printing control spots outside of Q2±1.5 × IQR are eliminated from microarray analysis. For each capture probe, the mean fluorescence of a positive assay is compared to that of the negative control, and a Student's t-test is performed to establish if a significant difference is observed between a positive assay and a negative control. A ratio (mean fluorescence from positive assay capture probes divided by the mean fluorescence from negative control capture probes) is calculated for each capture probe. Finally, a threshold ratio was calculated using the mean ratio of capture probes recognizing viruses absent from the reaction (example: FluB and RSV capture probes in the FluA assay) and adding 2 standard deviations to establish the analytical limit of detection at 95% confidence.
Results and discussion
To demonstrate the potential of this new technology, we first describe how the design enables the SCISSOHR probes to adopt a hairpin-like structure through specific recognition of the T1.1 and T1.2 segments to the C segment (fig. 1). In this conformation, the T2 segment is unavailable for microarray hybridization. This secondary structure must be adopted for temperatures of at least up to 60°C so it only ever opens during thermal cycling of PCR amplifications. During elongation, the SCISSOHR probe opens and C+L segments are available for hybridization to the target DNA. It is only through specific recognition of the target DNA that the opened SCISSOHR probe will be digested, irreversibly changing its conformation so the T2 segment is freely available for hybridization onto the microarray surface at temperatures lower than 60°C (fig. 2). This enables coupling of specific PCR amplification with Cartesian coordinates based multiplexed microarray detection. Furthermore, because the tag segment T2 is an artificially chosen sequence, independent of target DNA, microarray hybridization is never dependent on discrimination of closely related sequences. To confirm the SCISSOHR technology functions as intended through design, we validated microarray hybridization of the Tag segment in PCR buffers, which are magnesium ions based instead of sodium ions based in traditional hybridization buffers. Finally, as a proof of concept, we demonstrated the SCISSOHR probes could be used to identify one of three respiratory viruses in a multiplexed assay. This new technology combines PCR amplification and microarray hybridization into a single reaction chamber, that reduces the risk for cross hybridization on immobilized capture probes by using single-stranded indexed tags and that is amenable to a single-step procedure.
Design of SCISSOHR probes
SCISSOHR probes are complex biodetection macromolecules which must be designed to accommodate different considerations such as synthesis, chemical bonding with other SCISSOHR probes, and biomolecular interactions with PCR primers and target genomic DNA. Target sequences must also be considered to obtain C+L segments with sufficiently high melting temperature while being relatively short (maximum length of approximately 30 nucleotides; see Fig. 1). Melting temperature for the double loop hairpin must also be sufficiently high, while the Gibbs free energy must be sufficiently low to favor the closed conformation in absence of target and minimize the background noise caused by hybridization of the T2 segment from an undigested SCISSOHR probe. To allow more flexibility in the design, the introduction of locked nucleic acids (LNA) in the sequence should be investigated since these nucleotide analogs induce a higher Tm than the standard bases 38. A computer program is also under construction to automate the design of SCISSOHR probes while taking into account sequence alignments to obtain desired specificity and ubiquity. The protocol for the design of SCISSOHR probes was applied to respiratory viruses as a proof of concept, but it can be easily and quickly adapted for the detection of other microbial targets.
The non-target related sequence of segment T2 allows for optimization of hybridization parameters between different targets, to ensure that sequence-dependent effects and cross hybridization are minimized. Extensive testing of 14-mer oligonucleotide T2 sequences and capture probes will provide a pool of optimized T2 readily available for integration into SCISSOHR probes.
The use of microarrays as the final detection method is advantageous in its requirements of fluorescence. It enables multiplexed detection using only one fluorophore. From a practical point of view, this facilitates optical instrument design by necessitating a single laser/filter combination while offering a high multiplexing capacity, resulting in lower manufacturing cost. Also, validation of performance and quality control of components are simplified because only one fluorophore need to be tested.
Hybridization in amplification buffers
Five different amplification buffers were used to determine if they can also provide ionic conditions supporting molecular hybridization of amplification products to immobilized oligodeoxyribonucleotide capture probes. Amplification buffers generally contain monovalent and divalent cations in the low millimolar range (Table 4) while hybridization buffers contain monovalent cations in the low molar range (previously described in Materials and methods). Hybridization signals obtained for each amplification buffer were compared to the hybridization signal obtained with the Hyb buffer (Fig. 4) using the synthetic tag segment of FluB. While the RT-Invitrogen buffer yields a hybridization signal (∼3500 arbitrary fluorescence units [a.u.]) comparable to that of the Hyb buffer (∼2500 a.u.), the AptaTaq (∼20000 a.u.), HGS (∼20000 a.u.), Promega (∼20000 a.u.) and PC2 (∼40000 a.u.) buffers yielded much stronger hybridization signals. Non-specific capture-probes did no yield any signal distinguishable from background noise of the microarray.
Fig. 4. Fluorescence signal for hybridization of the SCISSOHR tag segment in five amplification buffers.
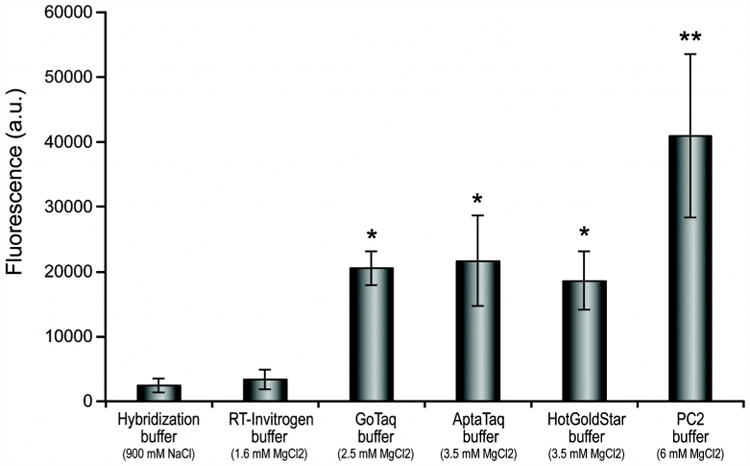
Hybridization of 0.1 μM T1.1+T2+T1.2-F segment representing the digested SCISSOHR probe form in five PCR master mixtures with buffers having different compositions, notably with regards to the Mg2+ concentration. Hybridization on glass slides were performed in triplicate. Mean fluorescence is shown for each buffer and error bars represent the standard deviation. The interquartile range (IQR) was used to filter data. Aberrant data located outside of Q2±1.5 × IQR were eliminated prior to analysis. * The difference between these buffers and the Hybridization buffers or the RT-Invitrogen buffer is statistically significant (p-value ≤ 0.01). ** The difference between the PC2 buffer and all other buffers is statistically significant (p-value ≤ 0.01).
Hybridization seems influenced by the concentration of MgCl2; indeed, AptaTaq, GoTaq, and HGS buffers have similar concentrations of MgCl2 and the fluorescence signals observed after hybridization in their presence is also similar (∼20000 a.u.). PC2 buffer has roughly twice the concentration of MgCl2 of Aptataq, HGS, and GoTaq buffers, and which results in a ∼2-fold increase in hybridization signal (∼40000 a.u.). The RT-Invitrogen buffer has approximately half the concentration of MgCl2 of the AptaTaq, HGS, and GoTaq buffers, thereby negatively affecting hybridization signal which are five times lower (∼3500 a.u.) than those observed after molecular hybridization in AptaTaq, HGS, and GoTaq buffers. The capture probes specific to the other two SCISSOHR tags as well as negative control capture probes did not yield fluorescence signals above the background and could not be detected by the GenePix software.
Experiments performed with short oligonucleotides hybridizing to a glass slide microarray suggest that PCR buffers are compatible with the molecular hybridization process. However, the concentration of Mg2+ ions is critical to yield an optimal hybridization signal and a careful adjustment of magnesium concentration should be done to provide the best amplification and hybridization conditions of each assay. Furthermore, other researchers 39, 40 suggest that magnesium ions in the low millimolar range (1.5-15 mM) and the absence or presence of sodium ions in low concentration (0-50 mM) are optimal for mismatch discrimination. This suggests that traditional hybridization solutions and washing buffers devoid of magnesium are not as efficient for hybridization specificity. However, PCR amplification is not compatible with the presence of 30% formamide (used for room temperature hybridization), thereby introducing the requirement of a heat source to perform hybridization. In our system, this limitation is inconsequential since our SO-based hybridization procedure can be performed within the operational confines of the PCR thermal cycler instrument immediately at the end of the amplification.
Single-vessel multiplexed amplification and hybridization
SCISSOHR probes targeting respectively one of three different respiratory viruses (FluA, FluB, and RSV) were added to a PCR reaction containing primers capable of producing amplicons specific to each virus. Amplification in the presence of one viral target gene was performed prior to the addition of a Zeonor® subarray to prevent the temperature-induced warping of the plastic substrate. Hybridization occurred within the same reaction vessel using the amplification buffer. The amplification of targets resulted in the irreversible modification of SCISSOHR probes which can be observed by a significant fluorescence increase when the specific target is present while no significant increase can be observed in absence of SCISSOHR targets. For target-specific capture probes, statistically significant differences in fluorescence and ratios of positive assays over negative control assays of 1.8, 2.5, and 2.1 were obtained respectively for FluA, FluB, and RSV (Fig. 5). In contrast, SCISSOHR probes and capture probes recognizing targets absent from the reaction mixture were not significantly different between positive and negative assays, except for FluA capture probes in the RSV assay. However, the ratio for this capture probe was only 1.23, which is under the analytical limit of detection ratio of 1.31.These results also further confirmed that the GoTaq PCR buffer is compatible with microarray hybridization. Although further work should improve the fluorescence ratio of positive assays over negative control targets by offering a more robust optical detection platform and enabling temperature control of the microarray surface until fluorescence acquisition, it is worth comparing these ratios to traditionally accepted ratios to differentiate between overexpression and underexpression of genes for in expression analysis microarray. A ratio of 1.5 or more typically 2 is considered sufficient to differentiate with certainty the level of expression of a gene in a reliable fashion41, 42. Ratios currently observed with our structured oligonucleotide technique are within ranges of accepted microarray differentiation ratios.
Fig. 5. Microarray fluorescence signal obtained for FluA, FluB, and RSV multiplex assays.
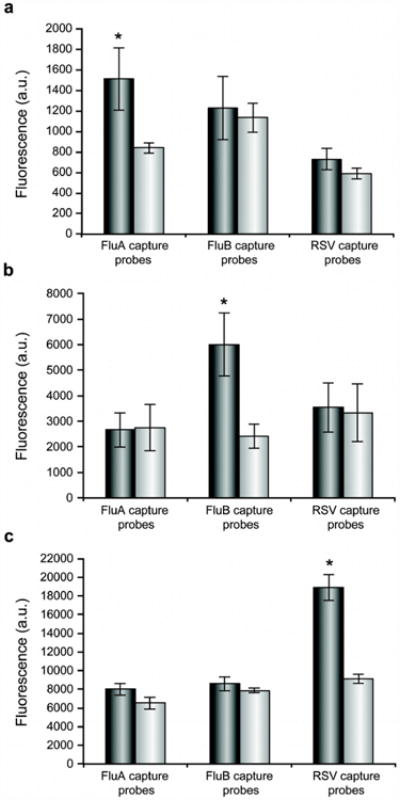
For each graph, the gray columns represent the mean fluorescence signals obtained for each capture probe used for positive assays. The white columns represent the means fluorescence signal obtained on each of the three capture probe for negative controls (no target). It represents the background.
A) FluA multiplex assay: For the three graphs the gray columns n=4 and for the white columns n=2.
B) FluB multiplex assay: For the three graphs the gray columns n=3 and for the white columns n=3.
C) RSV multiplex assay: For the three graphs the gray columns n=3 and for the white columns n=3. * The difference between positive and background signal are statistically significant (p-value ≤ 0.04).
Multiplexing capabilities have up to now been demonstrated with only 3 different targets, however, the size of the microarray could allow for over 100 features which can translate to 20-30 different targets with replicates. Considering our fluorescence ratios are comparable to ratios obtained with microarrays containing up to 106 features43. We are confident we will reach multiplexed levels of 20 to 30 targets. However, intermolecular interactions between the SCISSOHR probes and primers will ultimately be a challenge and place an upper limit on multiplexing capabilities of the technique. Furthermore, since the C+L segments are relatively long (27-31-nt), it is unclear whether single nucleotide polymorphism detection will readily be achievable considering the design constraints of the SCISSOHR probes. The detection of targets possessing signature genes that are sufficiently diverging from the other targets such as is the case for respiratory viruses does seem very promising however. The SCISSOHR technique will also need to explore its capacity to detect coinfections of viruses which can happen in between 11 to 20% of the time. However, some studies have shown that most of these co-infections (over 75%) are caused by adenoviruses and picornaviruses. Codetection will be tested when these viruses will be added to the assay44.
The sensitivity of the method remains to be tested and optimized since 104 copies of target DNA were used for nucleic acid amplification. Further optimization of reaction conditions is still required. However, a more robust detection system allowing for constant, reproducible, and stable immobilization of microarrays at a fixed distance from the source and the detector must be developed before optimization can advance. The SCISSOHR amplification and hybridization procedure is presently performed in two steps since the shape of the Zeonor subarray is modified when immersed in a liquid solution at 95°C, thus it must be added only after thermal cycling is over. There are other technologies trying to integrate enzymatic amplification and microarray hybridization into single vessels such as Li et al. and Alere Technologies GmbH. However, these approaches use amplification products and capture probe sequences are thus dependent from target sequences whereas our technology allows for most of the capture probes sequences to be independent from target sequences for optimal hybridization parameters. Furthermore, these existing technologies require costly injection molds not commercially available or are not resistant to PCR temperature conditions. We are aware that further collaborations with thermoplastic scientists and molding investments are necessary to fully integrate amplification and hybridization in 1 a single step reaction. With such a device, the entirety of the assay could be performed in closed tubes which reduce amplicon contamination risks.
Conclusion
We have modeled and designed a structured oligonucleotide that can be irreversibly modified by a thermostable DNA polymerase in presence of its specific target. This modification results in the indexing of targets into short oligonucleotides complementary to capture probes immobilized on a surface. Partial selection of capture probes independently from target sequences facilitates microarray designs. The main advantages of the SCISSOHR technology in comparison to other existing multiplexed technologies are the following: specificity is derived from a triple recognition event during PCR amplification, microarray cross-hybridization can be minimized by selecting capture probe sequences independently from target sequences, microarray hybridization is performed between a single-stranded oligonucleotide target and a single-stranded capture probe, a single fluorophore is necessary for detection of multiplexed assays. And finally, combination of PCR amplification with microarray hybridization into a single reaction vessel with minimal reagent handling and storage requirements will simplify the design of an integrated diagnostic device and should drive down the cost of consumables. Furthermore, we have determined that several PCR buffers with magnesium concentrations ranging from 1.6 to 6 mM are compatible with microarray hybridization. Optimization, automation of SCISSOHR probes design, and compatibility with RNA templates are ongoing.
Acknowledgments
We thank Jean-Luc Simard and Dominique Boudreau for their help in designing oligodeoxyribonucleotides, and Luc Bissonnette for critical reading of the manuscript. We thank Professor Denis Boudreau, Hugo Lemieux and David Béliveau-Viel for their help and use of a custom optical setup to acquire microarray fluorescence. Finally, we thank FrédéricRaymond and Gale Stewart for their input in statistical analysis. This work was supported by Grant #5R01 AI089541-02 of the National Institutes of Health (NIH) and SOVAR, Inc.
Footnotes
Financial Disclosures: None declared
References
- 1.Liu Q, Bai Y, Ge Q, Zhou S, Wen T, Lu Z. Clinical chemistry. 2007;53:188–194. doi: 10.1373/clinchem.2006.071720. [DOI] [PMC free article] [PubMed] [Google Scholar]
- 2.Zhao Z, Diaz-Quijada GA, Peytavi R, LeBlanc É, Frenette J, Boivin G, Zoval JV, Madou M, Dumoulin MM, Veres T, Bergeron MG. MRS Online Proceedings Library. 2006;950:null–null. [Google Scholar]
- 3.Bissonnette L, Bergeron MG. Clinical Microbiology Newsletter. 2012;34:159–168. [Google Scholar]
- 4.Lehmann LE, Herpichboehm B, Kost GJ, Kollef MH, Stuber F. Crit Care. 2010;14:R186. doi: 10.1186/cc9294. [DOI] [PMC free article] [PubMed] [Google Scholar]
- 5.Ullrich T, Ermantraut E, Schulz T, Steinmetzer K. PloS one. 2012;7:e35438. doi: 10.1371/journal.pone.0035438. [DOI] [PMC free article] [PubMed] [Google Scholar]
- 6.Endimiani A, Hujer KM, Hujer AM, Kurz S, Jacobs MR, Perlin DS, Bonomo RA. Clin Infect Dis. 2011;52(Suppl 4):S373–383. doi: 10.1093/cid/cir054. [DOI] [PMC free article] [PubMed] [Google Scholar]
- 7.Avolio M, Diamante P, Zamparo S, Modolo ML, Grosso S, Zigante P, Tosoni N, De Rosa R, Stano P, Camporese A. Shock. 2010;34:27–30. doi: 10.1097/SHK.0b013e3181d49299. [DOI] [PubMed] [Google Scholar]
- 8.Miller MB, Tang YW. Clin Microbiol Rev. 2009;22:611–633. doi: 10.1128/CMR.00019-09. [DOI] [PMC free article] [PubMed] [Google Scholar]
- 9.Li X, Quigg RJ, Zhou J, Gu W, Nagesh Rao P, Reed EF. Curr Genomics. 2008;9:466–474. doi: 10.2174/138920208786241199. [DOI] [PMC free article] [PubMed] [Google Scholar]
- 10.Sibley CD, Peirano G, Church DL. Infect Genet Evol. 2012;12:505–521. doi: 10.1016/j.meegid.2012.01.011. [DOI] [PMC free article] [PubMed] [Google Scholar]
- 11.Cooney C, Sipes D, Thakore N, Holmberg R, Belgrader P. Biomed Microdevices. 2012;14:45–53. doi: 10.1007/s10544-011-9584-9. [DOI] [PMC free article] [PubMed] [Google Scholar]
- 12.Boissinot K, Huletsky A, Peytavi R, Turcotte S, Veillette V, Boissinot M, Picard FJ, m AE, Bergeron MG. Clinical chemistry. 2007;53:2020–2023. doi: 10.1373/clinchem.2007.091157. [DOI] [PubMed] [Google Scholar]
- 13.Brinker A, Schulze H, Bachmann T, Moller R. Biosens Bioelectron. 2010;26:898–902. doi: 10.1016/j.bios.2010.07.011. [DOI] [PubMed] [Google Scholar]
- 14.Carletti E, Guerra E, Alberti S. Trends Biotechnol. 2006;24:443–448. doi: 10.1016/j.tibtech.2006.07.006. [DOI] [PubMed] [Google Scholar]
- 15.Carter SL, Eklund AC, Mecham BH, Kohane IS, Szallasi Z. BMC Bioinformatics. 2005;6:107. doi: 10.1186/1471-2105-6-107. [DOI] [PMC free article] [PubMed] [Google Scholar]
- 16.Tezak Z, Ranamukhaarachchi D, Russek-Cohen E, Gutman SI. Hum Genomics. 2006;2:236–243. doi: 10.1186/1479-7364-2-4-236. [DOI] [PMC free article] [PubMed] [Google Scholar]
- 17.Yilmaz LS, Loy A, Wright ES, Wagner M, Noguera DR. PloS one. 2012;7:e43862. doi: 10.1371/journal.pone.0043862. [DOI] [PMC free article] [PubMed] [Google Scholar]
- 18.Pozhitkov A, Noble PA, Domazet-Loso T, Nolte AW, Sonnenberg R, Staehler P, Beier M, Tautz D. Nucleic Acids Res. 2006;34:e66. doi: 10.1093/nar/gkl133. [DOI] [PMC free article] [PubMed] [Google Scholar]
- 19.Schudel BR, Tanyeri M, Mukherjee A, Schroeder CM, Kenis PJ. Lab Chip. 2011;11:1916–1923. doi: 10.1039/c0lc00342e. [DOI] [PubMed] [Google Scholar]
- 20.Fu G, Miles A, Alphey L. PloS one. 2012;7:e30340. doi: 10.1371/journal.pone.0030340. [DOI] [PMC free article] [PubMed] [Google Scholar]
- 21.Poritz MA, Blaschke AJ, Byington CL, Meyers L, Nilsson K, Jones DE, Thatcher SA, Robbins T, Lingenfelter B, Amiott E, Herbener A, Daly J, Dobrowolski SF, Teng DH, Ririe KM. PloS one. 2011;6:e26047. doi: 10.1371/journal.pone.0026047. [DOI] [PMC free article] [PubMed] [Google Scholar]
- 22.Film Array. [Accessed 2013-10-31];The Evidence: Cost Analysis. 2013 http://www.filmarray.com/the-evidence/cost-analysis.
- 23.Allibert P, Peytavi R, Boissinot M. MEMS' Trends. 2013 Jan 12-13; [Google Scholar]
- 24.Shin E, Bae H, Song WK, Jung SK, Hwang YS. Lab Med Online. 3, ch. Korea Med Synapse, Neodin Medical Institute, Seoul, Korea: Korean Association of Medical Journal edn.; 2013. Oct, pp. 234–241. [Google Scholar]
- 25.Faltin B, Wadle S, Roth G, Zengerle R, von Stetten F. Clinical chemistry. 2012;58:1546–1556. doi: 10.1373/clinchem.2012.186734. [DOI] [PubMed] [Google Scholar]
- 26.Foudeh AM, Fatanat Didar T, Veres T, Tabrizian M. Lab Chip. 2012;12:3249–3266. doi: 10.1039/c2lc40630f. [DOI] [PubMed] [Google Scholar]
- 27.Lymperopoulos K, Kiel A, Seefeld A, Stohr K, Herten DP. Chemphyschem. 2010;11:43–53. doi: 10.1002/cphc.200900359. [DOI] [PubMed] [Google Scholar]
- 28.Weiss S. Nat Struct Biol. 2000;7:724–729. doi: 10.1038/78941. [DOI] [PubMed] [Google Scholar]
- 29.Proudnikov D, Yuferov V, Zhou Y, LaForge KS, Ho A, Kreek MJ. J Neurosci Methods. 2003;123:31–45. doi: 10.1016/s0165-0270(02)00325-4. [DOI] [PubMed] [Google Scholar]
- 30.von Ahsen N, Oellerich M, Armstrong VW, Schutz E. Clinical chemistry. 1999;45:2094–2101. [PubMed] [Google Scholar]
- 31.Preparata FP, Oliver JS. J Comput Biol. 2004;11:753–765. doi: 10.1089/cmb.2004.11.753. [DOI] [PubMed] [Google Scholar]
- 32.Zuker M. Nucleic Acids Res. 2003;31:3406–3415. doi: 10.1093/nar/gkg595. [DOI] [PMC free article] [PubMed] [Google Scholar]
- 33.Abed Y, Boivin G. Antiviral Res. 2006;70:1–16. doi: 10.1016/j.antiviral.2006.01.006. [DOI] [PMC free article] [PubMed] [Google Scholar]
- 34.Molinari NA, Ortega-Sanchez IR, Messonnier ML, Thompson WW, Wortley PM, Weintraub E, Bridges CB. Vaccine. 2007;25:5086–5096. doi: 10.1016/j.vaccine.2007.03.046. [DOI] [PubMed] [Google Scholar]
- 35.Papenburg J, Boivin G. Rev Med Virol. 2010;20:245–260. doi: 10.1002/rmv.651. [DOI] [PubMed] [Google Scholar]
- 36.Peytavi R, Liu-Ying T, Raymond FR, Boissinot K, Bissonnette L, Boissinot M, Picard FJ, Huletsky A, Ouellette M, Bergeron MG. Biotechniques. 2005;39:89–96. doi: 10.2144/05391RR01. [DOI] [PubMed] [Google Scholar]
- 37.Edelstein A, Amodaj N, Hoover K, Vale R, Stuurman N. Computer Control of Microscopes Using μManager. John Wiley & Sons, Inc.; 2010. [DOI] [PMC free article] [PubMed] [Google Scholar]
- 38.Koshkin AA, Singh SK, Nielsen P, Rajwanshi VK, Kumar R, Meldgaard M, Olsen CE, Wengel J. Tetrahedron. 1998;54:3607–3630. [Google Scholar]
- 39.Owczarzy R, Moreira BG, You Y, Behlke MA, Walder JA. Biochemistry. 2008;47:5336–5353. doi: 10.1021/bi702363u. [DOI] [PubMed] [Google Scholar]
- 40.Springer T, Sipova H, Vaisocherova H, Stepanek J, Homola J. Nucleic Acids Res. 2010;38:7343–7351. doi: 10.1093/nar/gkq577. [DOI] [PMC free article] [PubMed] [Google Scholar]
- 41.Sinha N, Sharma S, Tripathi P, Negi S, Tikoo K, Kumar D, Rao K, Chatterjee S. BMC systems biology. 2014;8:104. doi: 10.1186/s12918-014-0104-4. [DOI] [PMC free article] [PubMed] [Google Scholar]
- 42.Jia HL, He CH, Wang ZY, Xu YF, Yin GQ, Mao LJ, Liu CW, Deng L. BMC infectious diseases. 2014;14:506. doi: 10.1186/1471-2334-14-506. [DOI] [PMC free article] [PubMed] [Google Scholar]
- 43.Agilent, Agilent Microarray Technology. http://www.genomics.agilent.com/article.jsp?pageId=2011.
- 44.Raymond F, Carbonneau J, Boucher N, Robitaille L, Boisvert S, Wu WK, De Serres G, Boivin G, Corbeil J. J Clin Microbiol. 2009;47:743–750. doi: 10.1128/JCM.01297-08. [DOI] [PMC free article] [PubMed] [Google Scholar]