

Abstract
Clinic and animal studies demonstrated that oral-administrated berberine had distinct lipid-lowering effect. However, pharmacokinetic studies showed berberine was poorly absorbed into the body so that the levels of berberine in the blood and target tissues were far below the effective concentrations revealed. To probe the underlying mechanism, the effect of berberine on biological system was studied on a high-fat-diet-induced hamster hyperlipidemia model. Our results showed that intragastric-administered berberine was poorly absorbed into circulation and most berberine accumulated in gut content. Although the bioavailability for intragastric-administered berberine was much lower than that of intraperitoneal-administered berberine, it had stronger lipid-lowing effect, indicating gastrointestinal is a potential target for hypolipidemic effect of berberine. Metabolomic study on both serum and gut content showed that oral-administrated berberine significantly regulated molecules involved in lipid metabolism, and increased the generation of bile acids in the hyperlipidemic model. DNA analysis revealed that the oral-administered berberine modulated the gut microbiota, and BBR showed a significant inhibition on the 7α-dehydroxylation conversion of cholic acid to deoxycholic acid, indicating a decreased elimination of bile acids in the gut. However, in model hamsters, elevated bile acids failed to down-regulate the expression and function of CYP7A1 in a negative feed-back way. It was suggested that the hypocholesterolemic effect for oral-administrated berberine is involved in its effect on modulating the turnover of bile acids and farnesoid X receptor signal pathway.
Keywords: berberine, bile acids, metabolomics, hamster, gut microbiota
1 Introduction
Berberine, a botanical alkaloid originally isolated from the Chinese herb Coptis chinensis, is known to possess antimicrobial activity directed against bacteria, viruses, fungi, protozoans, and helminthes. It has been widely used as an antimicrobial drug to treat gastrointestinal infections in many Asian countries1-5. Recent studies have demonstrated that berberine also exerts a lipid-lowering effect by activating an AMP-activated protein kinase signaling pathway and increasing low-density lipoprotein (LDL) receptor expression in the liver3, 5-7. However, pharmacokinetic studies have shown that berberine is poorly absorbed through the gut epithelium8-10, and the levels of berberine in the blood and target tissues are far below the effective concentrations used in in vitro cell culture studies. In detail, various studies of berberine either on rats, or mice, or pigs, or hamsters, at any doses (from 45 to 2500 mg/kg) revealed that the maximum concentration of berberine in serum/plasma was no more than 30 ng/ml (mostly average at 15 ng/mL) and less than 100 ng/ml in liver10, 11; while none of the mechanism studies on in vitro cells suggested that the effective level was less than 2500 ng/ml (2500-25000ng/mL) 5-7. Therefore, the current mechanistic hypotheses used to explain the lipid-lowering effect of berberine are insufficient to explain the results of in vivo animal studies and clinical studies orally given with berberine.
Since oral administration of berberine had poor bioavailability, and little of berberine was absorbed into the body, the non-absorbed berberine reserves in the gut. The accumulated berberine in the gut may inevitably affect the physiology and microbiota in gut. As is well known, gut physiology and gut microbiota can not only facilitate the host’s digestion and absorption of nutrients, but also affect lipid metabolism and glycolysis as well12, 13. The effect of berberine on lipid metabolism, gut flora and the turnover of bile acids may play an important role in elucidating the lipid lowering effect of berberine. Metabolomics provides an ideal platform to characterize metabolic patterns involved in perturbation of physiology by various stimuli, either genetic14, or environmental alternation, such as food 15 and xenobiotic drugs or toxins 16, and further to explore underlying mechanism and elucidate biomarkers in different levels, such as systematic/body, local/organs and cellular levels 17-20. Considering that hamsters are an excellent hyperlipidemic model 21, in this study, we employed metabolomics, used a high-fat diet (HFD)-induced hyperlipidemic hamster model to examine whether the lipid-lowering effect of berberine is associated with metabolism of lipids and the turnover of bile acids.
2 Materials and methods
2.1 Chemicals
Berberine (purity > 99%) was purchased from the National Institute for the Control of Pharmaceutical and Biological Products (Beijing, China). All the authentic reference compounds were of analytical grade or chromatography grade, and were purchased from Sigma-Aldrich (St Louis, MO, USA, or Steinhein, Germany), Fluka (Buchs, Switzerland), Merck (Darmstadt, Germany), or Serva (Heidelberg, Germany). Stable-isotope-labeled [13C2]-myristic acid (Cambridge Isotope Laboratories, Andover, MA, USA) was used as the internal standard for the metabolomic profiles. [2,2,4,4-2H4]-Cholic acid, [2,2,4,4-2H4]-taurocholic acid, [2,2,4,4-2H4]-glycocholic acid, was purchased from Sigma-Aldrich. Bio-Bag and AnaeroPack 2.5 L were purchased from Mitsubishi Gas Chemical Company, Inc. (Kyoto, Japan). The alkane series (C8–C40; Fluka) was analyzed under the same chromatographic conditions, using gas chromatography/time of flight mass spectroscopy (GC/TOF-MS) to calculate the retention index of each compound. Methoxyamine (silylation grade; Fluka) and N-methyl-N-trimethylsilyl-trifluoroacetamide + 1% trimethylchlorosilane (Pierce Chemical Company, IL, USA) were added to the GC vials to methoximate and trimethylsilylate the metabolites, respectively. Methanol, acetonitrile, formic acid, and heptane were of chromatography grade.
2.2 Ethics Statement
All the animal experiments were performed with the approval of the Animal Ethics Committee of China Pharmaceutical University. The animal care program at China Pharmaceutical University complies with all federal and state regulations regarding the use and care of experimental animals and with the Public Health Service Policy on the Humane Care and Use of Laboratory Animals, as adopted and promulgated by the United States National Institutes of Health.
2.3 Animal studies
Male LVG Syrian hamsters (eight weeks old; from Vital River Laboratory Animal Technology Co., Ltd, Peking, China) were housed and fed with a standard chow diet (China Experimental Animal Food Standard, GB 14924.2—2001 and GB 14924.3—2001; containing 190 g/kg crude protein; 60 g/kg crude fat; 50 g/kg crude fiber; 16 g/kg calcium; 12 g/kg phosphonium) and tap water ad libitum for two weeks to acclimate them to the environment before the start of the study. The control group continued with the standard diet, whereas the high fat diet (HFD) group was fed an HFD, in which 10% coconut oil (w/w) and 0.5% cholesterol (w/w) was added to the standard diet, for two weeks to induce hyperlipidemia. Serum total cholesterol (TC), triglyceride (TG), high-density lipoprotein–cholesterol (HDL–C), and low-density lipoprotein–cholesterol (LDL–C) levels were measured before (day 0) and after two weeks of the HFD to confirm the establishment of the hyperlipidemic model, as previously described 22
2.4 Treatment of hyperlipidemic hamsters with berberine
After they had been fed the HFD for two weeks, the hyperlipidemic hamsters were randomly assigned to the hyperlipidemic model control group or the berberine group. The berberine group was gavaged with berberine (100 mg/kg) daily for two weeks, and the hyperlipidemic model control and the age-matched normal control groups were given an equal volume of vehicle (0.9% saline). Body weight was recorded every two days. At the end of the treatment, the hamsters were fasted for 16 h and blood samples were collected to isolate the sera. The ceca were recovered immediately after the hamsters were killed.
For phylogenetic analysis of the gut microbiota, the contents of each intact cecum were recovered in sterile tubes, to which was added 2 mL of boiled aqueous solution containing 20% glycerol and 1.8% sodium chloride. They were then pooled according to their origins from the HFDs treated with berberine, or HFDs or the controls, respectively, and formed three groups of samples. An aliquot (50 μL) of each pooled sample was added to a tube from which the air was completely removed by a gentle stream of nitrogen. All samples of gut contents were then stored at −70 °C before analysis. For analysis of bile acids, berberine and its metabolites, the contents of each intact cecum were recovered in a sterile tube and frozen immediately (−70 °C). Hamster gall bladder and cecum content were collected, respectively. Gall bladder was weighed, and bile acids, berberine and its metabolites in bile were determined as reported 11. The livers were harvested for histological inspection as previously described 23. Serum TC, TG, HDL–C, and LDL–C were determined as described 22, using an Olympus AU2700 bichromatic autoanalyzer (Olympus, Tokyo, Japan) in Jiangsu Provincial Hospital of Traditional Chinese Medicine.
2.5 Pharmacokinetic study of berberine administered to hyperlipidemic hamsters
The hyperlipidemic hamsters were randomly divided into four treatment groups: (1) 50 mg/kg berberine administered intragastrically (i.g.); (2) 200 mg/kg berberine (i.g.); (3) 0.5 mg/kg berberine administered intraperitoneally (i.p.); and (4) 2 mg/kg berberine (i.p.). The hamsters were gavaged (i.g.) or injected (i.p.) with berberine daily for two weeks. All hamsters were housed under identical conditions in an aseptic facility, with free access to water and food. On the last day of treatment, the hamsters were housed in metabolic cages and fasted for 16 h. Blood samples of approximately 0.2 mL were collected before (0 time point) or 0.17, 0.33, 0.5, 0.75, 1, 1.5, 2, 3, 4, 6, 8, 12, 24, and 36 h after the intragastric administration of berberine, or 0.03, 0.08, 0.17, 0.33, 0.5, 0.75, 1, 2, 3, 4, 6, 8, 12, 24, and 36 h after the intraperitoneal injection of berberine. The serum levels of berberine were determined by high-performance liquid chromatography–electrospray tandem mass spectrometry (HPLC–ESI-MS/MS) 11. The area under the concentration-time curve (AUC) and the pharmacokinetic parameters of berberine were calculated with the professional pharmacokinetic software DAS (version 2.0, Medical College of Wannan, China). Berberine in liver, bile and gut content were analyzed as previously reported11.
2.6 Phylogenetic analysis of the gut microbiota
The genetic diversity of the hamster intestinal microbial flora was examined in the hyperlipidemic hamsters and the berberine-treated hamsters with a culture-independent clone library 24. DNA from the whole cecum samples was extracted with the FastDNA® SPIN Kit (MP Biomedicals, Solon, OH), according to the manufacturer’s instructions. The DNA extracts from five parallel animals in each group were pooled, and used as the template to amplify the nearly full-length 16S rRNA gene fragments with the universal bacterial primers 8F (5′-AGAGTTTGATCCTGGCTCAG-3′) and 1492R (5′-GGTTACCTTGTTACGACTT-3′). The 50 μL PCR reaction mixture contained 0.75 U of TaKaRa rTaq DNA polymerase (Takara, Dalian, China), 5 μL of 10 × PCR buffer containing 15 mM MgCl2 (Takara), 10 pmol of each primer (Applied Biosystems, Shanghai, China), 200 μM deoxynucleoside triphosphates (dNTPs) (Takara), and 100–200 ng of template DNA. The PCR was performed in a thermocycler (PTC-200, MJ Research Inc., Watertown, USA) using the following thermal profile: initial denaturation for 5 min at 94 °C, followed by 15 cycles of denaturation (94 °C for 1 min), annealing (50 °C for 1 min), and elongation (72 °C for 1.5 min), with a final elongation step at 72 °C for 10 min.
The DNA amplicons were purified with the QIAquick PCR Purification Kit (Qiagen China, Shanghai, China) and used to construct 16S rRNA gene clone libraries for each group using the pGEM-T Easy vector (Promega, USA), according to the manufacturer’s instructions. Approximately 200 positive clones from each library were randomly picked and screened by restriction fragment length polymorphism (RFLP) analysis using the RsaI and HhaI restriction enzymes (New England Biolabs, Beverly, MA, USA). The clones were then classified into different groups according to their RFLP patterns. Several representative clones from different restriction fragment groups were randomly selected and sequenced. After a chimera check in the Ribosomal Database Project (http://rdp.cme.msu.edu/), the cloned sequences were aligned and phylogenetic trees were constructed with the neighbor-joining method using the Molecular Evolutionary Genetics Analysis (MEGA) software version 2.1, and evaluated with a bootstrap analysis (based on 500 resampling replicates) with the SEQBOOT, DNADIST, NEIGHBOR, and CONSENSE 25 programs in the PHYLIP package, version 3.6. Maximum parsimony and maximum likelihood algorithms were used to determine the topological stability of the phylogenetic trees.
2.7 Metabolomic study
A well-developed metabolomic platform based on the GC/TOF-MS technique was used to profile the metabolites in the serum samples from each group, as previously reported, with a few modifications 26. The amount of serum was reduced to 30 μL and extracted with 120 μL of methanol. The supernatants were dried and derivatized for GC/TOF-MS analysis. For extraction and analysis of metabolites in cecal content, cecal content (0.5 g) were added with 1000 μL purified water and vigorously vortexed for 3 min (1:2, w). An aliquots of 50 μL mixture was transferred to an Eppendorf tube, and then 200μL methanol (containing internal standard [13C2]-myristic acid 5μg/mL) was added and vortexed for 3 min. An aliquot of 100 μL supernatant was dried and derivatized for GC/TOF-MS analysis in the same way as that of serum samples. The raw data acquired with GC/TOF-MS were processed, and the metabolites were identified as previously reported 26. The multivariate data were evaluated using the SIMCA P-13 software (Umetrics, Umeå, Sweden). Bile acids, such as cholic acid(CA), glycocholic acid (GCA), taurocholic acid (TCA), deoxycholic acid(DCA), ursodeoxycholic acid(UDCA), lithocholic acid(LCA) and chenodeoxycholic acid (CDCA) were quantitative analysed in Shimadzu LC/MS 2010, equipped with an Aglient ZORBAX SB-Aq column (2.1 × 150 mm, 3.5 μm), Method S1.
2.8 Effect of berberine on the cholic acid 7α--dehydroxylation activity of Clostridium scindens
The 7α-dehydroxylation of cholic acid is a key step in cholic acid metabolism. Therefore, the effect of berberine on cholic acid 7α-dehydroxylation was evaluated in C. scindens, a representative bacterium of the genus Clostridium in the phylum Firmicutes. An overnight culture of C. scindens (ATCC 35704) from a −70 °C frozen stock (33% glycerol) was grown in brain–heart infusion broth (BHI; 37.5 g/L BHI, 10 g/L yeast extract, 40 mL/L salts solution, 1 mL/L resazurin solution, 1 g/L L-cysteine, pH 7.2). All media and buffers were boiled under nitrogen and maintained anaerobically in butyl-rubber-sealed bottles before autoclaving. A 5% inoculum was transferred to 100 mL of BHI containing 100 μM cholic acid and cultivated under anaerobic conditions at 37 °C. Once an optimal density at 600 nm (OD600) of 0.2 was reached, the cells were harvested (5,000 × g, 10 min) and washed in 15 mL of buffer A (20 mM phosphate buffer, 0.5 M NaCl, 5% glycerol, 10 mM 2-mercaptoethanol), then resuspended in 8 mL of buffer A. Berberine was then added (0–25 μg/mL; in vehicle, dimethyl sulfoxide [DMSO]) to 400 μL aliquots of the cell suspension, and injected with a 1 mL syringe into anaerobic serum vials (N2 atmosphere) for preincubation at room temperature. The reactions were initiated by the injection of 600 μL of buffer B (20 mM phosphate buffer, 5% glycerol, 2 mM 2-mercaptoethanol) containing 0.1 μCi [24-14C] cholic acid (American Radiochemicals Inc., St Louis, MO, USA) and 10 μM unradiolabeled cholic acid. After incubation for 10 min at room temperature, the reactions were terminated by the addition of 0.1 mL of 1 N HCl. The bile acids were extracted and separated by thin layer chromatography (TLC), as previously described27. The primary bile acids (cholic acid, 7-oxo-cholic acid) and the secondary bile acids (deoxycholic acid, allodeoxycholic acid, 3-dehydro-deoxycholic acid, 3-dehydro-allodeoxycholic acid) from each treatment were scraped from the TLC plate and quantified by liquid scintillation spectrometry.
2.9 Effect of berberine on the metabolism of cholic acid in fresh gut contents
To examine the metabolism of cholic acid, the fresh gut contents from the HFD hamsters treated with berberine (HFB), the controls treated with berberine (CB), the HFD hamsters (HF), and the controls (C) were diluted and prepared as reported 28. Cholic acid-4H2 (200 μL of 20 μg/mL) was added to each tube of gut flora suspended in cultured medium (1 mL) and the mixtures in tubes were incubated for 6 h. To calculate the percentage reduction in cholic acid, gut contents in medium were sterilized and incubated with cholic acid as a control. Cholic acid was extracted with ethyl acetate and the supernatant was dried. The residue was finally derivatized and analyzed in a Shimadzu QP2010 Ultra/SE (Kyoto, Japan) (Method S2).
2.10 CYP7A1 and CYP27A1 expression in HepG2 cells and hamster hepatocytes
Cholic acid is predominantly synthesized from cholesterol in the liver by two major enzymes, CYP7A1 and CYP27A1. The effects of berberine on the expression of CYP7A1 and CYP27A1 were evaluated in human hepatoma HepG2 cells and hamster liver. The mRNA expression detected by quantitative real-time-PCR and protein expression detected by western blotting (Method S3).
2.11 Statistical analysis
All the data from the biochemical analyses, pharmacokinetic experiments, and metabolomic profiling are expressed as means ± SD. One-way analysis of variance (ANOVA) was used to analyze all the data with the SPSS 16.0 software (SPSS institute, Chicago, USA).
3 Results
3.1 Pharmacokinetics and gastrointestinal accumulation of berberine
An established and clinically relevant hyperlipidemic hamster model was used in this study to evaluate the lipid-lowering effects of berberine and its influence on the composition of the gut microbiota22. Pharmacokinetic parameters, such as the AUC, the maximum concentration (Cmax), and the relative bioavailability of berberine were compared between two routes of administration, intraperitoneal injection (0.5 or 2 mg/kg) and intragastric administration (50 or 200 mg/kg). As shown in Table 1, berberine displayed positive dose-related bioavailability, as measured by AUC and Cmax, when given by intraperitoneal injection; but the AUC and Cmax of the intragastric administered berberine correlated less well to the dose. The AUC and Cmax of the intraperitoneal injection, even at a much lower dose (2 mg/kg), produced a much higher AUC than the intragastric administration of 200 mg/kg berberine, Table 1. This result indicates that only a very small proportion of the intragastrically administered berberine enters the circulation, but most of it accumulates in the gut. In fact, measurement of the amount of berberine in hamster liver and gut content revealed that berberine was mostly accumulated in gut content both in normal hamsters (1.49±0.12 mg/g, n=5) and hyperlipidemic hamsters (1.88±0.10 mg/g, n=5), even after intragastric administration of berberine (100mg/kg, i.g.) for 16 h. While level of berberine was rather low in liver of both normal hamsters (19.6±3.2 ng/g tissue, n=5) and hyperlipidemic hamsters (15.4±3.1 ng/g tissue, n=5).
Table 1.
Pharmacokinetic parameters and pharmacological effects of berberine via two different administration routes (n=5)
| Doses mg/kg weight |
AUC0-36h ng/mL•h |
Cmax ng/mL |
TG-percent decreased % |
TC-percent decreased % |
LDL-percent decreased % |
|---|---|---|---|---|---|
| 50 (i.g.) | 33.2±8.6 | 3.2±0.9 | 42.0±17.2 | 44.1±22.3 | 33.3±9.1 |
| 200 (i.g.) | 54.2±7.6** | 8.0±3.3** | 51.4±16.5 | 60.9±33.9 | 38.8±20.8 |
| 0.5 (i.p.) | 82.3±22.1 | 20.0±9.1 | 44.7±17.3 | 39.5±23.8 | 33.3±25.0 |
| 2.0 (i.p.) | 363.3±99.1†† | 98.0±29.7†† | 50.7±10.0 | 44.4±23.6 | 38.5±12.0 |
Statistical significance relative to 50 mg/kg (i.g.) group,
p < 0.01 (One-way ANOVA; mean ± SD);
Statistical significance relative to 0.5 mg/kg (i.p.) group,
p < 0.01 (One-way ANOVA; mean ± SD).
3.2 Oral-administrated berberine reversed HFD-induced increase in body weight and serum lipids
The high fatty diet-induced (HFD) hypercholesterolemic hamster model has been well characterized and widely used 21. After fed with HFD for two weeks, the hamsters showed marked gain of body weight (159.4±6.5g vs 144.8±6.0g, p=0.00004), significantly elevated serum levels of TC, TG, HDL–C, and LDL–C, Figure 1. However, as compared with HFD controls, treatment with berberine (100 mg/kg, i.g.) for two weeks significantly decreased the body weight, (157.3±5.2g vs165.4±10.4g, p=0.0129), reduced the serum TC, TG, and LDL–C levels by 47%, 45%, and 42%, respectively, Figure 1. The HDL–C levels in the berberine group were also reduced. Additionally, HFD induced obviously histopathologic changes in livers, which could be effectively reversed by BBR, Figure S1.
Figure 1. Effect of berberine on serum lipid levels in hyperlipidemic hamsters.
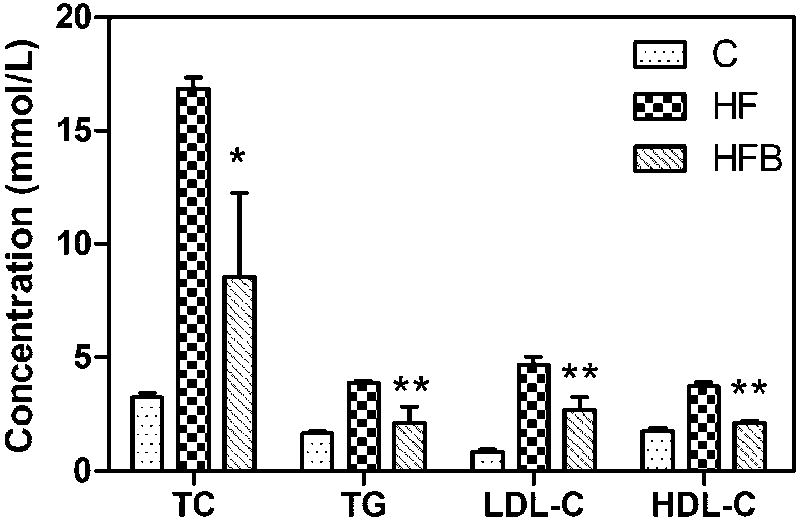
Total serum cholesterol (TC), triglyceride (TG), high-density lipoprotein cholesterol (HDL-C) and low-density lipoprotein cholesterol (LDL-C) levels were determined after 2-week treatment of berberine (100 mg/kg/d, i.g.). C, Hamsters control; HF, Hamsters with high fatty diet; HFB, Hamsters with high fatty diet+BBR (100mg/kg, i.g.).
Data are means ±SD (n = 5). Statistical significance relative to HF group, *p<0.05, * *P<0.01.
3.3 Oral-administrated berberine regulated host metabolism and bile acids biosynthesis
To explore the effect of berberine on lipid metabolism, the hamsters’ metabolic patterns were evaluated with GC/TOF-MS. Visual inspection of the total ion current chromatograms revealed obvious differences between the control (C), high- fat diet induced hamsters (HF), and HF treated with berbereine (HFB) (Figure 2). Of the 204 peaks detected with GC/TOF-MS, 81 were authentically identified. Altogether, 62 (20 identified) peaks differentiated the hyperlipidemic model from the normal control. As shown in Table S1, the cholesterol, free fatty acid levels and some amino acid levels were significantly elevated in the hyperlipidemic hamsters, suggesting the perturbation of their lipid metabolism and amino acid turnover. Treatment with berberine restored most of the discriminatory metabolites toward normal levels (as in the normal control) to different extents, including their fatty acids, amino acids, and cholesterol. Remarkably, as shown in Figure 2D, the serum cholic acid levels were dramatically increased in the berberine-treated hamsters (P = 0.002 vs C; P = 0.007 vs HF), suggesting that berberine modulates the bile acid metabolism.
Figure 2. GC/TOF-MS analysis of the metabolites and cholic acid in serum from each group.
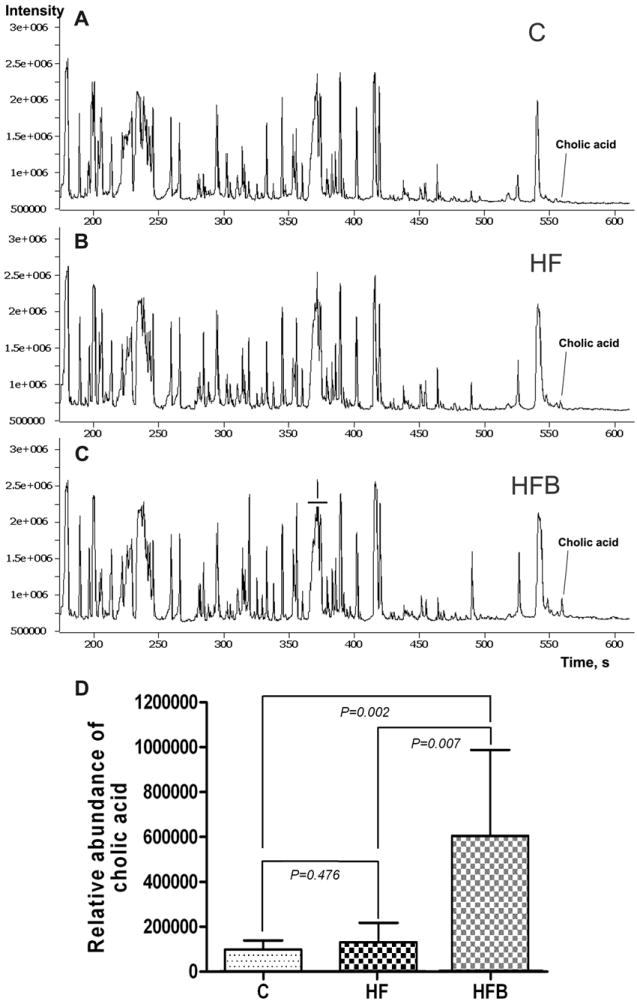
C: Hamsters control; HF: high-fat diet group; HFB: HF treated with berberine.
Values are mean ± SD (n = 5). Statistical significance was evaluated using one-way ANOVA.
Multivariate statistical analysis of the metabolomic data of the molecules in serum and cecal samples revealed that the hyperlipidemic model animals had distinctly different metabolic pattern from the normal controls, and oral-administrated berberine regulated metabolic pattern of the hamster model (Figure 3). In comparison with the data from serum (Figure 3A), berberine showed stronger effect on deviating the metabolome in gut content (Figure 3B) according to the relative distance value, i.e., distance to the model group relative to the distance between model group and normal control 23. The results were consistent with the poor bioavailability or rather low level of berberine in circulation system, and fairly efficient accumulation of berberine in gut and hence the stronger impact on gastrointestinal physiology. Metabolic impact analysis of the data revealed that berberine significantly affect metabolism of cholesterol and/or biosynthesis of bile acids (Figure 3C, D, Figure 4), indicating that the turnover of bile acids was involved in lipid lowering effect of berberine.
Figure 3. The effect of berberine on metabolic pattern and synthesis of bile acids based on GC/MS analysis of the molecules in serum and gut content of hyperlipidemic hamsters treated with berberine.
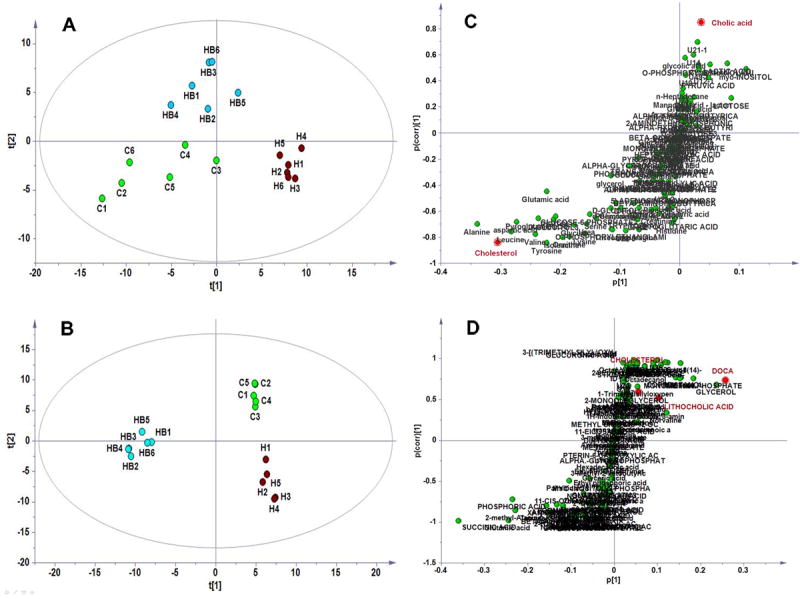
A, PLSDA plots based on serum data; B, PLSDA plots based on gut content data; C: OPLS S-plot between HF and HFB based on sera data; D, OPLS S-plot between HF and HFB based on data from gut content.
C, treated with berberine; H, high-fat diet group; HB: HF treated with berberine.
Figure 4. The metabolic impact analysis based on GC/MS analysis of the molecules in serum and gut content of hyperlipidemic hamsters treated with berberine.
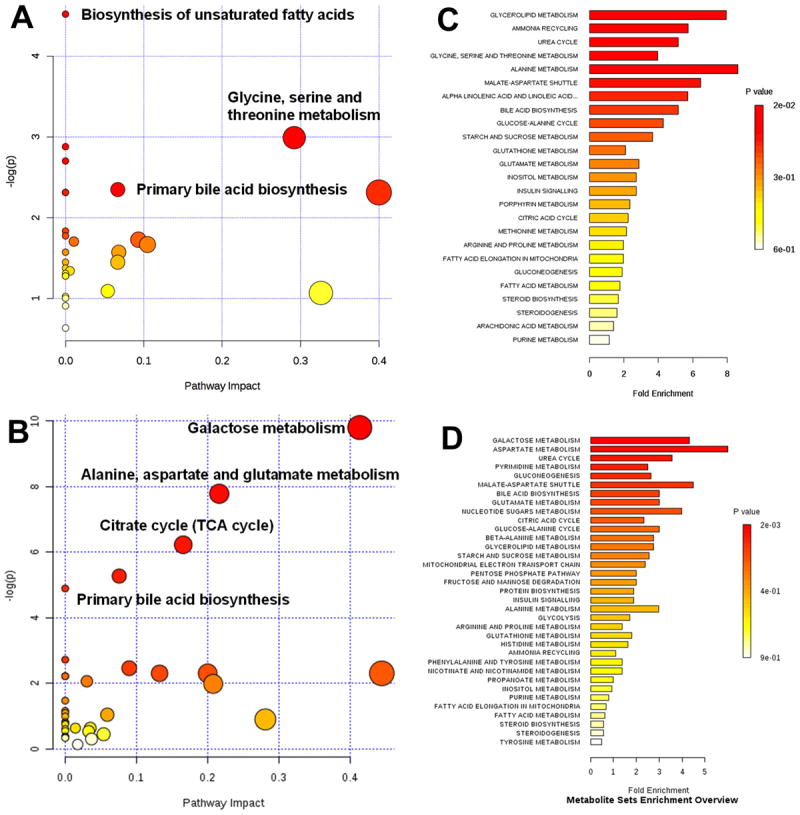
A, Metabolic pathway analysis based on molecules in serum; B, Metabolic pathway analysis based on molecules in gut content ; C, Metabolite pathway enrichment based on serum metabolites; D, Metabolite pathway enrichment based on molecules in gut content.
3.4 BBR increased the total amount of bile acids in gall bladder and gut content of hamsters
Oral administration of BBR obviously increased the size and weight of the hamster gall bladder relative to the normal hamsters and the hyperlipidemic model hamsters, Table S2, and the amounts of conjugated bile acids taurocholic aicd and glycocholic acid increased distinctly in hamster gall bladder. In gut content, the conjugated bile acids were low while and free bile acids level were much higher, Table S2. In generally, berberine increased free bile acids in both the normal and hyperlipidemic controls, and BBR administration significantly elevated the total amount of bile acids in gall bladder and in gut content, Table S3, indicating that berberine enhanced the metabolism of cholesterol in liver, where CYP7A1 and CYP27A1 may plays a key role in the metabolism.
3.5 The effect of berberine on the expression of CYP7A1 and CYP27A1 in hamster liver and in HepG2 cells
To investigate the effects of berberine on the upstream derivation of bile acids from cholesterol, its effects on the levels of transcription of CYP7A1 and CYP27A1 in liver of hamsters were evaluated by real-time RT–PCR. Berberine did not show significant modulation on CYP7A1, yet slightly elevated CYP27A1 expression at the mRNA level (Figure 5 A, B, p>0.05). In HepG2 cells the levels of transcription and translation of CYP7A1 and CYP27A1 were evaluated by both real-time RT–PCR and western blotting analysis of the cognate proteins. At the levels lower than 100 ng/mL, berberine did not show distinct effect on the expression of CYP7A1 and CYP27A1. However, at higher levels above 500 ng/mL, berberine significantly and dose-dependently increased CYP7A1 and CYP27A1 expression at both the mRNA (Figure 5 C, D, p<0.05) and protein levels (Figure 5 E).
Figure 5. Effect of berberine on CYP7A1 and CYP27A1 mRNA and protein levels.
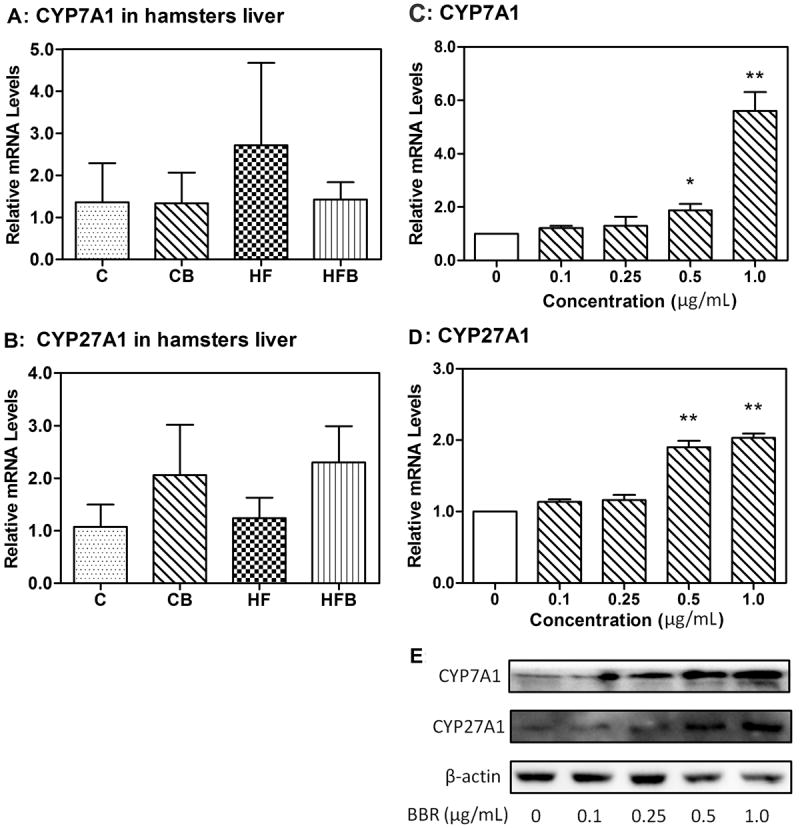
A, Effect of berberine on CYP7A1 mRNA expression in hamster liver(p>0.05).
B, Effect of berberine on CYP27A1 mRNA expression in hamster liver(p>0.05).
C, Real-time quantitative PCR analysis of CYP7A1 in HepG2 cells after 24 h of treatment with berberine (0 to 1 μg/mL).
D, Real-time quantitative PCR analysis of CYP27A1 in HepG2 cells after 24 h of treatment with berberine (0 to 1 μg/mL).
E, Western blot anslysis of CYP7A1 and CYP27A1 in HepG2 cells after 24 h of treatment with berberine (0 to 1 μg/mL). Levels of CYP7A1 and CYP27A1 RNA were normalized to those of β-actin in each sample.
3.6 Effects of berberine on the composition of the gut microbiota
By analyzing 360 16S rRNA gene sequences, we profiled the gut bacteria in the cecal samples of the three groups: HFD hamsters treated with berberine (HFB); normal control group (C), and hyperlipidemic model control group (HF). A bacterial phylogenetic tree of the hamster gut microbiota was constructed (Figure 6A). As shown in Figure 6B, the hamster gut microbiota was primarily composed of seven bacterial phyla: Firmicutes, Bacteroidetes, Tenericutes, Proteobacteria, Actinobacteria, Spirochetes, and Deferribacteres. This is similar to the compositions of the human and mouse gut microbiota29. The major components of the gut microbiota were Firmicutes and Bacteroidetes in all three groups, and Clostridium relatives were the single most prevalent bacterial group. However, the relative ratios of Firmicutes to Bacteroidetes differed. In the normal control (C group), Firmicutes and Bacteroidetes comprised 38.05% and 26.55% of the total microbiota, respectively. The ratio of Firmicutes to Bacteroidetes was 1.43. However, in the HFD control group, the percentage of Bacteroidetes was significantly increased, leading to a lower ratio of Firmicutes to Bacteroidetes (0.95). These results indicate that Bacteroidetes outcompeted Firmicutes in the guts of the hyperlipidemic hamsters, becoming the predominant bacteria. A marked change in the proportion of Proteobacteria and minor changes in the proportions of Tenericutes, Spirochetes, Deferribacteres, and Actinobacteria were also observed in the guts of the hyperlipidemic hamsters (Figure 6B). Interestingly, treatment with berberine dramatically increased the proportion of Firmicutes (from 33.09% to 50.91%), and slightly reduced the proportion of Bacteroidetes (from 34.56% to 31.82%). As a consequence, the ratio of Firmicutes to Bacteroidetes increased significantly after treatment with berberine for two weeks (1.60).
Figure 6. Composition of gut microbiota in hamster gut content.
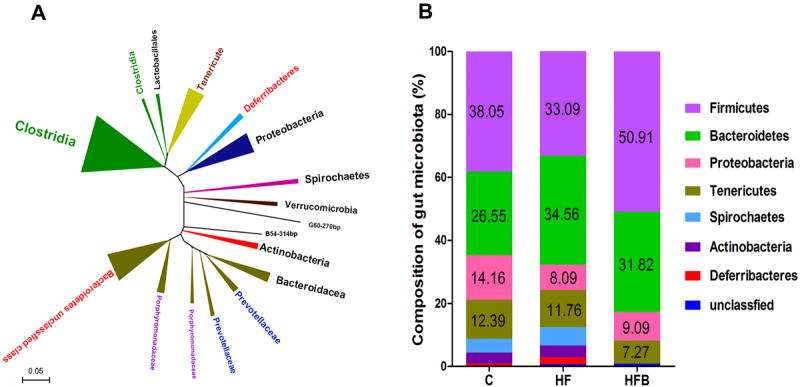
A: Bacterial phylogenetic tree of hamster gut based on 16S rRNA gene sequences; B: Composition of the gut microbiome of hamster cecum (n = 5). C: normal group; HF: high-fat diet group; HFB: HF treated with berberine.
All numeric results are means ± SD of triplicates, representative of three independent experiments. * P<0.05, * *P<0.01, relative to their controls, respectively. BBR, berberine.
3.7 Berberine inhibited the elimination of cholic acid in C. scindens and in fresh gut contents
Berberine significantly increased the Firmicutes in the gut, and Clostridium was the predominant bacteria of gut Firmicutes. The first step in the downstream metabolism of cholic acid is 7α-dehydroxylation, which is mediated by certain bacteria, including Clostridium. Evaluating the effect of berberine on the cholic acid 7α-dehydroxylation activity of C. scindens revealed that at a concentration of 0.5 μg/mL, berberine inhibited cholic acid 7α-dehydroxylation by 12% after incubation for 10 min (Figure 7A). However, no dose-dependent inhibition of cholic acid 7α-dehydroxylation was observed in this particular in vitro assay system, suggesting that berberine also inhibits other bacteria that have 7α-dehydroxylating activity or indirectly inhibits the catabolism of cholic acid by modulating the composition of the gut microbiota.
Figure 7. Effect of berberine on the metabolism of cholic acid.
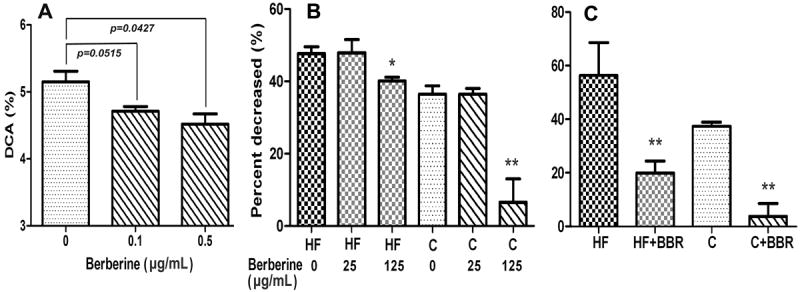
A, Effect of berberine on the cholic acid 7α-dehydroxylation in Clostridium scindens. The 7α-dehydroxylation activities of human Clostridium scindens were determined as described in “Methods”. DCA, deoxycholic, allodeoxycholic, 3-dehydro-deoxycholic acid, 3-dehydro-allodeoxycholic acid.
B, Effect of berberine on the metabolism of cholic acid in gut contents from HFD hamsters and the controls after incubation for 12 h with or without berberine. The percent decrease of cholic acid after in vitro incubation with fresh gut content, relative to the sterilized controls.
C, Effect of berberine on the metabolism of cholic acid in gut contents from hamsters treated with or without berberine.
BBR, berberine; HF, the HFD hamsters; C, the controls; HF+BBR, HFD hamsters treated with BBR (100 mg/kg); C+BBR, the controls treated with berberine(100 mg/kg). Values are mean ± SD of three independent experiments and analyzed using one-way ANOVA,* P<0.05, * *P<0.01, relative to their controls, respectively.
To further evaluate the effects of the altered gut microbiota on the metabolism of cholic acid, stable-isotope-labeled cholic acid was incubated with the fresh gut contents collected from model hamsters treated or not with berberine. The results showed that treatment with berberine significantly reduced the metabolism of cholic acid relative to that in animals with no berberine, in both the HFD hamsters and the controls (Figure 7 B, C). Compared with the controls, the HFD hamsters treated with and without berberine showed accelerated metabolism of cholic acid in their gut contents.
4 Discussion
4.1 The modulation of oral-administrated berberine on metabolites in serum and gut content and metabolic pathways involved
Local tissues/organs usually showed a different panel of metabolic markers from circulation system. In this study, although different metabolic sets were observed in serum and gut content samples after treatment with berberine, metabolic impact analysis suggested that oral administration of berberine perturbed many metabolic pathways for them (serum and gut content) in a similar way. In detail, oral administrated berberine obviously regulated glycolysis, amino acids metabolism and lipid metabolism, which is consistent with a previous study on berberine 30. In addition to the modulation of glycolysis both in serum and gut content, which is consistent with the hypoglycemic activity of berberine 31, to our delight, berberine showed significant effect on metabolism of cholesterol and biosynthesis of bile acids. The decreased cholesterol in serum and increased generation of cholic acid suggested the underlying mechanism for the hypocholesterolemic effect of berberine.
In term of metabolites set and relative distance in the score plot of PLSDA models, oral-administrated berberine showed stronger effect on metabolites in gut content than those in serum, suggesting the accumulated berberine in gut and the stronger effect on gut flora and the metabolism. However, there is obvious contradiction between the substantial effect of berberine on systematic metabolism and the poor exposure of berberine in circulation system. In other words, little berberine inside the body may not show distinct effect on metabolites in serum. Previous studies suggested that the possible reason may be attributed to the close association between gut microflora and host metabolism that has been well documented20, 32. This might be the right reason why metabolic pathways perturbed by berberine elucidated by serum metabolomics are closely associated with the effect of berberine on gut microbiota and the associated metabolism.
4.2 Gastrointestinal accumulation and lipid lowering effect of oral-administrated berberine
Previous studies have shown that berberine affects the lipid metabolism by activating AMPK signal pathway and low-density lipoprotein (LDL) receptor3, 5-7. However, the cellular mechanisms proposed by several in vitro studies do not appropriately explain the in vivo lipid-lowering effects of berberine because the bioavailability of orally administered berberine is extremely low. Our pharmacokinetic study has confirmed that little berberine is absorbed into the body after its oral administration. The maximum serum levels of berberine after its oral administration of hamsters at doses of 50 and 200 mg/kg were 3.2 ± 0.9 and 8.0 ± 3.3 ng/mL, respectively. The amount of berberine used in all the reported in vitro studies was much higher than could be achieved by its oral administration (around 1000 times). Although the bioavailability of berberine after its oral administration was much lower than after its i.g. administration (based on AUC and Cmax), it exerted better hypolipidemic effects, as indicated by the greater reductions in serum TC, TG, and LDL–C levels than were achieved with an intraperitoneal injection, which produced much higher AUC and Cmax values (Table 1). Considering that a large amount of berberine reserved in gastrointestinal tract while serum berberine was rather low, it is presumed that the lipid-lowering effect of oral-administrated berberine was involved in the modulation of gastrointestinal physiology.
4.3 Effects of berberine on the turnover of bile acids
The data clearly showed that berberine significantly increased the generation of bile acids (Table S2, S3). While the elimination of cholic acid, primarily via 7α-dehydroxylation of cholic acid 27, was significantly inhibited (Figure 7), in a C. scindens, which is the predominant bacterium in the gut Firmicutes in both animals and humans 33, 34. A further in vitro study of the metabolism of cholic acid in fresh gut contents also showed that berberine significantly reduced the catabolism of cholic acid by the gut flora collected from both the HFD hamsters and the controls (Figure 7C). In general, berberine increased the net gain of bile acids.
4.4 Effects of berberine on the biosynthesis of bile acids
Both berberine and bile acids may have effect on the metabolism of cholesterol, i.e., the expression and function of CYP7A1, CYP27A1. In vitro data showed that, in HepG2 cells, high concentration (above 500 ng/ml) of berberine significantly increased CYP7A1 and CYP27A1 expression at both the mRNA (Figure 5 C, D) and protein levels, while lower level (no more than 100 ng/ml) berberine showed little effect. Therefore, high level of berberine in hamster will up-regulate CYP7A1 and CYP27A1, while low level of berberine in hamster ought to show little effect on CYP7A1 and CYP27A1. In consistent with the rather low exposure of berberine in hamster liver, hepatic CYP7A1 and CYP27A1 in hamsters were not significantly affected after oral administration of berberine. Consequently, the direct effect of berberine on CYP7A1, CYP27A1 was thus out of the question.
Bile acids are the end products of the catabolism of cholesterol in liver, primarily via two processes regulated by two key enzymes, CYP7A1 and CYP27A135, 36. It has been well established that cholesterol 7a-hydroxylase (CYP7A1), a microsomal cytochrome p450 enzyme, dominates the first and rate-limiting step of cholesterol catabolism, and CYP7A1 gene is modulated by bile acids through nuclear receptor farnesoid X receptor (FXR) signal pathway37. As the end products of cholesterol metabolism, bile acids play a key role in cholesterol homeostasis. An up-regulated CYP7A1 can lead to higher level of bile acids to favor the hypolipidemic effect by facilitating conjugation with and the excretion of lipids38, 39. Simultaneously, the elevated bile acids usually inhibit the catabolism of cholesterol in a negative feedback way by promoting hepatic and intestinal FXR signal pathways to depress CYP7A1 expression and function 37. Theoretically, the elevated bile acids by berberine can up-regulate FXR to inhibit the expression and function of CYP7A1. However, neither the mRNA level, nor the function (generation of bile acids) of CYP7A1 became significantly decreased in liver of hamsters, indicating that the elevated amount of bile acids in bile/liver and ceca/intestine failed to activate enterohepatic FXR signal pathways. Because bile acids play a key role in the hepatic FXR/SHP and intestinal FXR/FGF signal pathways and hence the homeostasis of cholesterol, the effect of berberine on enterohepatic cycle of bile acids and the intestinal FXR-FGF signal pathway involved need to be further studied.
4.5 Lipid lowering effect of berberine and the composition of gut microbiota
Host–microbe interactions are essential to many aspects of the mammalian physiology, ranging from metabolic activity to immune homeostasis 40. In this regard, the gut microbiota can be considered a “microbial organ” within the host organism 41. Recent studies have suggested that the gut microbiota not only facilitates the host’s digestion and absorption of nutrients, but also affects the host’s energy balance by regulating lipid metabolism and glycolysis. Aberrations in the gut microbiota contribute to the development of diverse human diseases, including diabetes, obesity, fatty liver diseases, inflammatory bowel diseases, and cancers 1, 42, 43.
It has been reported that the relative proportion of Bacteroidetes is lower in both obese people and obese mice than in lean people and lean mice 44, 45. Ley et al. found that the relative abundances of Firmicutes and Bacteroidetes in obese people changed as they lost weight on a fat-restricted or a carbohydrate-restricted low-calorie diet46. Interestingly, this phenomenon was also observed in children in the rural African village of Burkina Faso, where the high-fiber diet is similar to that of early human settlements at the time of the beginning of agriculture 47. These studies suggest the both Bacteroidetes and Firmicutes play important roles in the host metabolism. However, in this study, we found that in the normal hamster controls, the gut microbial community was dominated by Firmicutes and a high-fat diet induced an increase in Bacteroidetes and a reduction in Firmicutes in the hyperlipidemic hamsters. Treatment with berberine reversed the Bacteroidetes/Firmicutes ratio, and restored the Firmicutes to the role of the absolutely dominant bacteria. These results suggest that the Firmicutes play a critical role in the lipid metabolism of the host. The discrepancy in the gut Bacteroidetes/Firmicutes ratio between humans, mice, and hamsters might be attributable to variations in the overall gut environments and genetic differences between the hosts.
Additionally, different species of bacteria isolated from the human gastrointestinal tract show different bile salt hydrolase (BSH) activities 48. Among the gut microbiota, the phylum Firmicutes has been shown to have higher BSH activity than the phylum Bacteroidetes, which is only active for tauro-conjugated bile acid 49. Our study clearly shows that berberine significantly increased the Firmicutes/Bacteroidetes ratio, suggesting that this is one of the mechanisms underlying the berberine-induced increase in free serum cholic acid and the lipid-lowering effect of berberine. Although we did not evaluate BSH activity in this study, we believe the increase in Firmicutes and BSH activity is involved in the elevation of cholic acid, although further studies are required to clarify the effect of berberine on BSH activity.
5 Conclusion remarks
Our data showed that intragastric-administered berberine was poorly absorbed into circulation and most berberine accumulated in gut content. The accumulated berberine in gut strongly affected the metabolites in gut and hence the metabolites in circulation system, although level of berberine was rather low in hamster serum. The obvious modulation of lipid metabolism and glycolysis suggested the hypolipidemic and hypoglycemic effect of berberine. The reduced cholesterol in serum and elevated generation of bile acids in gall bladder and gut content of hamsters suggested that the lipid-lowering effect of berberine is involved in metabolism of cholesterol and biosynthesis of bile acids. Since elevated bile acids failed to down-regulate the expression and function of CYP7A1 in a negative feed-back way, it was suggested that the hypocholesterolemic effect for oral-administrated berberine is primarily involved in the turnover and enterohepatic circulation of bile acids and intestinal farnesoid X receptor signal pathway.
Supplementary Material
Acknowledgments
This study was supported by the National Natural Science Foundation of the People’s Republic of China (81373481, 40821140541), and the United States National Institutes of Health (R01 AT004148 to HZ), the Natural Science Foundation of Jiangsu Province (BK2012762), and the Project for Jiangsu Province Key Lab of Drug Metabolism and Pharmacokinetics (BM2012012). We thank Dr. Bei Yan, Jian Shi, Mengjie Li, and Tian Zheng, Miss Ying Zhang, Xinwen Wang, Wenjing Xiao, Ting Ma, Wenjuan Xia, Chun Ge, Na Yang, Siqi Feng, Fei Fei, and Pei Wang, and Mr. Xiaoyi Yu, Dong Feng, Hong Wang, Yong Mao, and Lixiang A, very much for their assistance in this study.
References
- 1.Chu FF, Esworthy RS, Chu PG, Longmate JA, Huycke MM, Wilczynski S, Doroshow JH. Cancer Res. 2004;64:962–968. doi: 10.1158/0008-5472.can-03-2272. [DOI] [PubMed] [Google Scholar]
- 2.Jeong HW, Hsu KC, Lee JW, Ham M, Huh JY, Shin HJ, Kim WS, Kim JB. Am J Physiol Endocrinol Metab. 2009;296:E955–964. doi: 10.1152/ajpendo.90599.2008. [DOI] [PubMed] [Google Scholar]
- 3.Kim WS, Lee YS, Cha SH, Jeong HW, Choe SS, Lee MR, Oh GT, Park HS, Lee KU, Lane MD, Kim JB. Am J Physiol Endocrinol Metab. 2009;296:E812–819. doi: 10.1152/ajpendo.90710.2008. [DOI] [PubMed] [Google Scholar]
- 4.Kuo CL, Chi CW, Liu TY. Cancer Lett. 2004;203:127–137. doi: 10.1016/j.canlet.2003.09.002. [DOI] [PubMed] [Google Scholar]
- 5.Wang Y, Jia X, Ghanam K, Beaurepaire C, Zidichouski J, Miller L. Atherosclerosis. 2010;209:111–117. doi: 10.1016/j.atherosclerosis.2009.08.050. [DOI] [PubMed] [Google Scholar]
- 6.Brusq JM, Ancellin N, Grondin P, Guillard R, Martin S, Saintillan Y, Issandou M. J Lipid Res. 2006;47:1281–1288. doi: 10.1194/jlr.M600020-JLR200. [DOI] [PubMed] [Google Scholar]
- 7.Kong W, Wei J, Abidi P, Lin M, Inaba S, Li C, Wang Y, Wang Z, Si S, Pan H, Wang S, Wu J, Li Z, Liu J, Jiang JD. Nat Med. 2004;10:1344–1351. doi: 10.1038/nm1135. [DOI] [PubMed] [Google Scholar]
- 8.Chen C, Chang H. J Chromatogr B Biomed Appl. 1995;665:117–123. doi: 10.1016/0378-4347(94)00517-9. [DOI] [PubMed] [Google Scholar]
- 9.Miyazaki H, Shirai E, Ishibashi M, Hosoi K, Shibata S, Iwanaga M. Biomed Mass Spectrom. 1978;5:559–565. doi: 10.1002/bms.1200051002. [DOI] [PubMed] [Google Scholar]
- 10.Zuo F, Nakamura N, Akao T, Hattori M. Drug Metab Dispos. 2006;34:2064–2072. doi: 10.1124/dmd.106.011361. [DOI] [PubMed] [Google Scholar]
- 11.Liu YT, Hao HP, Xie HG, Lai L, Wang Q, Liu CX, Wang GJ. Drug Metab Dispos. 2010;38:1779–1784. doi: 10.1124/dmd.110.033936. [DOI] [PubMed] [Google Scholar]
- 12.Martin F-PJ, Wang Y, Sprenger N, Yap IK, Lundstedt Tr, Lek P, Rezzi S, Ramadan Z, Bladeren Pv, Fay LB, Kochhar S, Lindon JC, Holmes E, Nicholson JK. Mol Syst Biol. 2008;4:157. doi: 10.1038/msb4100190. [DOI] [PMC free article] [PubMed] [Google Scholar]
- 13.Martin F-PJ, Dumas M-E, Wang Y, Legido-Quigley C, Yap IK, Tang H, Zirah Sv, Murphy GM, Cloarec O, Lindon J, Sprenger N, Fay L, Kochhar S, van Bladeren P, Holmes E, Nicholson J. Mol Syst Biol. 2007;3:112. doi: 10.1038/msb4100153. [DOI] [PMC free article] [PubMed] [Google Scholar]
- 14.Schäfer N, Yu Z, Wagener A, Millrose M, Reissmann M, Bortfeldt R, Dieterich C, Adamski J, Wang-Sattler R, Illig T, Brockmann G. Metabolomics. 2013:1–12. doi: 10.1007/s11306-013-0590-1. [DOI] [PMC free article] [PubMed] [Google Scholar]
- 15.Szymańska E, Dorsten F, Troost J, Paliukhovich I, Velzen EJ, Hendriks MWB, Trautwein E, Duynhoven JM, Vreeken R, Smilde A. Metabolomics. 2012;8:894–906. doi: 10.1007/s11306-011-0384-2. [DOI] [PMC free article] [PubMed] [Google Scholar]
- 16.MacIntyre L, Zheng L, Scullion P, Keating P, Watson D. Metabolomics. 2011;7:54–70. [Google Scholar]
- 17.Aa J, Yu L, Sun M, Liu L, Li M, Cao B, Shi J, Xu J, Cheng L, Zhou J, Zheng T, Wang X, Zhao C, Gu R, Zhang F, Shi R, Wang G. Metabolomics. 2012;8:164–173. [Google Scholar]
- 18.Cao B, Li M, Zha W, Zhao Q, Gu R, Liu L, Shi J, Zhou J, Zhou F, Wu X, Wu Z, Wang G, Aa J. Metabolomics. 2013;9:960–973. doi: 10.1007/s11306-013-0517-x. [DOI] [PMC free article] [PubMed] [Google Scholar]
- 19.Lindeque J, Hidalgo J, Louw R, Westhuizen F. Metabolomics. 2013;9:418–432. [Google Scholar]
- 20.Wikoff WR, Anfora AT, Liu J, Schultz PG, Lesley SA, Peters EC, Siuzdak G. Proc Natl Acad Sci U S A. 2009;106:3698–3703. doi: 10.1073/pnas.0812874106. [DOI] [PMC free article] [PubMed] [Google Scholar]
- 21.Martinez I, Wallace G, Zhang C, Legge R, Benson AK, Carr TP, Moriyama EN, Walter J. Appl Envir Microbiol. 2009;75:4175–4184. doi: 10.1128/AEM.00380-09. [DOI] [PMC free article] [PubMed] [Google Scholar]
- 22.Gu S, A J, Wang G, Zha W, Yan B, Zhang Y, Ren H, Cao B, Liu L. Biomed Chromatogr. 2010;24:245–252. doi: 10.1002/bmc.1279. [DOI] [PubMed] [Google Scholar]
- 23.Aa J, Shao F, Wang G, Huang Q, Zha W, Yan B, Zheng T, Liu L, Cao B, Shi J, Li M, Zhao C, Wang X, Wu Z. Metabolomics. 2011;7:217–225. [Google Scholar]
- 24.Hayashi H, Takahashi R, Nishi T, Sakamoto M, Benno Y. J Med Microbiol. 2005;54:1093–1101. doi: 10.1099/jmm.0.45935-0. [DOI] [PubMed] [Google Scholar]
- 25.Feselstein J. Cladistics. 1989;5:164–166. [Google Scholar]
- 26.A J, Trygg J, Gullberg J, Johansson A, Jonsson P, Antti H, Marklund S, Moritz T. Anal Chem. 2005;77:8086–8094. doi: 10.1021/ac051211v. [DOI] [PubMed] [Google Scholar]
- 27.Wells JE, Berr F, Thomas LA, Dowling RH, Hylemon PB. J Hepatol. 2000;32:4–10. doi: 10.1016/s0168-8278(00)80183-x. [DOI] [PubMed] [Google Scholar]
- 28.Zhao C, Sun R, Cao B, Gu S, Zhao J, Liu L, Wang X, Zha W, Yu X, Xiao W, Mao Y, Ge C, Ju J, Aa L, Fei F, Ding Y, Aa J, Wang G. Eur J Drug Metab Pharmacokinet. 2013 doi: 10.1007/s13318-013-0143-z. [DOI] [PubMed] [Google Scholar]
- 29.Ley R, Hmady M, Lzupone C, Turnbaugh P, Ramey R, Bircher J, Schlegel M, Tucker T, Schrenzel M, Knight R, Gordon J. Science. 2008;320:1647–1651. doi: 10.1126/science.1155725. [DOI] [PMC free article] [PubMed] [Google Scholar]
- 30.Jiang Z, Liu F, Ong E, Li S. Metabolomics. 2012;8:1052–1068. [Google Scholar]
- 31.Xia X, Yan J, Shen Y, Tang K, Yin J, Zhang Y, Yang D, Liang H, Ye J, Weng J. PLoS One. 2011;6:e16556. doi: 10.1371/journal.pone.0016556. [DOI] [PMC free article] [PubMed] [Google Scholar]
- 32.Li M, Wang B, Zhang M, Rantalainen M, Wang S, Zhou H, Zhang Y, Shen J, Pang X, Wei H, Chen Y, Lu H, Zuo J, Su M, Qiu Y, Jia W, Xiao C, Smith LM, Yang S, Holmes E, Tang H, Zhao G, Nicholson JK, Li L, Zhao L. Proc Natl Acad Sci U S A. 2008;105:2117–2122. doi: 10.1073/pnas.0712038105. [DOI] [PMC free article] [PubMed] [Google Scholar]
- 33.Kitahara M, Sakata S, Sakamoto M, Benno Y. Microbiol Immunol. 2004;48:367–375. doi: 10.1111/j.1348-0421.2004.tb03526.x. [DOI] [PubMed] [Google Scholar]
- 34.Ridlon JM, Hylemon PB. J Lipid Res. 2012;53:66–76. doi: 10.1194/jlr.M020313. [DOI] [PMC free article] [PubMed] [Google Scholar]
- 35.Hylemon PB, Gurley EC, Stravitz RT, Litz JS, Pandak WM, Chiang JY, Vlahcevic ZR. J Biol Chem. 1992;267:16866–16871. [PubMed] [Google Scholar]
- 36.Matsuzaki Y, Bouscarel B, Ikegami T, Honda A, Doy M, Ceryak S, Fukushima S, Yoshida S, Shoda J, Tanaka N. Biochim Biophys Acta. 2002;1588:139–148. doi: 10.1016/s0925-4439(02)00157-6. [DOI] [PubMed] [Google Scholar]
- 37.Li T, Chiang JY. J Lipids. 2012;2012:754067. doi: 10.1155/2012/754067. [DOI] [PMC free article] [PubMed] [Google Scholar]
- 38.Honda A, Salen G, Nguyen LB, Xu G, Tint GS, Batta AK, Shefer S. Hepatology. 1998;27:154–159. doi: 10.1002/hep.510270124. [DOI] [PubMed] [Google Scholar]
- 39.Murphy C, Parini P, Wang J, Bjorkhem I, Eggertsen G, Gafvels M. Biochim Biophys Acta. 2005;1735:167–175. doi: 10.1016/j.bbalip.2005.06.001. [DOI] [PubMed] [Google Scholar]
- 40.Dethlefsen L, McFall-Ngai M, Relman D. Nature. 2007;449:811–818. doi: 10.1038/nature06245. [DOI] [PMC free article] [PubMed] [Google Scholar]
- 41.Foxman B, Goldberg D, Murdock C, Xi C, Gilsdorf J. Interdiscip Perspect Infect Dis. 2008;2008:613979. doi: 10.1155/2008/613979. [DOI] [PMC free article] [PubMed] [Google Scholar]
- 42.Dumas M-E, Barton RH, Toye A, Cloarec O, Blancher C, Rothwell A, Fearnside J, Tatoud R, Blanc V, Lindon JC, Mitchell SC, Holmes E, McCarthy MI, Scott J, Gauguier D, Nicholson JK. Proc Natl Acad Sci U S A. 2006;103:12511–12516. doi: 10.1073/pnas.0601056103. [DOI] [PMC free article] [PubMed] [Google Scholar]
- 43.Guarner F, Malagelada J. Lancet. 2003;361:512–519. doi: 10.1016/S0140-6736(03)12489-0. [DOI] [PubMed] [Google Scholar]
- 44.Burcelin R, Luche E, Serino M, Amar J. Front Biosci. 2009;14:5107–5117. doi: 10.2741/3589. [DOI] [PubMed] [Google Scholar]
- 45.Eckburg PB, Bik EM, Bernstein CN, Purdom E, Dethlefsen L, Sargent M, Gill SR, Nelson KE, Relman DA. Science. 2005;308:1635–1638. doi: 10.1126/science.1110591. [DOI] [PMC free article] [PubMed] [Google Scholar]
- 46.Ley R, Turnbaugh P, Klein S, Gordon J. Nature. 2006;444:1022–1023. doi: 10.1038/4441022a. [DOI] [PubMed] [Google Scholar]
- 47.De Filippo C, Cavalieri D, Di Paola M, Ramazzotti M, Poullet JB, Massart S, Collini S, Pieraccini G, Lionetti P. Proc Natl Acad Sci U S A. 2010;107:14691–14696. doi: 10.1073/pnas.1005963107. [DOI] [PMC free article] [PubMed] [Google Scholar]
- 48.Begley M, Hill C, Gahan CGM. Appl Envir Microbiol. 2006;72:1729–1738. doi: 10.1128/AEM.72.3.1729-1738.2006. [DOI] [PMC free article] [PubMed] [Google Scholar]
- 49.Jones BV, Begley M, Hill C, Gahan CG, Marchesi JR. Proc Natl Acad Sci U S A. 2008;105:13580–13585. doi: 10.1073/pnas.0804437105. [DOI] [PMC free article] [PubMed] [Google Scholar]
Associated Data
This section collects any data citations, data availability statements, or supplementary materials included in this article.