

Abstract
Purpose
To investigate the features of corneal epithelial thickness topography with Fourier-domain optical coherence tomography (OCT) in dry eye patients.
Methods
In this cross-sectional study, 100 symptomatic dry eye patients and 35 normal subjects were enrolled. All participants answered the ocular surface disease index questionnaire and were subjected to OCT, corneal fluorescein staining, tear breakup time, Schirmer 1 test without anesthetic (S1t), and meibomian morphology. Several epithelium statistics for each eye, including central, superior, inferior, minimum, maximum, minimum – maximum, and map standard deviation, were averaged. Correlations of epithelial thickness with the symptoms of dry eye were calculated.
Results
The mean (±SD) central, superior, and inferior corneal epithelial thickness was 53.57 (±3.31) μm, 52.00 (±3.39) μm, and 53.03 (±3.67) μm in normal eyes and 52.71 (±2.83) μm, 50.58 (±3.44) μm, and 52.53 (±3.36) μm in dry eyes, respectively. The superior corneal epithelium was thinner in dry eye patients compared with normal subjects (p=0.037),whereas central and inferior epithelium were not statistically different. In the dry eye group, patients with higher severity grades had thinner superior (p = 0.017) and minimum (p < 0.001) epithelial thickness, more wide range (p = 0.032), and greater deviation (p = 0.003). The average central epithelial thickness had no correlation with tear breakup time, S1t, or the severity of meibomian glands, whereas average superior epithelial thickness positively correlated with S1t (r = 0.238, p = 0.017).
Conclusions
Fourier-domain OCT demonstrated that the thickness map of the dry eye corneal epithelium was thinner than normal eyes in the superior region. In more severe dry eye disease patients, the superior and minimum epithelium was much thinner, with a greater range of map standard deviation.
Keywords: optical coherence tomography, dry eye syndromes, epithelium, corneal, corneal pachymetry, tear film
Dry eye disease (DED) is a multifactorial pathology that affects tears and the ocular surface, resulting in potential injury to conjunctival and corneal epithelium.1 The mechanisms of DED include instability of the tear film,2 an increased tear osmolarity,3 abnormalities of the lacrimal gland4 and meibomian glands,5 and a cascade of inflammatory events in the epithelial surface cells.6 The clinical ocular symptoms of DED such as eye irritation, photosensitivity, and fluctuating vision may have resulted from the injured corneal epithelium.7 To figure out the morphological evidence of epithelial damage, various studies have been conducted to map the thickness of corneal epithelium.8,9 Brush cytology,10 impression cytology,11 ultrasound,12 and in vivo confocal microscopy13 are classical techniques in assessing the epithelial thickness. However, these methods require direct or indirect contact between the instruments and the patient's ocular surface.8 What is more, none of them can measure the epithelial thickness of the whole cornea precisely,12 because most of them only focus on the central epithelial thickness (CET).
Fourier-domain optical coherence tomography (OCT) is an in vivo and noncontact technique that enables quick measurement of corneal epithelial thickness by obtaining high-resolution, cross-sectional imaging of biological tissues.14 With great reliability and repeatability, OCT has been chosen in several studies to evaluate the corneal epithelial thickness in ocular diseases.8,15–19 Francoz et al.8 measured the corneal, limbal, and bulbar conjunctival epithelial thickness in normal eyes with in vivo spectral-domain OCT. Li et al.14 mapped the corneal epithelial thickness with Fourier-domain OCT in keratoconic eyes: keratoconus was characterized by apical epithelial thinning. Ma et al.15 proved that the Fourier-domain OCT was valuable in measuring the epithelial thickness in post-LASIK (laser-assisted in situ keratomileusis) eyes. However, few studies referred to the features of corneal epithelial thickness in dry eye patients.8
To address this, we investigated the features of the corneal epithelial thickness map in DED patients using Fourier-domain OCT and further explored its relation with DED severity.
Methods
Participants
This cross-sectional observational study enrolled a total of 100 eyes of 100 dry eye patients (43 men, 57 women; mean [±SD] age, 47.34 [±15.85] years) and 35 eyes of 35 healthy volunteers (13 men, 22 women; mean [±SD] age, 43.57 [±17.36] years) who were referred to the Eye and ENT Hospital of Fudan University from March to July 2013. All subjects were aged 18 years or older. The study was in compliance with the Declaration of Helsinki, and informed consent was obtained from each subject.
Normal subjects met the following requirements1,20: (1) ocular surface disease index (OSDI) scores lower than 20, (2) tear breakup time (TBUT) greater than or equal to 10 seconds without any ocular surface staining, (3) Schirmer 1 test without anesthetic (S1t) value greater than or equal to 10 mm/5 min, (4) healthy-appearing morphology of meibomian glands, and (5) no other ocular surface abnormalities under slit-lamp microscopy. The diagnosis of DED was as follows21: (1) presence of dry eye symptoms (OSDI score ≥ 20) and (2) presence of qualitative or quantitative disturbance of the tear film (TBUT < 5 seconds, or S1t < 5 mm/5 min, or fluorescein staining ≥ 3 points).
The exclusion criteria included subjects with a history of Sjogren syndrome, Stevens-Johnson syndrome, glaucoma, allergic diseases, ocular trauma, ocular surgery, and any other ocular or systemic disorders that may affect the corneal epithelium. Subjects who used contact lenses or eye drops within 3 months before the study were also excluded.
Ophthalmic Examination
Demographic information and a clinical history were obtained from each subject after the enrollment. The OSDI questionnaire includes the symptoms (five questions), functional limitations (four questions), and environmental factors (three questions) related to ocular irritation. An OSDI score greater than or equal to 20 was taken as the cutoff for dry eye symptoms.22 In the present study, the OSDI score of the Chinese version23 was used. To decrease possible bias, the ophthalmologist in charge was responsible to explain the questions to patients and then record the answers.
After completing the OSDI questionnaire, all subjects underwent a complete examination of the ocular surface in the following order: best-corrected visual acuity (a logMAR [logarithm of the minimum angle of resolution] chart was chosen for the assessment), OCT scanning, corneal fluorescein staining, TBUT, S1t, and meibomian morphology.24 During the tear stability examination, the location of tear breakup point was recorded by quadrant. Four quadrants were used in the analysis: superior nasal, inferior nasal, inferior temporal, and superior temporal. In meibomian morphology, the severity of meibomian gland dysfunction was staged from 1 to 4 based on the morphology and expression of meibomian glands.25 Finally, according to the 2007 Dry Eye Workshop, a severity grading system (1 to 4) was used to classify the signs of DED, with the higher grades representing more severe disease symptoms.1 To avoid interoperator errors, all procedures were performed by one ophthalmologist. The eyes with a higher volume of tear production in healthy subjects and the eyes with worse severity of dry eye in the DED group were included in the analysis.
OCT Examination
Fourier-domain OCT (RTVue; Optovue, Inc, Fremont, CA) with a corneal adaptor module was used in the present study. The machine worked at 830 nm wavelength and had a scan speed of 26,000 axial scans per second with 5 μm axial resolution. A Pachymetry+Cpwr scan pattern,14 with 6-mm scan diameter and 8 radials, was chosen to map the cornea. The pachymetry map of corneal thickness and corneal epithelial thickness was provided by the RTVue corneal adaptor module software automatically.14 In this method, the air-tear interface and the epithelium-Bowman layer boundary were identified automatically with a computer algorithm by increased signal intensity at corresponding boundaries. The scan was performed three times in each subject.
The epithelial thickness map was divided into three zones on the basis of diameters: central 2 mm, 2 to 5 mm, and 5 to 6 mm. Epithelium statistics within the central 5-mm zone, including the average epithelial thicknesses of superior and inferior zones, the minimum and maximum thicknesses and the difference between them (minimum – maximum [Min – Max]), and map standard deviation (MSD) from the average value of a single epithelial thickness map, were calculated automatically by the RTVue corneal adaptor module software. The average epithelial thickness in the central 2 mm and peripheral epithelial thickness (PET) in eight different meridians were recorded. The quadrant with the thickest epithelium point was recorded.
Statistical Analysis
Statistical analyses were performed with SPSS for Windows version 16.0 (SPSS Inc, China). Mean ± SD values of each corneal epithelial thickness variable were calculated for both normal and DED groups. To compare epithelial thickness variables (epithelium statistics within the central 5-mm zone and epithelial thickness in every region), measured in normal and DED eyes, two-tailed Student t tests were performed. One-way analysis of variance was performed to compare the variables in different DED subgroups, with Bonferroni correction for the differences between every two groups. The Pearson correlation coefficient was used in dry eye patients to investigate the correlation between the quantitative measurements of average epithelial thickness, including central and superior regions of the cornea, and other tear film measurements such as TBUT, S1t, and meibomian gland classification. p values less than 0.05 were considered statistically significant.
Results
In the 35 healthy eyes, the mean (±SD) refraction was −3.60 (±2.58) diopters, with a corrected visual acuity of 4.87 (±0.17). In the 100 dry eyes, the mean (±SD) refraction was −2.88 (±3.87) diopters, with a corrected visual acuity of 4.92 (±0.14). The average (±SD) OSDI score in DED patients was 15.90 (±14.30), the TBUT was 3.56 (±1.91) seconds, the S1t was 10.69 (±9.03) mm/5 min, and the grading of meibomian gland dysfunction was 1.03 (±1.25). Most of the tear film rupture (47% of all patients) and maximum epithelial thickness (42% of all patients) points were located at the inferior nasal quadrant of cornea.
Dry eye patients were divided into four subgroups according to the severity of DED: 36 subjects in grade 1 (13 men and 23 women; mean [±SD] age, 43.94 [±15.87] years; range, 20 to 80 years), 29 subjects in grade 2 (16 men and 13 women; mean [±SD] age, 48.24 [±17.49] years; range, 18 to 92 years), 24 subjects in grade 3 (11 men and 13 women; mean [±SD] age, 49.88 [±13.74] years; range, 20 to 72 years), and 11 subjects in grade 4 (3 men and 8 women; mean [±SD] age, 50.55 [±15.60] years; range, 18 to 79 years). Fisher exact test and analysis of variance showed that there were no statistical difference in sex (χ2 = 3.544, p = 0.314) and age (F = 0.935, p = 0.427) among these subgroups.
The average (±SD) CET of dry eyes was 52.71 (±2.83) μm, slightly thinner than that of the normal group (53.57 ± 3.31 μm), but there was no statistical difference between them (p = 0.141; Table 1). In dry eye patients, the average (±SD) CET was 53.06 (±2.65) μm, 52.76 (±2.68) μm, 52.67 (±2.75) μm, and 51.55 (±3.93) μm from grades 1 to 4, respectively, with no significant differences from each other (Table 2).
Table 1. Epithelial thickness pachymetry variables in normal and DED subjects.
| Normal eyes | Dry eyes | p | |
|---|---|---|---|
| CET, μm | 53.57 ± 3.31 | 52.71 ± 2.83 | 0.141 |
| Average superior epithelial thickness, μm | 52.00 ± 3.39 | 50.58 ± 3.44 | 0.037* |
| Average inferior epithelial thickness, μm | 53.03 ± 3.67 | 52.53 ± 3.36 | 0.462 |
| Minimum, μm | 47.91 ± 5.19 | 46.88 ± 4.72 | 0.279 |
| Maximum, μm | 56.66 ± 3.88 | 55.45 ± 3.83 | 0.113 |
| Min – Max, μm | −8.57 ± 6.57 | −8.44 ± 4.62 | 0.898 |
| MSD | 2.04 ± 1.69 | 1.92 ± 0.97 | 0.599 |
| PET of SN region in 2–5 mm diameter, μm | 52.20 ± 3.91 | 50.78 ± 3.68 | 0.066 |
| PET of S region in 2–5 mm diameter, μm | 51.91 ± 3.31 | 49.96 ± 3.55 | 0.005* |
| PET of ST region in 2–5 mm diameter, μm | 51.80 ± 3.75 | 50.22 ± 3.62 | 0.029* |
| PET of SN region in 5–6 mm diameter, μm | 50.80 ± 4.21 | 48.57 ± 3.99 | 0.006* |
| PET of S region in 5–6 mm diameter, μm | 50.31 ± 4.03 | 47.90 ± 3.98 | 0.003* |
| PET of ST region in 5–6 mm diameter, μm | 51.34 ± 3.67 | 49.26 ± 4.14 | 0.009* |
p values below 0.05.
SN, superior nasal; S, superior; ST, superior temporal.
Table 2. Epithelial thickness pachymetry variables in different grades of DED subjects.
| Grade 1 | Grade 2 | Grade 3 | Grade 4 | p | |
|---|---|---|---|---|---|
| Subjects | 36 | 29 | 24 | 11 | |
| CET, μm | 53.06 ± 2.65 | 52.76 ± 2.68 | 52.67 ± 2.75 | 51.55 ± 3.93 | 0.498 |
| Average superior epithelial thickness, μm | 51.44 ± 3.12 | 51.10 ± 3.31 | 49.79 ± 3.75 | 48.09 ± 2.84 | 0.017* |
| Average inferior epithelial thickness, μm | 53.19 ± 3.36 | 52.38 ± 3.04 | 52.46 ± 3.40 | 50.91 ± 3.91 | 0.26 |
| Minimum, μm | 48.58 ± 3.18 | 47.69 ± 3.56 | 45.67 ± 5.54 | 41.82 ± 5.91 | <0.001* |
| Maximum, μm | 55.78 ± 3.77 | 54.97 ± 3.17 | 55.63 ± 4.25 | 55.27 ± 5.00 | 0.854 |
| Min – Max, μm | −7.22 ± 2.99 | −7.31 ± 2.16 | −9.83 ± 6.20 | −12.36 ± 6.95 | 0.002* |
| MSD | 1.65 ± 0.72 | 1.69 ± 0.51 | 2.26 ± 1.27 | 2.65 ± 1.37 | 0.003* |
| PET of SN region in 2–5 mm diameter, μm | 51.56 ± 3.41 | 51.45 ± 3.28 | 49.92 ± 4.35 | 48.36 ± 2.77 | 0.032* |
| PET of S region in 2–5 mm diameter, μm | 50.86 ± 3.29 | 50.59 ± 3.51 | 49.25 ± 3.54 | 46.91 ± 2.81 | 0.005* |
| PET of ST region in 2–5 mm diameter, μm | 51.14 ± 3.25 | 50.79 ± 3.65 | 49.25 ± 3.86 | 47.82 ± 2.93 | 0.02* |
| PET of IN region in 5–6 mm diameter, μm | 52.39 ± 3.72 | 51.76 ± 2.89 | 51.71 ± 3.00 | 50.64 ± 3.70 | 0.177 |
| PET of N region in 5–6 mm diameter, μm | 51.61 ± 3.46 | 51.62 ± 3.30 | 50.00 ± 3.89 | 48.27 ± 5.69 | 0.037* |
| PET of SN region in 5–6 mm diameter, μm | 50.11 ± 3.70 | 49.97 ± 3.50 | 48.50 ± 4.81 | 46.27 ± 4.32 | 0.028* |
| PET of S region in 5–6 mm diameter, μm | 48.86 ± 3.84 | 47.97 ± 3.87 | 47.71 ± 4.27 | 45.00 ± 2.90 | 0.043* |
| PET of ST region in 5–6 mm diameter, μm | 49.81 ± 3.54 | 48.79 ± 3.69 | 48.08 ± 4.30 | 45.00 ± 3.61 | 0.004* |
| PET of T region in 5–6 mm diameter, μm | 51.56 ± 3.26 | 50.21 ± 3.49 | 49.58 ± 4.18 | 47.64 ± 2.84 | 0.011* |
| PET of IT region in 5–6 mm diameter, μm | 52.75 ± 3.63 | 51.07 ± 2.95 | 51.88 ± 3.62 | 49.73 ± 3.20 | 0.048* |
p values below 0.05.
IN, inferior nasal; N, nasal; SN, superior nasal; S, superior; ST, superior temporal; T, temporal; IT, inferior temporal.
Compared with normal eyes, dry eyes had a significantly thinner corneal epithelium superiorly (p = 0.037; Fig. 1). In addition, severe dry eyes had thinner superior epithelial thickness (p = 0.017), lower minimum thickness (p < 0.001), more negative Min – Max (p = 0.002), and greater MSD (p = 0.003; Fig. 2). Bonferroni testing confirmed that the superior epithelium in grade 4 was significantly thinner than that in grade 1 (p = 0.025), the minimum epithelium in grade 4 was considerably lower than that in grades 1 (p < 0.001) and 2 (p = 0.001), and the value of Min – Max in grade 4 was more negative than that in grades 1 (p = 0.005) and 2 (p = 0.008).
Figure 1.

Average corneal epithelial thickness variables of 2 to 5 mm areas in normal and DED groups. Solid lines show the group that had significant statistical difference. Max – Min = maximum – minimum, the absolute value of Min – Max.
Figure 2.

Average corneal epithelial thickness variables of 2 to 5 mm areas in dry eyes with different severity grades. Solid lines show the groups that had significant statistical differences. Max – Min = maximum – minimum, the absolute value of Min – Max.
The mean PET map in 2 to 5 mm diameters from the central cornea of dry eye patients was thinner in the S (superior, p = 0.005) and ST (superior temporal; p = 0.029) regions than that of normal participants (Table 2 and Fig. 3). Furthermore, the PETs in severe dry eyes were significantly thinner in the SN (superior nasal, p = 0.032), S (p = 0.005), and ST (p = 0.02) regions (Table 2 and Fig. 4). Similar patterns occurred in areas 5 to 6 mm diameters from central cornea: the average PET in dry eye patients was thinner in the SN (superior nasal, p = 0.009), S (p = 0.003), and ST (p = 0.006) regions than for healthy volunteers (Table 1 and Fig. 2). Moreover, in severe dry eyes, the thinner region was enlarged: the thicknesses of N (nasal, p = 0.037), SN (p = 0.028), S (p = 0.004), ST (p = 0.004), T (temporal, p = 0.011), and IT (inferior temporal, p = 0.048) areas were all attenuated (Table 2 and Fig. 4).
Figure 3.
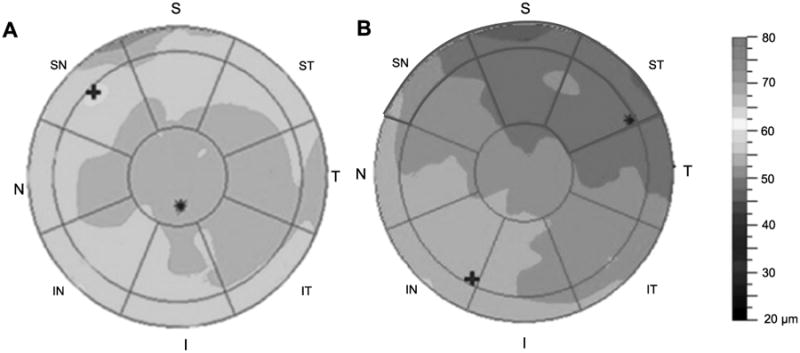
Representative epithelial thickness maps of a healthy volunteer (A) and a dry eye patient (B). The red circles overlaid on the map indicate zones that had statistical differences between the two groups. S, superior; ST, superior temporal; T, temporal; IT, inferior temporal; I, inferior; IN, inferior nasal; N, nasal; SN, superior nasal. A color version of this figure is available online at www.optvissci.com.
Figure 4.
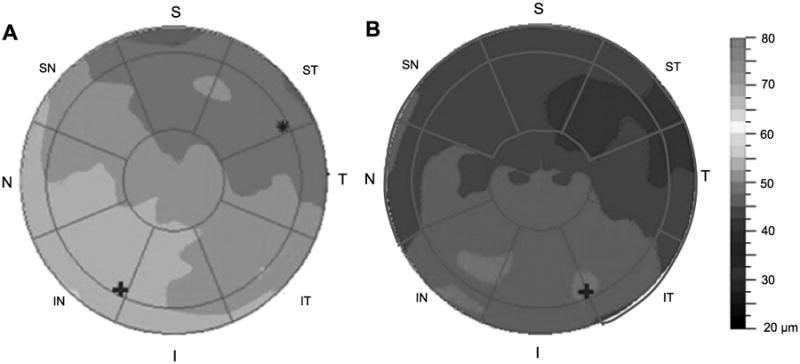
Representative epithelial thickness maps of a dry eye patient (A) and a severe dry eye patient (B). The red circles overlaid on the map indicate zones that had statistical differences among the four groups graded by severity of dry eyes. S, superior; ST, superior temporal; T, temporal; IT, inferior temporal; I, inferior; IN, inferior nasal; N, nasal; SN, superior nasal. A color version of this figure is available online at www.optvissci.com.
The average central corneal epithelial thickness had no statistical association with any tear-related variables (Table 3). Interestingly, the average thickness of superior epithelium positively correlated with S1t (r = 0.238, p = 0.017; Fig. 5), whereas other tear-related variables showed no significant correlation with it.
Table 3. Correlation between epithelial thickness and dry eye examinations.
| Central epithelial thickness | Superior epithelial thickness | |||
|---|---|---|---|---|
| r | p | r | p | |
| TBUT | 0.015 | 0.374 | 0.142 | 0.158 |
| S1t | 0.094 | 0.352 | 0.238 | 0.017* |
| MG grades | −0.059 | 0.570 | −0.143 | 0.166 |
p value below 0.05.
MG, meibomian gland.
Figure 5.
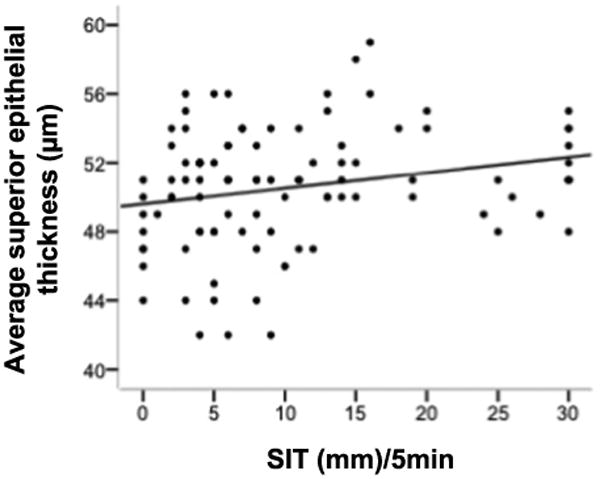
The correlation between average superior epithelial thickness and S1t.
Discussion
The goal of the present study was to evaluate the morphology of corneal epithelium in DED patients. Our data revealed that the average thickness of superior corneal epithelium in dry eyes, measured by Fourier-domain OCT, was significantly thinner than that in normal eyes. Notably, the thinner tendency was larger in the more severe dry eyes. The average CET had no correlation with TBUT, S1t, or the severity of meibomian gland morphology. The connection between thinned superior corneal epithelium and decreased S1t was interesting, although it was not strong enough to exclude other factors. It provides an impetus for future studies to confirm these results and investigate the diagnostic effect of average superior corneal epithelial thickness.
The average CET was examined in previous studies, with the application of impression cytology,26 in vivo confocal micros-copy,27 or ultrasound.12 With the benefit of noncontact, accuracy, stability, and repeatability, OCT was widely used in various studies.28–31 Fabiani et al.9 figured out that the CET became thicker in 7 days after the establishment of DED in a rat model, indicating that epithelial proliferation has a significant impact on the inflammatory process. Kanellopoulos and Asimellis32 observed augmented epithelial thickness in dry eye patients, whereas Erdelyi et al.33 examined clinical patients and revealed that the CET tends to be thinner in dry eyes, and attributed it to the destruction of stem cells at the limbus. In the present study, the CET in DED did not show a significant difference from normal patients, consistent with the work conducted by Francoz et al.8 and Tuominen et al.34 Our result might be attributed to two reasons. One is that, benefiting from immune privilege and angiogenic privilege, central cornea appears less sensitive to inflammation than the limbus and conjunctiva.35 It has also been proven that the alteration of epithelial thickness caused by DED affects, more profoundly, the peripheral corneal epithelium rather than that in the central region.8 The central cornea in our study was located at the central 2-mm-diameter region, far away from the limbus, which should be mildly affected. The other is the inclusion criteria in this study. Larger sample sizes and inclusion of an earlier form of DED in the present study might have allowed the demonstration of a slight difference between the normal and DED groups.
In the present study, the superior corneal epithelium in DED patients was thinner than in normal participants, with a difference of less than 2 μm, even lower than the SD of epithelial thickness measurements. With the rough resolution (5 μm) of OCT and thinner thickness of corneal epithelium (averaged as 50 μm around), it seems reasonable that the discrepancy was as small as 2 μm, just as Francoz and Li found in their work.8,14 However, the magnitude of SD reported in this study was high, which might have impacted the results. The unequal sample size, as well as the wide age range, may have contributed to the instability of our results.
However, there were several facts that support our work: (1) Compared with normal eyes, the average PET in the S and ST regions was thinner in dry eyes, which is responsible for the thinned average superior epithelium. (2) The thickness of average superior epithelium in dry eye patients varied among different grades. It is 4 Km thinner in grade 4 DED patients than that in grade 1, indicating thinner thickness in more severe dry eye patients. (3) The epithelial thickness map showed that the SN, S, and ST regions of PET were thinned in dry eye patients. In severe DED patients, the thinned areas were greatly enlarged: N, SN, S, ST, T, and IT regions of PET were affected. (4) The correlation test indicated that the superior region was more sensitive than the central area in detecting the dry eye damage in corneal epithelium. In conclusion, the superior area might be the most vulnerable part of the corneal epithelium; this needs to be confirmed by other investigations.
To explore the reason why superior epithelium was thinner in dry eyes, the spatial disparity of epithelial thickness in normal eyes should be the first priority. The superior corneal epithelium was demonstrated to be significantly thinner than inferior areas in normal eyes.14,36 Although this had not had been systematically investigated, this nonuniform thickness profile was suggested to be induced by the friction resulting from mechanical dynamics in blinking.37 The wider-range movement and vertical traverse of the upper lid rubs more of the ocular surface. The friction itself mechanically hurts epithelial cells, thus causing the thinning of the superior epithelium. In the present study, we found a connection between thinned superior corneal epithelium and decreased S1t, which is consistent with the mechanical hypothesis. Dry eye patients usually do not have enough tears as lubricant; we propose that the increased mechanical friction intensified the epithelial damage and made the superior epithelium even thinner. In dry eyes, blinking usually occurs more frequently to compensate for the deficiency of tears.38 We suggested that the increased frequency of blinking would accentuate the mechanical friction, thus making the superior epithelium even thinner. Numerous studies highlighted the inflammatory process, driven by tear hyperosmolarity and tear film instability in DED, as the potential reason of epithelial thickness alteration.1,6 However, further studies should be conducted to clarify the reason underlying this finding.
Another explanation for this phenomenon may lie in the temporal and spatial variations in tear film thickness. King-Smith et al.39 reviewed the tear film thickness studies and concluded that the tear film thickness might be greater over the superior cornea than over the inferior cornea. The conclusion was further supported by our previous studies, either using Pentacam with fluorescein or Oculus Keratograph.40 It is interesting that the distribution of tear film thickness seems to be just the reverse of our findings in epithelium, which indicates that the thickness of the two layers might be interlinked. In light of the important role of the two layers in optical quality of the eye,41 the opposite distribution of the two layers together exactly makes up a smooth spheroid refraction surface. On the one hand, because of the effect of surface tension and meniscus radius, the tear film tends to be thinner in front of the thicker corneal epithelium region.42 On the other hand, as the epithelium has the ability to remodel to eliminate or reduce the bulging of the anterior stromal surface in keratoconus,14 it is possible for it to reshape to fit with the tear film, too. In addition, the tear film changes vastly in the 2 seconds after blink and becomes stable after 5 seconds.39 Dry eye patients have shorter TBUT than normal eyes, which implies that the tear film swings dramatically in dry eyes, especially in serious dry eye patients who have a TBUT of less than 2 seconds. Consequently, the enlarged range and MSD of severe dry eye corneal epithelium thickness in this study might be partially explained.
A crucial limitation in this study was that the epithelial thickness was defined as the distance between the air-tear and the epithelium-Bowman interfaces at the point of measurement,14 which included not only the corneal epithelium but also the precorneal tear film. The thickness of tear film, ranging from 3 to 46 μm, has been previously studied by various techniques.43,44 The average (±SD) central tear film thickness was measured as 4.79 (±0.88) μm by a spectral domain OCT with 800 nm laser,45 whereas in our study, the difference of average superior epithelial thickness between DED and normal groups was less than 2 μm. The thickness of tear film might greatly affect our findings. However, several measures were taken to figure out how much impact the tear film thickness had on our results. First of all, the location of the breakup point and the maximum epithelial thickness in the present study were measured. In accordance with the results of our previous study, both were in the inferior nasal quadrant. The location of tear film rupture reflects local non-wetting peaks of the ocular surface,46 and it is usually considered to be a thinner region of tear film. However, the epithelial thickness we have found in this region was very thick, indicating that the tear film thickness might not seriously affect out results. Second, the correlation of epithelial thickness and tear film variables in our study was evaluated. The thickness of central tear film showed good correlation with other dry eye examinations,47 especially the meibomian gland losses48 and TBUT test.49 The noncorrelation between the central corneal epithelial thickness and dry eye examinations in the present study could partially verify the validity of our result. Finally, the spatial distribution of tear film and corneal epithelium thickness mentioned above was capable of illustrating the difference between them. The thickness map of tear film was supposed to be thinner in inferior areas than in the superior part.39 In conclusion, the disparity of tear film might cover up the alterations in epithelial thickness map and make the magnitude of mean difference smaller. Future studies are suggested to accurately distinguish the precorneal boundary to diminish the impact of tear film thickness to the result.
To our knowledge, this is the first study to describe the features of corneal epithelial pachymetric topography in dry eye patients with different severity grades. For the first time, we propose that the thickness of the superior corneal epithelium is the primary concern of dry eye damage. Knowledge of the epithelial thickness profile in dry eye patients should help in customizing the design of contact lens for oxygen permeation and in indicating a proper incision direction for refractive surgery in dry eye patients.
Acknowledgments
This work was supported by grants from the California Institute for Regenerative Medicine (TR2-01768) and the National Eye Institute (R01EY021797 and 2T3EY007026); the Key Clinic Medicine Research Program, the Ministry of Health, China (201302015); the National Science and Technology Research Program, the Ministry of Science and Technology, China (2012BAI08B01); the National Natural Science Foundation of China (81170817, 81200658, and 81300735); and the Scientific Research Program, Science and Technology Commission of Shanghai Municipality, Shanghai (13441900900, 13430720400, 134119a8800, and 13430710500).
Footnotes
The authors declare that they have no conflicts of interest in this work.
References
- 1.Lemp M, Baudouin C, Baum J, Dogru M, Foulks GN, Kinoshita S, Laibson P, McCulley J, Murube J, Pfugfelder SC, Rolando M, Toda I. The definition and classification of dry eye disease: report of the Definition and Classification Subcommittee of the International Dry Eye WorkShop (2007) Ocul Surf. 2007;5:75–92. doi: 10.1016/s1542-0124(12)70081-2. [DOI] [PubMed] [Google Scholar]
- 2.Liu H, Begley C, Chen M, Bradley A, Bonanno J, McNamara NA, Nelson JD, Simpson T. A link between tear instability and hyperosmolarity in dry eye. Invest Ophthalmol Vis Sci. 2009;50:3671–9. doi: 10.1167/iovs.08-2689. [DOI] [PubMed] [Google Scholar]
- 3.Versura P, Profazio V, Schiavi C, Campos EC. Hyperosmolar stress upregulates HLA-DR expression in human conjunctival epithelium in dry eye patients and in vitro models. Invest Ophthalmol Vis Sci. 2011;52:5488–96. doi: 10.1167/iovs.11-7215. [DOI] [PubMed] [Google Scholar]
- 4.Chen Z, Li Z, Basti S, Farley WJ, Pflugfelder SC. Altered morphology and function of the lacrimal functional unit in protein kinase C{alpha} knockout mice. Invest Ophthalmol Vis Sci. 2010;51:5592–600. doi: 10.1167/iovs.09-4562. [DOI] [PMC free article] [PubMed] [Google Scholar]
- 5.Cuevas M, Gonzalez-Garcia MJ, Castellanos E, Quispaya R, Parra Pde L, Fernandez I, Calonge M. Correlations among symptoms, signs, and clinical tests in evaporative-type dry eye disease caused by meibomian gland dysfunction (MGD) Curr Eye Res. 2012;37:855–63. doi: 10.3109/02713683.2012.683508. [DOI] [PubMed] [Google Scholar]
- 6.Zhang J, Yan X, Li H. Analysis of the correlations of mucins, inflammatory markers, and clinical tests in dry eye. Cornea. 2013;32:928–32. doi: 10.1097/ICO.0b013e3182801622. [DOI] [PubMed] [Google Scholar]
- 7.Pflugfelder SC. Tear dysfunction and the cornea: LXVIII Edward Jackson Memorial Lecture. Am J Ophthalmol. 2011;152:900–9. doi: 10.1016/j.ajo.2011.08.023. [DOI] [PMC free article] [PubMed] [Google Scholar]
- 8.Francoz M, Karamoko I, Baudouin C, Labbe A. Ocular surface epithelial thickness evaluation with spectral-domain optical coherence tomography. Invest Ophthalmol Vis Sci. 2011;52:9116–23. doi: 10.1167/iovs.11-7988. [DOI] [PubMed] [Google Scholar]
- 9.Fabiani C, Barabino S, Rashid S, Dana MR. Corneal epithelial proliferation and thickness in a mouse model of dry eye. Exp Eye Res. 2009;89:166–71. doi: 10.1016/j.exer.2009.03.003. [DOI] [PMC free article] [PubMed] [Google Scholar]
- 10.Karon MD, Klyce SD. Effect of inhibition of inflammatory mediators on trauma-induced stromal edema. Invest Ophthalmol Vis Sci. 2003;44:2507–11. doi: 10.1167/iovs.02-0926. [DOI] [PubMed] [Google Scholar]
- 11.Calonge M, Diebold Y, Saez V, Enriquez de Salamanca A, Garcia-Vazquez C, Corrales RM, Herreras JM. Impression cytology of the ocular surface: a review. Exp Eye Res. 2004;78:457–72. doi: 10.1016/j.exer.2003.09.009. [DOI] [PubMed] [Google Scholar]
- 12.McLaren JW, Nau CB, Erie JC, Bourne WM. Corneal thickness measurement by confocal microscopy, ultrasound, and scanning slit methods. Am J Ophthalmol. 2004;137:1011–20. doi: 10.1016/j.ajo.2004.01.049. [DOI] [PubMed] [Google Scholar]
- 13.Moller-Pedersen T, Vogel M, Li HF, Petroll WM, Cavanagh HD, Jester JV. Quantification of stromal thinning, epithelial thickness, and corneal haze after photorefractive keratectomy using in vivo confocal microscopy. Ophthalmology. 1997;104:360–8. doi: 10.1016/s0161-6420(97)30307-8. [DOI] [PubMed] [Google Scholar]
- 14.Li Y, Tan O, Brass R, Weiss JL, Huang D. Corneal epithelial thickness mapping by Fourier-domain optical coherence tomography in normal and keratoconic eyes. Ophthalmology. 2012;119:2425–33. doi: 10.1016/j.ophtha.2012.06.023. [DOI] [PMC free article] [PubMed] [Google Scholar]
- 15.Ma XJ, Wang L, Koch DD. Repeatability of corneal epithelial thickness measurements using Fourier-domain optical coherence tomography in normal and post-LASIK eyes. Cornea. 2013;32:1544–8. doi: 10.1097/ICO.0b013e3182a7f39d. [DOI] [PMC free article] [PubMed] [Google Scholar]
- 16.Tao A, Shao Y, Jiang H, Ye Y, Lu F, Shen M, Zhu D, Wang J. Entire thickness profiles of the epithelium and contact lens in vivo imaged with high-speed and high-resolution optical coherence tomography. Eye Contact Lens. 2013;39:329–34. doi: 10.1097/ICL.0b013e31829fae00. [DOI] [PMC free article] [PubMed] [Google Scholar]
- 17.Ge L, Yuan Y, Shen M, Tao A, Wang J, Lu F. The role of axial resolution of optical coherence tomography on the measurement of corneal and epithelial thicknesses. Invest Ophthalmol Vis Sci. 2013;54:746–55. doi: 10.1167/iovs.11-9308. [DOI] [PubMed] [Google Scholar]
- 18.Prakash G, Agarwal A, Mazhari AI, Chari M, Kumar DA, Kumar G, Singh B. Reliability and reproducibility of assessment of corneal epithelial thickness by Fourier domain optical coherence tomography. Invest Ophthalmol Vis Sci. 2012;53:2580–5. doi: 10.1167/iovs.11-8981. [DOI] [PubMed] [Google Scholar]
- 19.Du C, Wang J, Cui L, Shen M, Yuan Y. Vertical and horizontal corneal epithelial thickness profiles determined by ultrahigh resolution optical coherence tomography. Cornea. 2012;31:1036–43. doi: 10.1097/ICO.0b013e31823f8d56. [DOI] [PMC free article] [PubMed] [Google Scholar]
- 20.Ozcura F, Aydin S, Helvaci MR. Ocular surface disease index for the diagnosis of dry eye syndrome. Ocul Immunol Inflamm. 2007;15:389–93. doi: 10.1080/09273940701486803. [DOI] [PubMed] [Google Scholar]
- 21.Ibrahim OM, Dogru M, Kojima T, Matsumoto Y, Wakamatsu TH, Tsubota K, Fujishima H. OCT assessment of tear meniscus after punctal occlusion in dry eye disease. Optom Vis Sci. 2012;89:770–6. doi: 10.1097/OPX.0b013e31824eeb07. [DOI] [PubMed] [Google Scholar]
- 22.Schiffman RM, Christianson MD, Jacobsen G, Hirsch JD, Reis BL. Reliability and validity of the Ocular Surface Disease Index. Arch Ophthalmol. 2000;118:615–21. doi: 10.1001/archopht.118.5.615. [DOI] [PubMed] [Google Scholar]
- 23.Li M, Gong L, Sun X, Chapin WJ. Anxiety and depression in patients with dry eye syndrome. Curr Eye Res. 2011;36:1–7. doi: 10.3109/02713683.2010.519850. [DOI] [PubMed] [Google Scholar]
- 24.Bron AJ, Smith JA, Calonge M. Methodologies to diagnose and monitor dry eye disease: report of the Diagnostic Methodology Subcommittee of the International Dry Eye WorkShop (2007) Ocul Surf. 2007;5:108–52. doi: 10.1016/s1542-0124(12)70083-6. [DOI] [PubMed] [Google Scholar]
- 25.Nichols KK, Foulks GN, Bron AJ, Glasgow BJ, Dogru M, Tsubota K, Lemp MA, Sullivan DA. The international workshop on meibomian gland dysfunction: executive summary. Invest Ophthalmol Vis Sci. 2011;52:1922–9. doi: 10.1167/iovs.10-6997a. [DOI] [PMC free article] [PubMed] [Google Scholar]
- 26.Singh R, Joseph A, Umapathy T, Tint NL, Dua HS. Impression cytology of the ocular surface. Br J Ophthalmol. 2005;89:1655–9. doi: 10.1136/bjo.2005.073916. [DOI] [PMC free article] [PubMed] [Google Scholar]
- 27.Zhivov A, Stachs O, Kraak R, Stave J, Guthoff RF. In vivo confocal microscopy of the ocular surface. Ocul Surf. 2006;4:81–93. doi: 10.1016/s1542-0124(12)70030-7. [DOI] [PubMed] [Google Scholar]
- 28.Haque S, Jones L, Simpson T. Thickness mapping of the cornea and epithelium using optical coherence tomography. Optom Vis Sci. 2008;85:963–76. doi: 10.1097/OPX.0b013e318188892c. [DOI] [PubMed] [Google Scholar]
- 29.Sin S, Simpson TL. The repeatability of corneal and corneal epithelial thickness measurements using optical coherence tomography. Optom Vis Sci. 2006;83:360–5. doi: 10.1097/01.opx.0000221388.26031.23. [DOI] [PubMed] [Google Scholar]
- 30.Wang J, Fonn D, Simpson TL, Jones L. The measurement of corneal epithelial thickness in response to hypoxia using optical coherence tomography. Am J Ophthalmol. 2002;133:315–9. doi: 10.1016/s0002-9394(01)01382-4. [DOI] [PubMed] [Google Scholar]
- 31.Wang J, Fonn D, Simpson TL, Sorbara L, Kort R, Jones L. Topographical thickness of the epithelium and total cornea after overnight wear of reverse-geometry rigid contact lenses for myopia reduction. Invest Ophthalmol Vis Sci. 2003;44:4742–6. doi: 10.1167/iovs.03-0239. [DOI] [PubMed] [Google Scholar]
- 32.Kanellopoulos AJ, Asimellis G. In vivo 3-dimensional corneal epithelial thickness mapping as an indicator of dry eye: preliminary clinical assessment. Am J Ophthalmol. 2014;157:63–8. doi: 10.1016/j.ajo.2013.08.025. [DOI] [PubMed] [Google Scholar]
- 33.Erdelyi B, Kraak R, Zhivov A, Guthoff R, Nemeth J. In vivo confocal laser scanning microscopy of the cornea in dry eye. Graefes Arch Clin Exp Ophthalmol. 2007;245:39–44. doi: 10.1007/s00417-006-0375-6. [DOI] [PubMed] [Google Scholar]
- 34.Tuominen IS, Konttinen YT, Vesaluoma MH, Moilanen JA, Helinto M, Tervo TM. Corneal innervation and morphology in primary Sjogren's syndrome. Invest Ophthalmol Vis Sci. 2003;44:2545–9. doi: 10.1167/iovs.02-1260. [DOI] [PubMed] [Google Scholar]
- 35.Hori J, Joyce NC, Streilein JW. Immune privilege and immunogenicity reside among different layers of the mouse cornea. Invest Ophthalmol Vis Sci. 2000;41:3032–42. [PubMed] [Google Scholar]
- 36.Reinstein DZ, Archer TJ, Gobbe M, Silverman RH, Coleman DJ. Epithelial thickness in the normal cornea: three-dimensional display with Artemis very high-frequency digital ultrasound. J Refract Surg. 2008;24:571–81. doi: 10.3928/1081597X-20080601-05. [DOI] [PMC free article] [PubMed] [Google Scholar]
- 37.Reinstein DZ, Silverman RH, Trokel SL, Coleman DJ. Corneal pachymetric topography. Ophthalmology. 1994;101:432–8. doi: 10.1016/s0161-6420(94)31314-5. [DOI] [PubMed] [Google Scholar]
- 38.Evinger C, Bao JB, Powers AS, Kassem IS, Schicatano EJ, Henriquez VM, Peshori KR. Dry eye, blinking, and blepharospasm. Mov Disord. 2002;17:S75–8. doi: 10.1002/mds.10065. [DOI] [PMC free article] [PubMed] [Google Scholar]
- 39.King-Smith PE, Fink BA, Hill RM, Koelling KW, Tiffany JM. The thickness of the tear film. Curr Eye Res. 2004;29:357–68. doi: 10.1080/02713680490516099. [DOI] [PubMed] [Google Scholar]
- 40.Zhuang H, Zhou X, Xu J. A novel method for pachymetry mapping of human precorneal tear film using Pentacam with fluorescein. Invest Ophthalmol Vis Sci. 2010;51:156–9. doi: 10.1167/iovs.08-3265. [DOI] [PubMed] [Google Scholar]
- 41.Montes-Mico R, Cervino A, Ferrer-Blasco T, Garcia-Lazaro S, Madrid-Costa D. The tear film and the optical quality of the eye. Ocul Surf. 2010;8:185–92. doi: 10.1016/s1542-0124(12)70233-1. [DOI] [PubMed] [Google Scholar]
- 42.Wong H, Fatt II, Radke CJ. Deposition and thinning of the human tear film. J Colloid Interface Sci. 1996;184:44–51. doi: 10.1006/jcis.1996.0595. [DOI] [PubMed] [Google Scholar]
- 43.Fogt N, King-Smith PE, Tuell G. Interferometric measurement of tear film thickness by use of spectral oscillations. J Opt Soc Am (A) 1998;15:268–75. doi: 10.1364/josaa.15.000268. [DOI] [PubMed] [Google Scholar]
- 44.Prydal JI, Artal P, Woon H, Campbell FW. Study of human precorneal tear film thickness and structure using laser interferometry. Invest Ophthalmol Vis Sci. 1992;33:2006–11. [PubMed] [Google Scholar]
- 45.Werkmeister RM, Alex A, Kaya S, Unterhuber A, Hofer B, Riedl J, Bronhagl M, Vietauer M, Schmidl D, Schmoll T, Garhofer G, Drexler W, Leitgeb RA, Groeschl M, Schmetterer L. Measurement of tear film thickness using ultrahigh-resolution optical coherence tomography. Invest Ophthalmol Vis Sci. 2013;54:5578–83. doi: 10.1167/iovs.13-11920. [DOI] [PubMed] [Google Scholar]
- 46.Fatt I. Observations of tear film break up on model eyes. CLAO J. 1991;17:267–81. [PubMed] [Google Scholar]
- 47.Hosaka E, Kawamorita T, Ogasawara Y, Nakayama N, Uozato H, Shimizu K, Dogru M, Tsubota K, Goto E. Interferometry in the evaluation of precorneal tear film thickness in dry eye. Am J Ophthalmol. 2011;151:18–23. doi: 10.1016/j.ajo.2010.07.019. [DOI] [PubMed] [Google Scholar]
- 48.Eom Y, Lee JS, Kang SY, Kim HM, Song JS. Correlation between quantitative measurements of tear film lipid layer thickness and meibomian gland loss in patients with obstructive meibomian gland dysfunction and normal controls. Am J Ophthalmol. 2013;155:1104–10. doi: 10.1016/j.ajo.2013.01.008. [DOI] [PubMed] [Google Scholar]
- 49.Isreb MA, Greiner JV, Korb DR, Glonek T, Mody SS, Finnemore VM, Reddy CV. Correlation of lipid layer thickness measurements with fluorescein tear film break-up time and Schirmer's test. Eye. 2003;17:79–83. doi: 10.1038/sj.eye.6700224. [DOI] [PubMed] [Google Scholar]