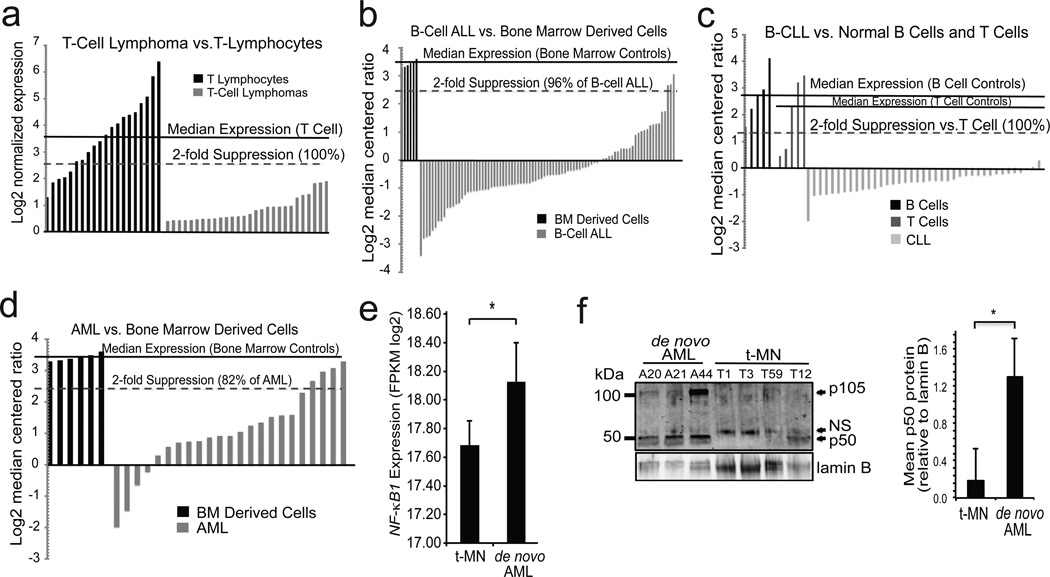
Figure 4.
NFKB1 mRNA is decreased in hematological malignancy. (a–d) Waterfall plots of data from human tumor databases. Median expression in the control samples (solid line) and % below 2-fold suppression (dashed line) are indicated for each dataset. (a) T-cell lymphoma samples vs. circulating T cells of healthy volunteers. P = 8×10⁻¹³. (b) Pediatric B-cell ALL bone marrow (BM) samples vs. BM of healthy volunteers. P = 1.1×10⁻¹¹. (c) Adult B-cell CLL peripheral blood samples vs. B cells isolated from healthy adults, or T cells isolated from 1 neonate, 2 fetal and 2 adult samples. P < 1×10⁻¹² (CLL vs. B or T cells). (d) Pediatric AML BM vs. BM of healthy volunteers. P = 2.7×10⁻⁷. (e) NFKB1 expression level assessed by RNA sequencing in t-MN (N =18) compared to de novo AML (N = 10). NFKB1 expression is output as Fragments per Kilobase per Million mapped reads (FPKM). * P = 0.026. RNA sequencing data are extracted from our previous study,35 plus five previously unpublished t-MN samples. (f) Immunoblot (left) with anti-p50 antibody in bone marrow samples from patients with de novo AML (n=3) and t-MN (n= 4). Loading was examined with anti-lamin B. Quantification of p50 protein level (right) is shown relative to lamin B. * P < 0.05. NFKB1 expression level in human lymphomas and leukemias was determined from published datasets. Oncomine (Compendia Bioscience, Ann Arbor, MI, USA) was initially used for screening of data and preliminary analysis. Subsequently, identified datasets [GEO accession: GSE7186;19 GSE2466;20 and GSE633818] were downloaded from the Gene Expression Omnibus using the Bioconductor package GEOquery.36, 37 Data for DLBCL by Rosenwald et. al.22 was downloaded from the Lymphoma/Leukemia Molecular Profiling Project Gateway (http://llmpp.nih.gov/DLBCL/). Data was quantile normalized and log2 transformed as-needed using the limma and lumi packages.38 The median NFKB1 expression level of control samples was calculated, and the percentage of tumor samples with 2-fold lower expression determined. Means and standard deviations of NFKB1 log2 normalized expression or log2 median centered ratios for patient samples and controls in each dataset were calculated using Graphpad Prism (San Diego, CA, USA). Five t-MN samples were processed for next-generation RNA sequencing on the Illumina platform as previously described.35 Patient characteristics and read depth are provided (Supplemental Table 1). Data analysis and expression level estimates were performed as previously described.35 Raw sequencing data will be deposited in the NCBI Short Read Archive. Two-tailed Student’s t tests were used with an alpha of < 0.05. For t-MN, one-sided Wilcoxon rank sum test was used. For immunoblotting, bone marrow samples were thawed, washed in PBS and lysed with RIPA buffer prior to SDS-PAGE and immunoblotting. Anti-lamin B antibody (sc-6216). p50 quantification was performed by densitometry by measuring band intensity with ImageJ freeware (W. S. Rasband, National Institutes of Health, Bethesda, MD; http://rsb.info.nih.gov/ij/) and the data plotted as ratio over loading after compensating for background intensity taken in a non-immunoreactive region of the blot.

