

Abstract
Thanatophoric dysplasia type I (TDI) is a lethal human skeletal growth disorder with a prevalence of 1 in 20,000 to 1 in 50,000 births. TDI is known to arise because of five different mutations, all involving the substitution of an amino acid with a cysteine in fibroblast growth factor receptor 3 (FGFR3). Cysteine mutations in receptor tyrosine kinases (RTKs) have been previously proposed to induce constitutive dimerization in the absence of ligand, leading to receptor overactivation. However, their effect on RTK dimer stability has never been measured experimentally. In this study, we characterize the effect of three TDI mutations, Arg248Cys, Ser249Cys, and Tyr373Cys, on FGFR3 dimerization in mammalian membranes, in the absence of ligand. We demonstrate that the mutations lead to surprisingly modest dimer stabilization and to structural perturbations of the dimers, challenging the current understanding of the molecular interactions that underlie TDI.
Introduction
Thanatophoric dysplasia type I (TDI) is a lethal human skeletal growth disorder with a prevalence of 1 in 20,000 to 1 in 50,000 births. It is one of the most severe of the skeletal dysplasias and typically leads to neonatal death (1–3). Typical features of the TDI phenotype include shortened limbs with bowed femurs and cloverleaf skull deformities.
TDI is known to arise because of five different mutations, all involving the substitution of an amino acid with a cysteine in fibroblast growth factor receptor 3 (FGFR3): Arg248Cys, Ser249Cys, Gly370Cys, Ser371Cys, and Tyr373Cys (4–6). Of these, Arg248Cys and Tyr373Cys account for 60% to 80% of all cases of TDI. These cysteine mutations have been shown to increase the phosphorylation and activation of the receptor in the absence of ligand (7,8), increase downstream extracellular signal-related kinase signaling (9), and increase BaF3 cell proliferation (10). The mutations compromise the downregulation of activated FGFR3 dimers in the plasma membrane (11) and increase retention of FGFR3 dimers in the endoplasmic reticulum (12). Furthermore, it has been shown that overactivation of FGFR3 leads to the inhibition of chondrocyte proliferation during development, which impedes bone growth (13,14).
FGFR3 is a receptor tyrosine kinase (RTK) that consists of an extracellular (EC) domain involved in ligand binding, a single-pass transmembrane (TM) domain, and an intracellular tyrosine kinase domain. Like all RTKs, FGFR3 functions via a lateral dimerization process that brings the kinase domains into close proximity so that they can phosphorylate and activate each other (5,15–17).
Mutations to cysteine residues in RTKs have been proposed to cause cross-linking of the receptors via disulfide bonds, thereby inducing constitive dimerization and activation (7,18–20). However, the effect of the mutations on unliganded RTK dimer stability has never been characterized in quantitative terms. In this study, we characterize the effect of three TDI mutations, Arg248Cys, Ser249Cys, and Tyr373Cys, on the stability and the structure of FGFR3 dimers. We accomplish this by using a Förster Resonance Energy Transfer (FRET)–based technique (21,22) that yields dimerization free energies of glycosylated RTKs and reports on structural differences between RTK dimers. Measurements are performed in plasma membrane vesicles derived from Chinese hamster ovary (CHO) cells with the use of a novel osmotic stress vesiculation method (23). We find that the three TDI mutations cause a modest stabilization of the FGFR3 dimer. We also observe modest structural perturbations in the FGFR3 dimer because of the mutations.
Materials and Methods
Plasmid constructs
In the FGFR3 construct used for these experiments, the catalytic domain was substituted with a fluorescent protein to enable FRET-based detection of receptor dimerization. The construct consists of the extracellular (EC) and transmembrane (TM) domains of FGFR3 followed by a flexible 15 amino acid linker, (GGS)5, and either eYFP or mCherry. The DNA encoding for this construct was placed between the HindIII and XbaI multiple cloning sites of the pcDNA3.1(+) vector (Invitrogen, Carlsbad, CA) (22). Constructs containing each of the TDI mutations were generated from these two initial wild-type constructs using mutagenesis.
Mutagenesis
Each of the TDI constructs was created by introducing a mutation into the wild-type FGFR3 constructs containing eYFP and mCherry. This was accomplished using the QuikChange XL II Mutagenesis Kit (Agilent Technologies, Santa Clara, CA). Primers were designed according to the manufacturer’s instructions and ordered from Invitrogen. For the Arg248Cys constructs, the following primers were used to create the 742C to T nucleotide transition: forward 5′ - GCTGGACGTGCTGGAGTGCTCCCCGCACCGGC - 3′ and reverse 3′ - CGACCTGCACGACCTCACGAGGGGCGTGGCCG - 5′. For the Ser249Cys constructs, the 746C to G nucleotide transition was created using the forward primer 5′ - CGTGCTGGAGCGCTGCCCGCACCGGCCCATCC - 3′ and the reverse primer 3′ - GCACGACCTCGCGACGGGCGTGGCCGGGTAGG - 5′. For the Tyr373Cys constructs, the 1118A to G nucleotide transition was generated using the forward and reverse primers 5′ - CGAGGCGGGCAGTGTGTGTGCAGGCATCCTCAGC - 3′ and 3′ - GCTCCGCCCGTCACACACACGTCCGTAGGAGTCG - 5′. Following mutagenesis, all constructs were sequenced (Genewiz, Fredrick, MD) to ensure no other variations were introduced. All plasmids were amplified using DH5α cells.
Cell culture conditions
CHO cells were cultured in Dulbecco’s modified Eagle medium supplemented with 10% fetal bovine serum (HyClone, Logan, UT), 1 mM nonessential amino acids, 1.8 g/L d-glucose, and 1.5 g/L sodium bicarbonate. The cells were cultured in T25 tissue culture flasks and passed every other day.
Transfection and vesiculation
CHO cells were seeded into a six-well plate at a density of 2 to 4 × 10⁴ cells per well. Cells were grown for 24 h before transfection. Transfection was carried out using FuGENE HD (Roche Applied Sciences, Basel, Switzerland) according to the manufacturers’ protocol. Plasmids encoding for the FGFR3 constructs labeled with the donor (eYFP) and with the acceptor (mCherry) were transfected in a 1:3 ratio. After transfection, cells were grown for an additional 24 h before vesiculation.
Vesicles were produced from the transfected CHO cells using an osmotic stress method (23). The vesiculation buffer solution consisted of 200 mM NaCl, 5 mM KCl, 0.5 mM MgCl2, 0.75 mM CaCl2, and 100 mM bicine. The pH of the solution was set to 8.5 using 1 M HCl and 5 M NaOH stock solutions. The first step in the vesiculation process was to incubate each well of CHO cells in 1 mL of 30% PBS for 1 min at room temperature. After this step, 1 mL of the vesiculation buffer was added to each well, and the samples were incubated for 13 h at 37°C. Then, vesicles were transferred into Lab-Tek II four-chambered coverglass slides (Nunc, Penfield, NY) for image acquisition. To determine the pH of the buffer during the imaging experiments, the vesicle solution was filtered and the pH was measured using a micro conductivity sensor (Mettler Toledo, Columbus, OH). The pH of the buffer after vesiculation was consistently measured as 8.
Image acquisition and analysis
All images were acquired using a Nikon (Melville, NY) Eclipse confocal laser scanning microscope and a 60× water immersion objective. Each vesicle was imaged in three different scans. The donor scan utilized excitation of eYFP at 488 nm and emission collection between 500 and 530 nm (Fig. 1 shows examples of donor scans). In the FRET scan, eYFP was excited at 488 nm, and emission was collected in the 565 to 615 nm range. The acceptor scan utilized excitation of mCherry at 543 nm and collection of emission >650 nm using a long pass filter. The gains for the donor, FRET, and acceptor scans were set to 6.50, 7.00, and 7.25, respectively. The field of view for all images was set to 100 by 100 μm and images were acquired at a resolution of 512 × 512 with a pixel dwell time of 1.68 μs to minimize photobleaching.
Figure 1.
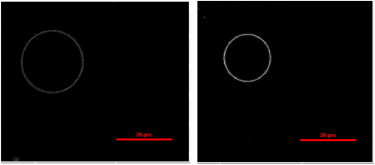
Typical plasma membrane–derived vesicles with wild-type FGFR3. Scale bar = 20 μm. To see this figure in color, go online.
The images were processed using a MATLAB (MathWorks, Natick, MA) program developed in the lab, as described previously (21). A Gaussian function was fitted to the fluorescence intensity across the membrane after correcting for background fluorescence (21) (see Supporting Material). The integrals of these Gaussian functions gave the fluorescence intensities per vesicle, IDonor, IFRET, and IAcceptor for the donor, FRET, and acceptor scans, respectively.
Fluorescent protein solutions of known concentration were prepared as described in an earlier study (24) and imaged in the donor and acceptor scans. These solution standards were used to determine the linear relationship between fluorescence intensities and fluorescent protein concentrations for both eYFP and mCherry (25). This information was used to determine the concentration of acceptors and donors in each vesicle. First, the acceptor concentration, CA, was calculated using the following relationship
| (1) |
where IAcceptor is the integrated intensity of the membrane in the acceptor scan and iA is the slope of the fluorescence intensity versus concentration plot for the acceptor standard solutions. Next, the sensitized acceptor emission, ISEN, was calculated. To do this, the bleed-through coefficients, βD and βA, for the donor and acceptor were determined using the solution standards. The sensitized acceptor emission, ISEN, for each vesicle was determined as follows (21)
| (2) |
The actual donor concentration (CD,Corrected) per vesicle was calculated as follows (21)
| (3) |
The gauge factor, GF, in Eq. 3 is an experimentally determined constant that relates the sensitized emission to donor quenching and depends on both the instrument and the FRET pair. This constant was measured by imaging vesicles containing a soluble construct of eYFP linked to mCherry in a 1:1 ratio as described in an earlier study (25).
The FRET efficiency for each vesicle was calculated according to the following:
| (4) |
The FRET efficiency observed in each vesicle is known to have two different contributions (1): specific FRET because of the presence of FGFR3 dimers and (2) proximity FRET because of the random approach of donors and acceptors in the membrane (21,26,27). The proximity FRET contribution, shown as a solid black line in Fig. 2, arises because of the confinement of the fluorophores to the two-dimensional (2D) membrane. The proximity FRET contribution, (calculated as discussed in detail in (27)), was subtracted from the measured FRET efficiency to determine the FRET due to dimerization
| (5) |
The fraction of receptors that exist in dimers, fD, was calculated in each vesicle from the corrected FRET efficiency according to the following
| (6) |
where xA is the fraction of acceptors in a given vesicle, and Ẽ is the so-called intrinsic FRET efficiency. The intrinsic FRET is a structural parameter that depends on the separation and orientation of the donor and the acceptor in a dimer. The dependence of the intrinsic FRET, Ẽ, on the distance between the fluorescent proteins in the dimer is given by the following:
| (7) |
where d is the distance between the acceptor and the donor in the dimer, and Ro is the Förster radius of the FRET pair (21). For eYFP and mCherry, Ro is 53 Å, measured by us assuming free fluorophore rotation. The assumption of free rotation of the fluorescent proteins in our experiments is justified, because they are attached to the receptors via long flexible linkers (28).
Figure 2.
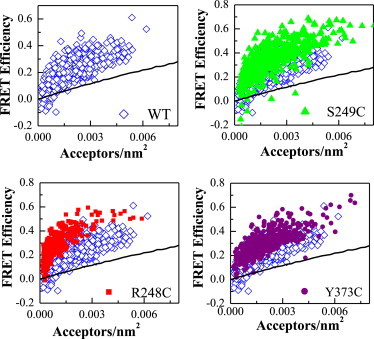
FRET efficiency versus acceptor concentration: wild-type FGFR3 (open blue diamonds), Arg248Cys FGFR3 (red squares), Ser249Cys FGFR3 (green triangles), and Tyr373Cys FGFR3 (purple circles). Each data point represents a single vesicle and has a distinct donor concentration. The solid black line accounts for the proximity FRET, known to occur because of the random approach of donors and acceptors within distances of 100 Å in the membrane. The FRET data lie above this proximity line, indicating specific FGFR3 interactions. The FRET efficiencies measured for the mutant receptors are higher than those measured for the wild-type receptors, indicating that the TDI mutations have an effect on FGFR3 dimerization. To see this figure in color, go online.
Since Ẽ is generally unknown (because the structures of the wild-type and the mutants are unknown and may be different), the quantity measured in the FRET experiments is given by the following
| (8) |
Equation 8 assumes that the probabilities for the formation of donor-donor, donor-acceptor, acceptor-donor, and acceptor-acceptor dimers are the same. This is a reasonable assumption because we use monomeric fluorescent proteins that are not expected to affect dimerization.
The two-state thermodynamic model describing equilibrium between monomers and dimers is given by the following reaction scheme:
| (9) |
Based on this simple dimerization model, the dimeric fraction can be expressed in terms of T, the total receptor concentration, and K, the dimerization constant:
| (10) |
Predictions for dimeric fractions, generated by Eq. 10, were fitted to the experimental data measured according to Eq. 8, while varying the two unknown parameters, namely the dimerization constant, K, and the intrinsic FRET, Ẽ. A least-square two parameter fitting procedure for K and Ẽ was performed for each data set using MATLAB.
The Gibbs free energy of dimerization is calculated for each construct using the following equation
| (11) |
with a standard state defined as 1 nm2/receptor (21).
Finally, the intrinsic FRET value, obtained in the two-parameter fit, allows us to calculate the distance between the fluorescent proteins in each of the different FGFR3 dimer structures, according to Eq. 7.
Statistical analysis
A χ2 analysis was used to compare the wild-type data set with each of the TDI mutant data sets. In particular, we tested the null hypothesis that the data sets being compared were not different. For each data set, the results were averaged within bins of 5 × 10⁴ receptors/nm2. These bins were compared with each other in a pairwise fashion using the following equation:
| (12) |
where i is the number of bins, and avgwt,i and avgmut,i are the average values in the wild-type and mutant bins, respectively. The standard error for each bin, SEi, is defined as follows:
| (13) |
where SEwt,i and SEmut,i are the standard errors in the wild-type and mutant bins, respectively. Finally, using these χi2 values and df, the degrees of freedom, equal to the number of bins minus one, we calculated the reduced χ2 value as follows
| (14) |
We also determined p-values using a χ2 table (29). The cutoff for significance is p < 0.05.
Additional statistical analysis was used to compare the K and Ẽ parameters determined for the wild-type with those determined for each of the mutants. We tested the null hypothesis that the average values were not different from each other. We used GraphPad Prism (La Jolla, CA) to analyze the data with analysis of variance (ANOVA) and to calculate p-values from t-tests.
Results
In the experiments reported in this study, we characterized the unliganded dimerization of wild-type FGFR3 and three TDI mutants in plasma membrane–derived vesicles. Experiments were performed with receptors in which the intracellular domains were substituted with fluorescent proteins (eYFP or mCherry) to allow for FRET detection.
The fluorescent proteins were attached to the TM domains via flexible (GGS)5 linkers, as described in Materials and Methods. The (GGS)5 linker has been shown to be unstructured and behave like a random coil with an apparent radius of ∼45 Å (28), when fused between two proteins. It has been further shown that models that assume free rotations of the fluorescent proteins attached to the two sides of the linker correctly predict the measured FRET efficiency (28). Based on these studies, it can be safely assumed that the fluorophores are rotating freely, and the distance between the fluorophores depends only on the points of attachment of the linkers to the protein, in this case the distance between the C-termini of the TM domains in the dimer.
To obtain vesicles containing FGFR3, we first co-transfected CHO cells with plasmids encoding for either the wild-type or the TDI mutants linked to eYFP and mCherry. Since the receptors are produced in CHO cells, they undergo all required posttranslational modifications, including full glycosylation. Following transfection, plasma membrane–derived vesicles were produced from the CHO cells using an osmotic stress method (23). Such vesicles do not have the actin cytoskeleton (30–32), which is known to play an important role in maintaining the lateral heterogeneity of biological membranes. Consistent with this, we invariably observe homogeneous distribution of fluorescence throughout the vesicle membrane (21,23).
The vesicles were transferred to chambered coverglass slides for image acquisition. They were imaged using a Nikon Eclipse C1 laser scanning confocal microscope. Each vesicle was imaged using three separate scans: a donor scan, a FRET scan, and an acceptor scan, as described in previous publications (25,33–36). Following image acquisition, vesicles were processed using an in-house MATLAB script (21). For each scan of every image, this program identified the membrane of the vesicle and fit the fluorescence intensity across the membrane with a Gaussian function (see Supporting Material). Solutions of purified fluorescent proteins were used to calibrate the donor and acceptor fluorescence intensities as described previously (25). The FRET efficiency, the donor concentration, and the acceptor concentration were determined in each vesicle, as described in Materials and Methods.
In Fig. 2, we show the FRET efficiencies per vesicle plotted against the acceptor concentration in that vesicle; each data point corresponds to a single vesicle. Data for the wild-type, Arg248Cys, Ser249Cys, and Tyr373Cys constructs are shown as open blue diamonds, red squares, green triangles, and purple circles, respectively. Each data set contains ∼500+ single vesicles and was collected in more than 10 independent experiments. The solid black line in Fig. 2 indicates the expected FRET efficiency due to the random approach of donors and acceptors (see (27) for details). This proximity FRET contribution occurs because the fluorophores are confined to the 2D membrane and has been discussed in the literature (26,27,37). The data fall well above this line, which indicates that the FRET we observe is because of specific interactions between the receptors. Furthermore, FRET efficiencies measured for the mutants are higher than the efficiencies for the wild-type. Therefore, the TDI mutations have an effect on FGFR3 dimerization.
FRET due to FGFR3 dimerization was determined by correcting for proximity FRET (27). Then, we calculated the product of the dimeric fraction in the vesicle, fD, and the intrinsic FRET, Ẽ, using Eq. 8. To do so, we need the donor and the acceptor concentrations in each vesicle, which are measured as described in Materials and Methods and are shown in Fig. 3. As discussed previously (21), these are 2D concentrations in the membrane. The dimerization constant is a thermodynamic parameter that describes the propensity for dimerization in quantitative terms. The intrinsic FRET Ẽ is a structural parameter that is very sensitive to changes in dimer structure, since FRET efficiency falls off with the sixth power of distance between fluorophores as seen in Eq. 7. The product of these two parameters, fDẼ, is plotted in Fig. 4 as a function of the total receptor concentration, after averaging the data in bins of width 5 × 10⁴ receptors/nm2.
Figure 3.
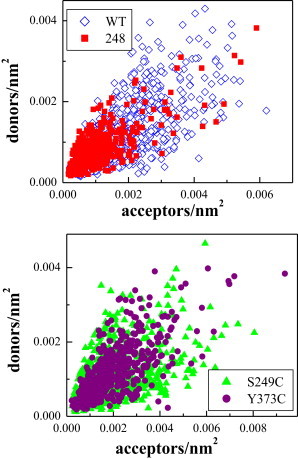
Donor and acceptor concentrations in each individual vesicle: wild-type FGFR3 (open blue diamonds), Arg248Cys FGFR3 (red squares), Ser249Cys FGFR3 (green triangles), and Tyr373Cys FGFR3 (purple circles). To see this figure in color, go online
Figure 4.
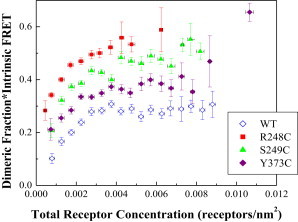
Dimeric fraction times intrinsic FRET, versus total receptor concentration. These data are obtained from the FRET data in Fig. 2 using Eq. 8, and are averaged within 5 × 10⁻⁴ receptors/nm2-wide concentration bins. A reduced χ2 analysis demonstrates that the mutant data sets are significantly different from the wild-type data set. To see this figure in color, go online.
Using χ2 analysis (29), we performed a pairwise comparison of the binned wild-type data set with each of the mutant data sets. Reduced χ2 values of 133.97, 55.33, and 28.91 were calculated for the Arg248Cys, Ser249Cys, and Tyr373Cys mutants, respectively. The corresponding p-values were all <0.001 and the observed differences were highly statistically significant for all the mutants.
Since the experimental data in Fig. 4 depend on both the dimerization constant, K, and the intrinsic FRET, Ẽ, we used Eq. 8 and performed a two parameter fit on each data set to determine the optimal K and Ẽ values for each construct. The results of the fit are shown in Table 1, along with their standard errors (67% confidence intervals). Next, the K and Ẽ values were used to calculate additional characteristics of the dimer; these results are also shown in Table 1. The dimerization Gibbs free energy (dimer stability, ΔG0) was calculated using the dimerization constant and Eq. 11. We also calculated the effect of the mutations on dimer stability (ΔΔG0), given by the difference in dimer stability between a given mutant and the wild-type. From the optimal intrinsic FRET values, we calculated the distance between the fluorescent proteins in each of the different FGFR3 dimers using Eq. 7.
Table 1.
Dimerization constant, K, dimerization free energy, ΔG, and intrinsic FRET, Ẽ, for the wild-type and mutants
| Wild-type | Arg248Cys | Ser249Cys | Tyr373Cys | |
|---|---|---|---|---|
| K | 290 ± 60 | 1110 ± 130 | 500 ± 100 | 590 ± 110 |
| Ẽ | 0.51 ± 0.04 | 0.74 ± 0.03 | 0.73 ± 0.03 | 0.62 ± 0.03 |
| ΔG0 (kcal/mol) | −3.4 ± 0.1 | −4.2 ± 0.1 | −3.7 ± 0.1 | −3.8 ± 0.1 |
| ΔΔG0 (kcal/mol) | −0.8 ± 0.1 | −0.3 ± 0.1 | −0.4 ± 0.1 | |
| d (Å) | 53 ± 1 | 45 ± 1 | 45 ± 1 | 49 ± 1 |
The values of K and Ẽ are optimized in a two parameter fit of the FRET data to a dimer model. Dimer stability is calculated as ΔG0= -RT ln K. The effect of the mutations on dimer stability, ΔΔG0, is the difference between the wild-type and mutant dimer stabilities. The distance between fluorescent proteins, d, is calculated from Ẽ according to Eq. 7.
The dimeric fractions are shown in Fig. 5, along with the binding curves corresponding to the optimal K values. The data are shown as averages within bins of 5 × 10⁴ receptors/nm2. A reduced χ2 analysis demonstrated that the small differences between the wild-type and the mutants are statistically significant. The reduced χ2 values are 36.03, 7.51, and 8.35, such that the p-values are all <0.001. Further statistical analysis, however, shows that the effects are very modest, with the p-values from t-tests being 0.001, 0.15, and 0.006 for the Arg248Cys, Ser249Cys, and Tyr373Cys mutants, respectively. By ANOVA, only the effect of the Arg248Cys mutation is highly statistically significant. Statistical analysis of the values of Ẽ yields p-values of <0.001, <0.001, and 0.03 for the Arg248Cys, Ser249Cys, and Tyr373Cys mutants, respectively. By ANOVA, the effects of the Arg248Cys and Ser249Cys mutations on intrinsic FRET, and thus structure, are highly statistically significant.
Figure 5.
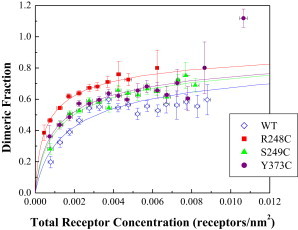
Dimeric fraction versus total receptor concentration. Averaged data are shown in 5 × 10⁻⁴ receptors/nm2-wide bins. The solid line is the dimerization model, given by Eqs. 9 and 10, plotted for the optimized dimerization constants in Table 1. A reduced χ2 analysis demonstrates that the differences between the mutant and wild-type dimeric fractions are statistically significant. To see this figure in color, go online.
Discussion
In FRET studies of RTK dimerization, the measured FRET efficiencies depend on both RTK dimerization propensity and RTK dimer structure (particularly on the distances between the fluorescent proteins in the dimer). Unfortunately, this fact is sometimes not fully appreciated in FRET data interpretation. In addition, the read-out of other experimental techniques used in RTK research also depends on both the dimerization propensity and on structural factors. For instance, receptor phosphorylation, measured in Western blot experiments using anti-phospho-Tyrosine antibodies, requires that the receptors are dimeric but also depends on the exact positioning and orientation of the kinase domains. The TDI mutations have been shown to increase FGFR3 phosphorylation (7), as compared with wild-type, but it is not known if the effect is because of increased dimerization or structural perturbations that promote phosphorylation. Similarly, cross-linking efficiencies, measured in Western blots using anti-receptor antibodies, depend both on the fraction of dimeric receptors and on the presence of suitable amine groups that are in close enough proximity for cross-linking to occur. Thus, a change in cross-linking because of a mutation may be because of either a change in dimerization propensity or a change in structure, or both.
In this study, we characterized the ligand-independent dimerization of three FGFR3 mutants linked to TDI in plasma membrane-derived vesicles using a FRET-based method. We overcome the limitations in data interpretation by separating structural effects from dimerization effects. This is accomplished by fitting a dimer model with two adjustable parameters, the dimerization constant, K, and the structural parameter intrinsic FRET, Ẽ, to the experimental data.
Modest changes in dimer stability because of the TDI mutations in the absence of ligand
Dimerization constants report on the propensity for dimer formation. For the wild-type receptor, we measured a dimerization free energy of ΔG0 = −3.4 ± 0.1 kcal/mol, which is consistent with previous FGFR3 experiments (22,23). Concurrent experiments on the Arg248Cys, Ser249Cys, and Tyr373Cys mutant constructs produced ΔG0 values of −4.2 ± 0.1, −3.7 ± 0.1, and −3.8 ± 0.1 kcal/mol, respectively. Thus, the mutations have a modest effect on dimer stability, confirmed by statistical analysis.
Literature values for the energetic contributions of disulfide bonds to protein interactions vary substantially, with the most consensus lying around −2 to −4 kcal/mol (38,39). Here, we measured that the Arg248Cys, Ser249Cys, and Tyr373Cys mutations stabilize the FGFR3 dimer by −0.8, −0.3, and −0.4 kcal/mol, respectively. These findings may suggest that disulfide bonds form with low probability within the unliganded TDI dimers, most likely because of structural constraints that make it difficult for disulfide bonds to form. This means that, in our experiments, we might probe two different mutant populations—one consisting of a disulfide bonded dimer structure and one consisting of a mutant dimer with a structure that is practically the same as the wild-type—and that our measurements of K and Ẽ are average values, not molecular characteristics of the disulfide bonded mutant dimers.
Modest structural effects because of the TDI mutations in the absence of ligand
Intrinsic FRET values report on the distances between the fluorescent proteins in the dimer and are influenced by the mobility of the fluorescent proteins. We show that the Arg248Cys and Ser249Cys TDI mutations cause statistically significant effects on the intrinsic FRET, implying that there are differences in the structures of the wild-type and mutant dimers. Assuming free rotation of the fluorescent proteins, we calculate the average distance between the fluorescent proteins in the wild-type dimer as 53 ± 1 Å, compared with 45 ± 1 Å, 45 ± 1 Å, and 49 ± 1 Å for the Arg248Cys, Ser249Cys, and Tyr373Cys mutants, respectively. Therefore, the fluorescent proteins are likely closer to each other in the mutant dimers, suggesting a decrease in the separation between the TM domains.
Implications
Disulfide bonds in proteins or protein complexes are always envisioned as very strong, because of their covalent nature. Thus, one expects that disulfide bonds strongly stabilize protein folds and protein assemblies. In accordance with this view, it is believed that the effects of pathogenic cysteine mutations in RTKs are profound, with the disulfide bonds inducing constitutive dimerization. Yet, actual experimental measurements of disulfide bond-mediated stabilization for soluble proteins and dimers point to rather modest effects, on the order of −2 to −4 kcal/mole (38,39). In this study, we present, to our knowledge, the first quantitative measurement of the effect of cysteine mutations on membrane protein interactions. In particular, we study the TDI mutations in FGFR3, which are linked to a lethal phenotype and are thus expected to induce constitutive FGFR3 dimerization. Surprisingly, we see modest effects on FGFR3 dimerization. Furthermore, we see indications of structural perturbations in the FGFR3 dimer due to the mutations. Thus, this study does not support the simple view that the TDI cysteine mutations cause pathologies by inducing constitutive FGFR3 dimerization.
Acknowledgments
This work was supported by GM068619 and GM095930. We thank Sarvenaz Sarabipour, Christopher King, Patrick Byrne, Dr. Daniel Leahy, and Dr. Julia Koehler for useful discussions.
Supporting Material
References
- 1.Cohen M.M., Jr. The new bone biology: pathologic, molecular, and clinical correlates. Am. J. Med. Genet. A. 2006;140:2646–2706. doi: 10.1002/ajmg.a.31368. [DOI] [PubMed] [Google Scholar]
- 2.Cohen M.M., Jr. Some chondrodysplasias with short limbs: molecular perspectives. Am. J. Med. Genet. 2002;112:304–313. doi: 10.1002/ajmg.10780. [DOI] [PubMed] [Google Scholar]
- 3.Passos-Bueno M.R., Wilcox W.R., Kitoh H. Clinical spectrum of fibroblast growth factor receptor mutations. Hum. Mutat. 1999;14:115–125. doi: 10.1002/(SICI)1098-1004(1999)14:2<115::AID-HUMU3>3.0.CO;2-2. [DOI] [PubMed] [Google Scholar]
- 4.Rousseau F., el Ghouzzi V., Bonaventure J. Missense FGFR3 mutations create cysteine residues in thanatophoric dwarfism type I (TD1) Hum. Mol. Genet. 1996;5:509–512. doi: 10.1093/hmg/5.4.509. [DOI] [PubMed] [Google Scholar]
- 5.L'Horte C.G.M., Knowles M.A. Cell responses to FGFR3 signaling: growth, differentiation and apoptosis. Experim. Cell Res. 2005;304:417–431. doi: 10.1016/j.yexcr.2004.11.012. [DOI] [PubMed] [Google Scholar]
- 6.Tavormina P.L., Shiang R., Wasmuth J.J. Thanatophoric dysplasia (types I and II) caused by distinct mutations in fibroblast growth factor receptor 3. Nat. Genet. 1995;9:321–328. doi: 10.1038/ng0395-321. [DOI] [PubMed] [Google Scholar]
- 7.Adar R., Monsonego-Ornan E., Yayon A. Differential activation of cysteine-substitution mutants of fibroblast growth factor receptor 3 is determined by cysteine localization. J. Bone Miner. Res. 2002;17:860–868. doi: 10.1359/jbmr.2002.17.5.860. [DOI] [PubMed] [Google Scholar]
- 8.d’Avis P.Y., Robertson S.C., Donoghue D.J. Constitutive activation of fibroblast growth factor receptor 3 by mutations responsible for the lethal skeletal dysplasia thanatophoric dysplasia type I. Cell Growth Differ. 1998;9:71–78. [PubMed] [Google Scholar]
- 9.Krejci P., Salazar L., Wilcox W.R. Analysis of STAT1 activation by six FGFR3 mutants associated with skeletal dysplasia undermines dominant role of STAT1 in FGFR3 signaling in cartilage. PLoS ONE. 2008;3:e3961. doi: 10.1371/journal.pone.0003961. [DOI] [PMC free article] [PubMed] [Google Scholar]
- 10.Naski M.C., Wang Q., Ornitz D.M. Graded activation of fibroblast growth factor receptor 3 by mutations causing achondroplasia and thanatophoric dysplasia. Nat. Genet. 1996;13:233–237. doi: 10.1038/ng0696-233. [DOI] [PubMed] [Google Scholar]
- 11.Bonaventure J., Horne W.C., Baron R. The localization of FGFR3 mutations causing thanatophoric dysplasia type I differentially affects phosphorylation, processing and ubiquitylation of the receptor. FEBS J. 2007;274:3078–3093. doi: 10.1111/j.1742-4658.2007.05835.x. [DOI] [PubMed] [Google Scholar]
- 12.Harada D., Yamanaka Y., Seino Y. FGFR3-related dwarfism and cell signaling. J. Bone Miner. Metab. 2009;27:9–15. doi: 10.1007/s00774-008-0009-7. [DOI] [PubMed] [Google Scholar]
- 13.Deng C., Wynshaw-Boris A., Leder P. Fibroblast growth factor receptor 3 is a negative regulator of bone growth. Cell. 1996;84:911–921. doi: 10.1016/s0092-8674(00)81069-7. [DOI] [PubMed] [Google Scholar]
- 14.Foldynova-Trantirkova S., Wilcox W.R., Krejci P. Sixteen years and counting: the current understanding of fibroblast growth factor receptor 3 (FGFR3) signaling in skeletal dysplasias. Hum. Mutat. 2012;33:29–41. doi: 10.1002/humu.21636. [DOI] [PMC free article] [PubMed] [Google Scholar]
- 15.Goetz R., Mohammadi M. Exploring mechanisms of FGF signalling through the lens of structural biology. Nat. Rev. Mol. Cell Biol. 2013;14:166–180. doi: 10.1038/nrm3528. [DOI] [PMC free article] [PubMed] [Google Scholar]
- 16.Ornitz D.M. FGFs, heparan sulfate and FGFRs: complex interactions essential for development. BioEssays. 2000;22:108–112. doi: 10.1002/(SICI)1521-1878(200002)22:2<108::AID-BIES2>3.0.CO;2-M. [DOI] [PubMed] [Google Scholar]
- 17.Ornitz D.M., Itoh N. Fibroblast growth factors. Genome Biol. 2001;2:3005. doi: 10.1186/gb-2001-2-3-reviews3005. [DOI] [PMC free article] [PubMed] [Google Scholar]
- 18.Greulich H., Kaplan B., Meyerson M. Functional analysis of receptor tyrosine kinase mutations in lung cancer identifies oncogenic extracellular domain mutations of ERBB2. Proc. Natl. Acad. Sci. USA. 2012;109:14476–14481. doi: 10.1073/pnas.1203201109. [DOI] [PMC free article] [PubMed] [Google Scholar]
- 19.Phay J.E., Shah M.H. Targeting RET receptor tyrosine kinase activation in cancer. Clin. Cancer Res. 2010;16:5936–5941. doi: 10.1158/1078-0432.CCR-09-0786. [DOI] [PubMed] [Google Scholar]
- 20.Iyer G., Milowsky M.I. Fibroblast growth factor receptor-3 in urothelial tumorigenesis. Urol. Oncol. 2013;31:303–311. doi: 10.1016/j.urolonc.2011.12.001. [DOI] [PubMed] [Google Scholar]
- 21.Chen L., Novicky L., Hristova K. Measuring the energetics of membrane protein dimerization in mammalian membranes. J. Am. Chem. Soc. 2010;132:3628–3635. doi: 10.1021/ja910692u. [DOI] [PMC free article] [PubMed] [Google Scholar]
- 22.Chen L., Placone J., Hristova K. The extracellular domain of fibroblast growth factor receptor 3 inhibits ligand-independent dimerization. Sci. Signal. 2010;3:ra86. doi: 10.1126/scisignal.2001195. [DOI] [PMC free article] [PubMed] [Google Scholar]
- 23.Del Piccolo N., Placone J., Hristova K. Production of plasma membrane vesicles with chloride salts and their utility as a cell membrane mimetic for biophysical characterization of membrane protein interactions. Anal. Chem. 2012;84:8650–8655. doi: 10.1021/ac301776j. [DOI] [PMC free article] [PubMed] [Google Scholar]
- 24.Sarabipour S., King C., Hristova K. Uninduced high-yield bacterial expression of fluorescent proteins. Anal. Biochem. 2014;449:155–157. doi: 10.1016/j.ab.2013.12.027. [DOI] [PMC free article] [PubMed] [Google Scholar]
- 25.Li E., Placone J., Hristova K. Quantitative measurements of protein interactions in a crowded cellular environment. Anal. Chem. 2008;80:5976–5985. doi: 10.1021/ac800616u. [DOI] [PubMed] [Google Scholar]
- 26.Wolber P.K., Hudson B.S. An analytic solution to the Förster energy transfer problem in two dimensions. Biophys. J. 1979;28:197–210. doi: 10.1016/S0006-3495(79)85171-1. [DOI] [PMC free article] [PubMed] [Google Scholar]
- 27.King C., Sarabipour S., Hristova K. The FRET signatures of noninteracting proteins in membranes: simulations and experiments. Biophys. J. 2014;106:1309–1317. doi: 10.1016/j.bpj.2014.01.039. [DOI] [PMC free article] [PubMed] [Google Scholar]
- 28.Evers T.H., van Dongen E.M.W.M., Merkx M. Quantitative understanding of the energy transfer between fluorescent proteins connected via flexible peptide linkers. Biochemistry. 2006;45:13183–13192. doi: 10.1021/bi061288t. [DOI] [PubMed] [Google Scholar]
- 29.Bevington P.R. McGraw-Hill Book Company; New York: 1969. Data reduction and error analysis for the physical sciences. [Google Scholar]
- 30.Scott R.E. Plasma membrane vesiculation: a new technique for isolation of plasma membranes. Science. 1976;194:743–745. doi: 10.1126/science.982044. [DOI] [PubMed] [Google Scholar]
- 31.Scott R.E., Maercklein P.B. Plasma membrane vesiculation in 3T3 and SV3T3 cells. II. Factors affecting the process of vesiculation. J. Cell Sci. 1979;35:245–252. doi: 10.1242/jcs.35.1.245. [DOI] [PubMed] [Google Scholar]
- 32.Scott R.E., Perkins R.G., Maercklein P.B. Plasma membrane vesiculation in 3T3 and SV3T3 cells. I. Morphological and biochemical characterization. J. Cell Sci. 1979;35:229–243. doi: 10.1242/jcs.35.1.229. [DOI] [PubMed] [Google Scholar]
- 33.Placone J., Hristova K. Direct assessment of the effect of the Gly380Arg achondroplasia mutation on FGFR3 dimerization using quantitative imaging FRET. PLoS ONE. 2012;7:e46678. doi: 10.1371/journal.pone.0046678. [DOI] [PMC free article] [PubMed] [Google Scholar]
- 34.Placone J., He L., Hristova K. Strong dimerization of wild-type ErbB2/Neu transmembrane domain and the oncogenic Val664Glu mutant in mammalian plasma membranes. Biochim. Biophys. Acta. 2014;1838:2326–2330. doi: 10.1016/j.bbamem.2014.03.001. [DOI] [PMC free article] [PubMed] [Google Scholar]
- 35.Sarabipour S., Hristova K. Glycophorin A transmembrane domain dimerization in plasma membrane vesicles derived from CHO, HEK 293T, and A431 cells. Biochim. Biophys. Acta. 2013;1828:1829–1833. doi: 10.1016/j.bbamem.2013.03.022. [DOI] [PMC free article] [PubMed] [Google Scholar]
- 36.Sarabipour S., Hristova K. FGFR3 transmembrane domain interactions persist in the presence of its extracellular domain. Biophys. J. 2013;105:165–171. doi: 10.1016/j.bpj.2013.05.053. [DOI] [PMC free article] [PubMed] [Google Scholar]
- 37.Freire E., Snyder B. Quantitative characterization of the lateral distribution of membrane proteins within the lipid bilayer. Biophys. J. 1982;37:617–624. [PMC free article] [PubMed] [Google Scholar]
- 38.Betz S.F. Disulfide bonds and the stability of globular proteins. Protein Sci. 1993;2:1551–1558. doi: 10.1002/pro.5560021002. [DOI] [PMC free article] [PubMed] [Google Scholar]
- 39.McAuley A., Jacob J., Matsumura M. Contributions of a disulfide bond to the structure, stability, and dimerization of human IgG1 antibody CH3 domain. Protein Sci. 2008;17:95–106. doi: 10.1110/ps.073134408. [DOI] [PMC free article] [PubMed] [Google Scholar]
Associated Data
This section collects any data citations, data availability statements, or supplementary materials included in this article.