

Abstract
Background
Pharmacovigilance signal detection largely relies on individual case reports, but longitudinal health data are being explored as complementary information sources. Research to date has focused on the ability of epidemiological methods to distinguish established adverse drug reactions (ADRs) from unrelated adverse events.
Objective
The aim of this study was to evaluate a process for structured clinical and epidemiological assessment of temporally associated drugs and medical events in electronic medical records.
Methods
Pairs of drugs and medical events were selected for review on the basis of their temporal association according to a calibrated self-controlled cohort analysis in The Health Improvement Network. Six assessors trained in pharmacovigilance and/or epidemiology evaluated seven drugs each, with up to 20 medical events per drug. A pre-specified questionnaire considered aspects related to the nature of the temporal pattern, demographic features of the cohort, concomitant medicines, earlier signs and symptoms, and possible confounding by underlying disease. This informed a classification of drug–event pairs as known ADRs, meriting further evaluation, or dismissed.
Results
The number of temporally associated medical events per drug ranged from 11 to 307 (median 50) for the 42 selected drugs. Out of the 509 relevant drug–event combinations subjected to the assessment, 127 (25 %) were classified as known ADRs. Ninety-one (24 %) of the remaining pairs were classified as potential signals meriting further evaluation and 291 (76 %) were dismissed. Suggestive temporal patterns and lack of clear alternative explanations were the most common reasons that drug–event pairs were classified as meriting further evaluation. Earlier signs and symptoms and confounding by the underlying disease were the most common reasons that drug–event pairs were dismissed.
Conclusions
Exploratory analysis of electronic medical records can detect important potential safety signals. However, effective signal detection requires that statistical signal detection be combined with clinical and epidemiological review to achieve an acceptable false positive rate.
Key Points
| Exploratory analysis of electronic medical records can detect important potential safety signals. |
| To achieve an acceptable false positive rate, statistical signal detection should be combined with clinical and epidemiological review. |
| Such review also requires a deep understanding of the analytical methods employed, and insight into data collection and medical practice in the setting at hand. |
Introduction
Post-marketing surveillance aims to identify and characterize risks of medicines. Regulatory authorities, pharmaceutical companies, the World Health Organisation (WHO) and others need reliable methods to identify, manage and communicate new adverse drug reactions (ADRs), as early as possible. At present, signal detection is predominantly based on individual case reports of suspected harm from medicine, but the use of longitudinal health data to detect ADRs is an area of active research [1–5]. Individual case reports have a proven value for safety signal detection, but are not optimal for detecting increased rates of multi-factorial adverse events with high background incidence or for disentangling strongly confounded associations [6]. Longitudinal observational data provide the basis for epidemiological evaluation in such scenarios and should in principle enable their initial identification. At the same time, surveillance for yet unknown risks is very different from testing well-defined hypotheses. Hypothesis-free surveillance requires careful consideration and ingenuity up front to devise methods that are applicable to a broad range of drugs and medical events, and then a perhaps even greater effort to draw the right conclusions from the observed results.
Most studies of methods for signal detection in longitudinal data have focused on assessing to what extent statistical and epidemiological methods can distinguish known ADRs from drugs and adverse events for which there is evidence against a causal association [7–10]. Few have sought to define and evaluate processes for identification of emerging safety signals in longitudinal health data [11]. Clearly, these are very different challenges. We hypothesized that signal detection in longitudinal health data would require effective processes for clinical and epidemiological review of highlighted associations, similar to the processes for signal detection in spontaneous reports.
The aim of this study was to evaluate a process for structured assessment of temporally associated drugs and medical events identified in exploratory analysis of longitudinal health data with a self-controlled cohort analysis. We sought to determine to what extent exploratory analysis of longitudinal health data would identify potential safety signals of importance, and what proportion of false alarms to expect assuming that the temporal associations had been taken at face value instead of being subjected to epidemiological review.
Methods
Six assessors trained in pharmacovigilance and/or epidemiology evaluated up to 20 temporally associated medical events for each of seven drugs per assessor, according to a pre-specified questionnaire. Drugs were randomly selected, and for each drug, a random selection was made among medical events temporally associated with new prescriptions of the drug. Temporal associations were identified according to a self-controlled cohort analysis in The Health Improvement Network (THIN). The questionnaire for manual review considered aspects such as the nature of the temporal pattern, the presence of co-medications associated with the medical event, the likelihood of confounding by underlying disease, and other alternative explanations for observed temporal associations. It focused exclusively on strength of evidence, and for practical purposes, it was restricted in scope and did not include review of individual patient histories, consultation of the scientific literature, or consideration of the temporal patterns for similar drugs and medical events, which would be important for a full clinical and epidemiological assessment.
The Health Improvement Network (THIN)
THIN is an electronic medical record data resource including over 12 million individual patients from the UK, with over 3.8 million being currently active patients. The electronic medical records are collected from general practices in primary care, covering 6 % of the UK population, and are representative of the entire UK population as regards age, sex, medical conditions and death rates [12, 13]. The data extract used for the purpose of this study was from January 2011 and covers 7.7 million patients.
For the purpose of the subsequent analyses, prescription codes were mapped to the WHO Drug Dictionaries™ [14] and grouped at the substance level for analysis (combination products were not included in the study). Medical events were analyzed at the fourth level of the Read code terminology, grouping subordinate terms. An exception to this general rule was made for medical events coded directly to a higher level, e.g., K04.. acute renal failure (third level). These were analyzed as separate terms. In addition, custom groups of Read terms for medical events previously highlighted as important for ADR surveillance [15] were also used in the screening.
Not all Read terms are relevant to safety signal detection. For the purpose of the study, we excluded terms related to, for example, administration, examination, diagnostic or lab procedures, or unspecified conditions. Since our basis for identifying temporal associations in the study was a self-controlled analysis (see Sect. 2.2.2), we also excluded events related to birth or pregnancy and to death.
vigiTrace
vigiTrace is a framework for exploratory analysis of longitudinal electronic health data, and for the purpose of the study, provided analytics in support of the structured assessment described in Sect. 2.3.2. Its core methodology has been previously published [1], and its self-controlled cohort analysis for temporal association screening has been evaluated by the Observational Medical Outcomes Partnership as ‘IC1 Temporal Pattern Discovery’ [8, 9, 16, 17].
A graphical user interface implementing the vigiTrace components described below for the THIN database provided the environment in which all analyses were performed.
Chronograph
A core component of vigiTrace is its statistical graphical display referred to as the chronograph, which summarizes and visualizes temporal associations between two events [1]. In the context of this study, we focused on temporal associations between new prescriptions of medicines and medical events. A ‘new prescription’ was defined as a prescription without any preceding prescription of the same drug substance recorded for that patient in a period of 13 months leading up to the prescription of interest. The new-user paradigm is well suited to early onset ADRs, for which the inclusion of prevalent users would have risked diluting true causal associations.
The chronograph focuses on the cohort of patients with new prescriptions of the medicine of interest and explores variation over time in the recording of the medical event relative to those new prescriptions. It contrasts the observed number of patients with a record of the medical event of interest to an expected value in each time period, based on an external control group. Here, we used the broadest possible external control group including new prescriptions of any other drug, but more narrow control groups are possible [16].
In the chronograph, the observed count for a specific time period denotes the number of new prescriptions of a specific medicine (e.g., nifedipine) followed by a specific medical event (e.g., oedema) in a specific time period (e.g., the first 30 days after the new prescription). The expected value for the same period is based on the proportion of new prescriptions of a medicine in the external control group (here, all other medicines) followed by the same medical event (here, oedema) in the same time period (here, the first 30 days after the new prescription) multiplied by the total number of new prescriptions of the specific medicine (here, nifedipine).
Examples of chronographs are provided in Sects. 3.2 and 3.3. The chronograph displays the observed and expected values (bottom panel) as well as their corresponding observed-to-expected ratio subjected to statistical shrinkage and presented on a logarithmic scale (referred to as the information component (IC); top panel) [1]. The bottom panel emphasizes absolute differences, whereas the top panel emphasizes relative differences; together they provide a more complete view of the temporal pattern of interest. The histogram of observed counts in the bottom panel provides the most immediate overview of the temporal pattern. However, this pattern is sensitive to censoring and other sources of systematic variability, such as general increases in the recording of medical events around the time of prescription, possibly reflecting follow-up visits, or the increased rates of abnormal lab test results sometimes observed because of closer monitoring of treated patients [16]. The expected value enables observed counts to be calibrated for such systematic variability, resulting in the observed-to-expected ratio, which should provide a more robust basis for analysis.
In screening for possible ADRs, we focus on shifts in the observed-to-expected ratios, and especially on asymmetries where the observed-to-expected ratio increases markedly soon after a new prescription. Causal association is one possible explanation for such patterns, but there are many others [18], as we shall also see below. Other regions of the chronograph provide useful complementary information. The region to the far left reflects the experience of the patients eventually exposed to the drug of interest, years before prescription of the drug, and can highlight a higher (or lower) baseline risk for the medical event compared with other patients in the same database. Similarly, the region to the far right reflects the experience of the patients years after they are first exposed to the drug, and may provide useful information on whether an increased observed-to-expected ratio persists or desists over time. The period immediately to the left of the center reflects the months leading up to new prescriptions, where decreased rates of the medical event could reflect contraindications, and increased rates could reflect confounding by the underlying disease or indication for treatment. All these periods are important in the structured assessment of potential signals.
Self-Controlled Cohort Analysis
Beyond the chronograph, vigiTrace provides a self-controlled cohort analysis, on the basis of which temporal associations between initiation of treatment with a drug and various medical events can be identified. In our study, it is used to select temporal associations for in-depth manual review.
The calibrated self-controlled cohort analysis in vigiTrace combines two approaches to confounder adjustment: comparison to control periods prior to treatment in the cohort of exposed patients (self-controlled design) and calibration by an external control group (comparator design) [16]. The self-controlled component of the analysis aims to adjust for confounding related to time-constant, systematic differences between patients exposed to the medicine of interest and patients in the comparator group (e.g., patient sex or chronic concomitant medication). The comparator component of the analysis aims to adjust for systematic differences between the surveillance periods and the control periods (e.g., those related to their lengths or the reliability with which the medical event of interest is recorded). An observed-to-expected ratio for the temporal association is computed as the ratio of the observed-to-expected ratio in a surveillance period to that in a control period, where the observed-to-expected ratio for each time period compares new users of the drug of interest with patients in the external control group. The observed-to-expected ratio for the temporal association is subjected to simple statistical shrinkage with a Gamma-Poisson model. The logarithm of the shrunk observed-to-expected ratio is referred to as IC∆ and the lower bound of its two-sided 95 % credibility interval as IC∆025 [1, 16].
The implementation used here considers two post-exposure surveillance periods: the first 30 days after the new prescription and day 31–180, inclusive. It considers four pre-exposure control periods: the day of the new prescription, 30 days prior to the new prescription, 360–31 days prior to the new prescription, and a longer historical control period ranging from 3 years prior to 1 year prior to the new prescription. For external control group, it uses prescriptions of all drugs except those that have been identified as influential outliers for the medical event of interest, in a procedure adapted from Juhlin et al. [19].
Additional Descriptive Statistics
To support the exploration of possible alternative explanations to an observed temporal association, vigiTrace incorporates a range of descriptive statistics. For any observed count of interest, the distributions of patient age and sex, calendar time of prescription, time lapse from prescription to medical event, and duration of treatment can be displayed. Importantly, they can be viewed side by side with the corresponding distributions for the database as a whole, for other prescriptions of the same drug, and for other prescriptions followed by the same medical event. This is important for correct interpretation; if men are over-represented for those prescriptions of a drug that are followed by a particular medical event, it is interesting to see if men are over-represented for that drug in general, for that medical event in general, or in the data set as a whole.
The descriptive statistics in vigiTrace also include frequency tables for other drugs and medical events in different time frames relative to the prescription or medical event of interest. This enables assessment of the most common drugs and medical events recorded on the same day as the drug or medical event of interest, in the month(s) leading up to it, or across the entire histories of the patients included in the cohort. High rates of what may be symptoms of the medical event of interest prior to the new prescription may suggest a protopathic bias. Protopathic bias is when a drug is prescribed for the early manifestation of a disease, and the disease itself is not diagnosed until after initiation of treatment. High rates of drugs with a known propensity to cause the event, may on the other hand suggest that the drug of interest is an innocent bystander.
Empirical Evaluation
The study was performed over the course of 3 months by six scientists with pharmacovigilance and/or epidemiological expertise. Each assessor analyzed seven drugs each, as well as one additional drug that had been analyzed by another assessor. The analysis of the additional drug was used to study inter-assessor variability (this was blinded to the study participants in the sense that they did not know which of their assessments was replicated nor which of their assessments were for replication).2 The assessors were divided in two groups of three, within which discussions of unforeseen issues and questions raised during the course of the study were allowed. The assessment of inter-assessor variability had been designed so that no two members of the same group replicated one another’s assessments. Meetings to discuss general issues with all six analysts were also held throughout the study period, to ensure consistency, although these discussions did not include specific drug–event pairs.
Scope
Forty-two drugs in THIN were randomly selected. This excluded drugs with less than 5,000 new prescriptions as defined in Sect. 2.2.1, those without Summary of Product Characteristics (SPC) information in the UK, minerals, vitamins, bulk-forming laxatives, disinfectants, homoeopathic remedies, and drugs used predominantly in infancy. For each drug, a random selection of up to 20 medical events was made from the medical events identified as temporally associated with a new prescription of the drug of interest, according to vigiTrace’s self-controlled cohort analysis described above (IC∆025 > 0 for either of the two surveillance periods). In order to avoid conflicts of interest, the allocation of drugs was set up so that assessors employed by pharmaceutical companies were not asked to assess drugs for which their company is a marketing authorization holder.
Prior to in-depth analysis, medical events were assessed for relevance, and drug–event pairs related to administrative notes (e.g., ‘Palliative care plan review’ or ‘Medication review due’), absence of a medical event (e.g., ‘No earache’), suboptimal therapy (e.g., overdoses and medication errors), or procedures (e.g., ‘Diagnostic bronchoscopic examination below trachea’) were excluded from in-depth analysis.
Structured Assessment
The in-depth assessment followed a structured questionnaire and involved review of the UK SPC document for the drug of interest and further exploration of data in THIN for the drug–medical event pair of interest (see Table 1). A first version of the questionnaire was developed by three of the co-authors (SC, KS, GNN). This was reviewed and revised after discussion among all co-authors, and then evaluated and refined in a pilot study of three randomly selected drugs, separate from those included in the main study. Prior to the study, the six assessors received training in the analytical methodology, including the self-controlled cohort analysis and chronographs, but their expertise and experience of interpreting these analyses varied.
Table 1.
Questionnaire for structured assessment of temporally associated combinations
| UK SPC Check | ||
| Labeled? | Is the medical event a known adverse drug reaction to the drug of interest according to its UK SPC (exact term, synonym, or adjacent term)? | If so, halt the assessment here and classify the drug–event pair as ‘No: labeled’ |
| Indication | Is the medical event an indication for treatment with the drug? | As listed in the UK SPC |
| Contraindications | Is the medical event a contraindication for treatment with the drug? | As listed in the UK SPC |
| Mechanism | Can the medical event be explained by the currently known pharmacological mechanism of the drug? | Consideration of complementary information sources was allowed by the protocol |
| Underlying disease | Can the event be explained by the patients’ likely underlying disease? | Based on the indications for treatment described in the UK SPC |
| Temporal pattern | ||
| Elevation prior | Is the relative difference between the observed and expected rates of the medical event (as measured by the IC value) greater in the months immediately prior to prescription compared with further back? | An increase in the months leading up to the initiation of treatment could suggest temporal confounding by indication or the underlying (severity of) disease |
| Higher than external control group | Does the observed rate of the medical event exceed the expected in the surveillance period, 0–6 months following prescription? | An observed rate that exceeds not only that in the same patients before initiation of treatment, but also that in the external control group might strengthen the suspicion of a true causal effect |
| Time to onset | Does the observed pattern of times to onset for the patients with the medical event in the surveillance period strengthen or weaken the suspicion of a causal effect? | Evaluated with a resolution of days, within the original surveillance period (so conditional on the originally identified temporal association: a so-called orthogonal evaluation within the data set at hand) |
| Persistent elevation | Is the elevated rate of the medical event persistent over time, across the 3-year post-prescription observation period? | A consistent elevation for an acute and transient medical event and/or short-term treatment might weaken the suspicion of a true causal effect |
| Shorter duration | Is the duration of treatment with the drug shorter in patients with the medical event of interest in the surveillance period than for other prescriptions of the same drug? | A shorter duration of treatment in patients suffering the medical event might indicate that the patient or health professional suspected the drug to have caused the adverse event and therefore stopped treatment with the drug. This could strengthen the suspicion of a true causal effect, although other explanations, such as lack of effect, are possible |
| Not renewed | In how many of the patients with the medical event registered in the surveillance period was the prescription of the drug not renewed after the medical event? | For drugs that are used long-term this may convey similar information as a shorter duration, but the same would not be true for drugs used short-term, e.g., a course of antibiotics |
| Within duration | For what percentage of patients did the medical event occur within the estimated duration of treatment with the drug? | If a substantial proportion of the medical events occurred after the end of the estimated duration of treatment, this may weaken the suspicion of a true causal effect |
| Demographics | ||
| Sex | Is there a dominant sex among the patients with the medical event in the surveillance period; if so, do the chronographs restricted to each sex differ in important ways from the overall chronograph? | If sex is a risk factor, the unadjusted chronograph may not reflect the temporal pattern of interest |
| Age | Is there a dominant age group among the patients with the medical event in the surveillance period; if so, do the chronographs restricted to each age group differ in important ways from the overall chronograph? | If age is a risk factor, the unadjusted chronograph may not reflect the temporal pattern of interest |
| Dosage and route | Among patients with the medical event in the surveillance period, is there a dominant dosage form or route of administration, and if so does this strengthen or weaken the suspicion of a true causal effect. | A dominant dosage form for which the medical event is an unlikely adverse reaction (e.g., influenza after topically applied calcipotriol, which has very low bioavailability) might weaken the strength of suspicion |
| Calendar year | Is there any variability in the recording of the drug and medical event by calendar year that is worth noting? | Variations in the use of drugs and the coding of medical events could affect their temporal association |
| Medical history | ||
| Concomitant drugs | Among the frequently prescribed drugs in the 180 days leading up to the medical event are there drugs for which this is a labeled adverse drug reaction according to the UK SPC? | Might suggest that the drug of interest is an innocent bystander |
| Earlier signs and symptoms | Among the frequently recorded medical events in the 180 days leading up to the prescription of interest, are there any that may represent signs and symptoms of the medical event of interest? Alternatively, are there frequently recorded concomitant drugs that may suggest underlying disease similar to the medical event of interest? | This would suggest that the medical event occurred prior to initiation of treatment so that no causal effect is possible; might reflect a protopathic bias |
The final assessment was formulated as a response to ‘Does the drug–event combination merit further evaluation?’ with three possible options: ‘Yes,’ ‘No—labeled’ and ‘No—dismissed.’ Each assessment was accompanied by a written motivation. The anticipated further evaluation should include the aspects that were excluded from the scope of the study at hand such as review of individual patient histories, analysis of related drugs or medical events, and consultation of the scientific literature. Pending additional analyses, the combinations classified as meriting further evaluation here should be considered to be potential signals.
Results
Overall Results
Figure 1 presents the overall results. The number of temporally associated medical events per drug, as identified by vigiTrace, ranged from 11 to 307 (median 50) for the 42 selected drugs. Out of the 509 relevant drug–event combinations, 127 (25 %) were classified as known ADRs on the basis of manual review of the UK SPC. Examples include confusion for baclofen, glaucoma for paroxetine (‘acute glaucoma’ is listed), and sleep disturbances for buspiron (‘insomnia’ is listed).
Fig. 1.
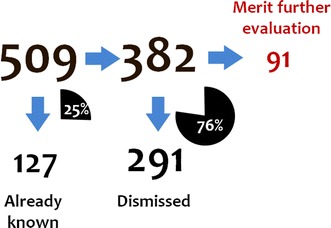
Overall assessment results pooled across the six assessors for the 509 highlighted medical events considered to be relevant as potential adverse drug reactions
Out of the remaining 382 combinations, 91 (24 %) were classified as meriting further evaluation. Examples are provided in Sect. 3.2. The most common reasons given for classifying drug–event combinations as meriting further evaluation were suggestive temporal patterns and lack of alternative explanations (often in combination). Beyond that, a fair number of combinations were selected on the basis of medical plausibility or supporting evidence, including on a few occasions hypothesized mechanisms of action.
A total of 291 out of 382 (76 %) combinations were dismissed. The most common reasons given for dismissing drug–event combinations were confounding by underlying disease or earlier signs and symptoms of the medical event in the prior patient record.
Examples of Combinations that Merit Further Evaluation
Below are three examples of combinations classified as meriting further evaluation. They have been selected in order to illustrate the diversity of this group, and some of the most common motivations. They are not the three strongest potential signals, but illustrate how the strength of suspicion varies within this group. Multiple organ failure with paroxetine occurred only in three patients and was classified as meriting further evaluation primarily on the grounds that it is an important medical event that could not be dismissed on the basis of the available information. Skin sensation disturbances with salmeterol is an example from the large group of combinations selected for further evaluation for a lack of a clear alternative explanation, but is also supported by a suggestive temporal pattern. Epiphora with amiloride represents a smaller group of combinations supported by external evidence or biological plausibility.
Multiple Organ Failure with Paroxetine
Multiple organ failure with the selective serotonin reuptake inhibitor (SSRI), paroxetine, was highlighted by vigiTrace on the basis of three observed events in 31–180 days after initiation of treatment versus zero expected (IC∆ = 3.82, IC∆025 = 0.76). Multiple organ failure is neither an indication for treatment nor a formal contraindication for paroxetine, and the assessor identified no clear association with underlying disease. The chronograph is based on very limited data, but there are no patients with multiple organ failure events in the 3 years leading up to initiation of treatment with paroxetine (see Fig. 2). A similar asymmetry is reflected in the expected count. The three patients with multiple organ failure in the surveillance period were a 48-year-old woman, a 51-year-old man, and a 69-year-old man. The assessor noted that none of the patients was estimated to be on paroxetine at the time of the multiple organ failure, according to the algorithm used to estimate duration of treatment. From the summary statistics, the assessor identified no concomitant medicines known to cause multiple organ failure nor any earlier signs and symptoms of multiple organ failure. The combination was classified as ‘Merits further evaluation’ on the basis of the temporal asymmetry and the importance of the medical event (not formally considered in the questionnaire). The further evaluation of this combination should include an examination of the medical history at the patient level as well as an analysis of similar drugs, such as other SSRIs. Additionally, random variability is a concern, given the low case count (three), and other databases should be explored to see if the pattern is replicated, to rule out the suspicion that the observed deviation here is a result of random variability.
Fig. 2.
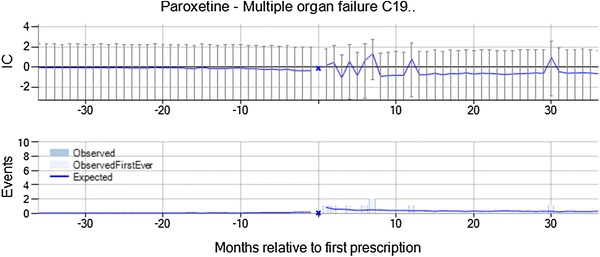
Multiple organ failure is temporally associated with new prescriptions of paroxetine, and was classified as meriting further evaluation on account of the temporal asymmetry and the importance of the medical event. IC information component
It should be noted that multiple organ failure is likely to be associated with high mortality and that paroxetine is recommended to be used with caution in patients with severe renal impairment or with hepatic impairment, restricting the dose to the lowest end of the dosage range; it would therefore be unusual for patients with multiple organ failure to be prescribed paroxetine. Consequently, this combination is not ideally suited for analysis by a self-controlled design such as the one used here, since the assumption that the event does not affect the likelihood of future exposures is not valid. In this case, multiple organ failure may by chance follow paroxetine prescriptions in some patients, but be less likely to precede paroxetine prescriptions, since many patients who suffer multiple organ failure do not survive, and those who do would be less likely to be prescribed paroxetine. vigiTrace adjusts for general differences between the surveillance period and the control periods in the external control group, but would fully correct for this only if multiple organ failure reduces the likelihood of future prescriptions of paroxetine as much as it reduces the likelihood of future prescriptions of other drugs in the external control group.
Skin Sensation Disturbance with Salmeterol
Skin sensation disturbance with the long-acting beta-2 agonist salmeterol was highlighted by vigiTrace on the basis of 262 observed events in 31–180 days after initiation of treatment versus 218 expected (IC∆ = 0.26, IC∆025 = 0.08). The most commonly recorded terms were paraesthesia (45 %), numbness (36 %), tingling of skin (10 %), and burning of skin (5 %). Skin sensation disturbance is neither an indication for treatment nor a contraindication for salmeterol, whereas a possible association with the underlying disease could not be ruled out. In the chronograph, there is a transient increase in the event rate from month 2, with a decrease in the event rate in the month immediately before and after treatment initiation (see Fig. 3). It was noted that most patients were between 35 and 80 years of age, but that this is consistent with the distribution for skin sensation disturbance in the database as a whole. For 68 % of the patients, the prescription of salmeterol was renewed some time after the skin sensation disturbance event, and the duration of treatment was similar to that for salmeterol in general. However, only 6.5 % were estimated to be on salmeterol treatment at the time of the skin sensation disturbance event, according to the algorithm used to estimate duration of treatment. From the summary statistics, the assessor identified no concomitant medicines known to cause skin sensation disturbance nor any earlier signs and symptoms in these patients. The combination was classified as ‘Merits further evaluation’ by the assessor on the basis of the lack of a clear alternative explanation for the transient increase in the rate of the event from 2 months after initiation of treatment. The relative decrease in the rate of skin sensation disturbance in the month before and after new salmeterol prescriptions has not been explained. It is worth noting that the study protocol only required the reviewer to check the UK SPC to determine whether the ADR was known; subsequent examination of the combination revealed that paraesthesia is labeled on the US FDA product information.
Fig. 3.
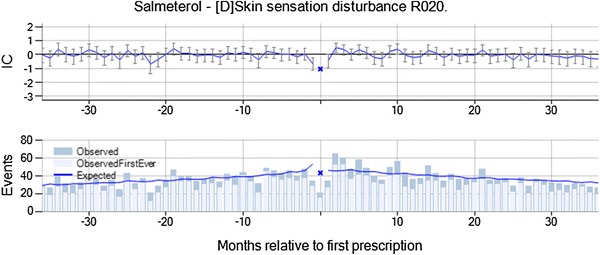
Skin sensation disturbance is temporally associated with new prescriptions of salmeterol, and was classified as meriting further evaluation on account of the lack of a clear alternative explanation for the suggestive temporal pattern. IC information component
Epiphora with Amiloride
Epiphora with amiloride, a potassium-conserving diuretic drug, was highlighted by vigiTrace on the basis of 12 observed events in 31–180 days after initiation of treatment versus five expected (IC∆ = 1.15, IC∆025 = 0.22). Epiphora is neither an indication nor a contraindication for amiloride, nor is it likely to be related to the underlying disease in these patients. In the chronograph, there is a transient increase in the event rate most pronounced from month 4 to 7, with no prior elevation (see Fig. 4). There is an over-representation of elderly and female patients among those that suffer from epiphora following amiloride, but the temporal pattern was found to be similar in each of those two subgroups. For seven out of the 12 patients, the prescription of amiloride was not renewed after the epiphora event, but the duration of treatment was not shorter than for amiloride in general. Six out of the 12 patients were estimated to still be on amiloride treatment at the time of the epiphora event. From the summary statistics, the assessor identified no concomitant medicines known to cause epiphora. However, the frequent earlier signs and symptoms included acute bronchitis, cough, and headache, which could be related to rhinitis that is known to cause epiphora. It was also noted that many of the patients were smokers. The combination was classified as ‘Merits further evaluation’ by the assessor on the basis of the suggestive temporal pattern and a possibly supporting animal study. The latter was identified in a preliminary review of the literature to identify a potential mechanism for this association and showed that amiloride eye drops increased tear production in rabbits. While the observed temporal association seen in our study was for oral amiloride, and not eye drops, the mechanism of action is not fully understood.
Fig. 4.
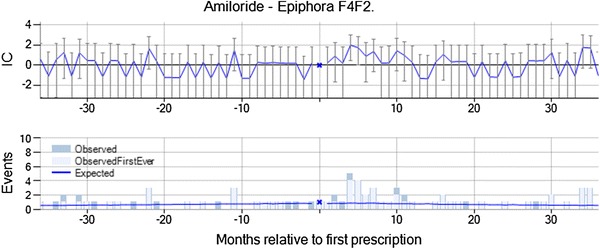
Epiphora is temporally associated with new prescriptions of amiloride, and was classified as meriting further evaluation on account of the suggestive temporal pattern and a possibly supporting animal study. IC information component
Examples of Dismissed Combinations
Below are three examples of dismissed combinations. They have been selected in order to illustrate the diversity of this group, and some of the most common motivations. Other Eustachian tube disorder with gentamicin and endometriosis with hyoscine exemplify confounding by the underlying disease and/or protopathic bias. Open-angle glaucoma with dithranol exemplifies the combinations dismissed because medical events in the prior patient record suggest that the disease pre-dated the initiation of treatment.
Other Eustachian Tube Disorder with Gentamicin
Other Eustachian tube disorder with gentamicin, an aminoglycoside antibiotic with broad-spectrum bactericidal activity, was highlighted by vigiTrace on the basis of 73 observed events in 30 days after initiation of treatment versus 45 expected (IC∆ = 0.69, IC∆025 = 0.34). The actual reported term was Eustachian tube dysfunction in all cases. There is an over-representation of female patients, but the temporal pattern is similar for this subgroup. For 90 % of the patients, the prescription of gentamicin was not renewed after the Eustachian tube dysfunction event, and the duration of treatment was similar to that for gentamicin in general. Sixty-three percent of the patients were estimated to still be on gentamicin treatment at the time of the event. From the summary statistics, the assessor identified no concomitant medicines known to cause Eustachian tube dysfunction, but events such as otitis externa, otalgia, and blocked ear were common on the day of the prescription and in the months leading up to the prescription. The combination was dismissed from further evaluation by the assessor on account of suspected confounding by the underlying disease and possible protopathic bias. While the observed-to-expected ratio for the surveillance period is higher than those in each control period, the rate already begins to increase in the months leading up to the new gentamicin prescription (see Fig. 5), which supports the suspicion that gentamicin may have been prescribed for the Eustachian tube disorder or earlier manifestations thereof. At the same time, ‘Ear and Labyrinth Disorders: Local sensitivity; ototoxicity; vestibular disorder; hearing loss’ are listed ADRs in the SPC for gentamicin. It was noted that in this instance, the only reason that we could classify this drug–event pair so confidently is because we already know so much about gentamicin and ototoxicity. Had it been a less well-known drug, the vagueness of the event term may have prevented any useful interpretation.
Fig. 5.
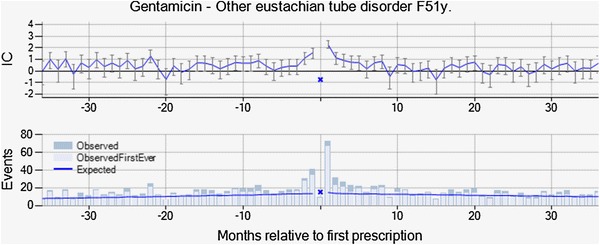
Other Eustachian tube disorder is temporally associated with new prescriptions of gentamicin, but was dismissed from further evaluation on the basis of the observed temporal pattern, with an increased rate in the months leading up to prescription. IC information component
Endometriosis with hyoscine
Hyoscine butylbromide is indicated for the relief of spasm of the genito-urinary tract or gastro-intestinal tract and for the symptomatic relief of irritable bowel syndrome. Endometriosis with hyoscine was highlighted by vigiTrace on the basis of 269 observed events in 31–180 days after initiation of treatment versus 178 expected (IC∆ = 2.25, IC∆025 = 0.99). In the chronograph, there is a gradual increase in the observed-to-expected ratio with a peak between month 3 and 7 (see Fig. 6). However, the increased rate compared with before hyoscine treatment remains for 3 years after initiation of treatment. Endometriosis is not an indication or contraindication for hyoscine, but hyoscine is used to treat abdominal cramps, which are a common symptom of endometriosis. It was noted that all patients were female of child-bearing age, but no subgroup analysis was performed. For 74 % of the patients, the prescription of hyoscine was not renewed after the recording of endometriosis and the duration of treatment was similar to that for hyoscine in general. Only 2 % of the patients were estimated to still be on hyoscine treatment at the time of the event. From the summary statistics, the assessor identified no concomitant medicines known to cause endometriosis, but symptoms of endometriosis such as abdominal pain were common on the day of the prescription and in the months leading up to the prescription. It was dismissed from further evaluation by the assessor on account of suspected protopathic bias. It is likely that patients presented with abdominal pain were prescribed hyoscine, and subsequent investigations (e.g., ultrasound) then revealed endometriosis as the cause of the pain.
Fig. 6.
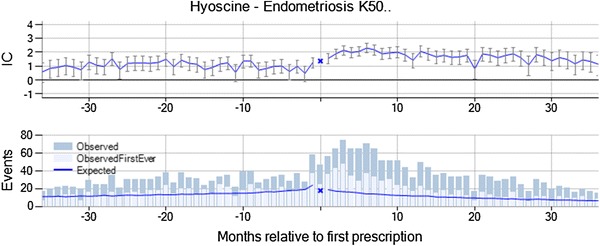
Endometriosis is temporally associated with new prescriptions of hyoscine, but was dismissed from further evaluation on account of suspected protopathic bias. IC information component
Open-Angle Glaucoma with Dithranol
Open-angle glaucoma with dithranol indicated for topical treatment of psoriasis was highlighted by vigiTrace on the basis of four observed events in 31–180 days after initiation of treatment versus 0.3 expected (IC∆ = 2.48, IC∆025 = 0.75). The chronograph is based on limited data, but there is only one patient with open-angle glaucoma in the 3 years before new dithranol prescriptions (see Fig. 7). Open-angle glaucoma is neither an indication nor a contraindication for dithranol, and the assessor noted that there is no apparent association with the underlying disease. There was not enough data to assess any subgroup. For two of the four patients, the prescription of dithranol was not renewed after the open-angle glaucoma and the duration of treatment was similar to that for dithranol in general. The open-angle glaucoma was diagnosed well after the end of estimated treatment with dithranol for all four patients. From the summary statistics, the assessor identified no concomitant medicines known to cause open-angle glaucoma, but three out of four patients had registrations of borderline glaucoma prior to the dithranol prescription. The combination was dismissed from further analysis by the assessor since the glaucoma appeared to have been present before the prescription of dithranol in a majority of the patients.
Fig. 7.
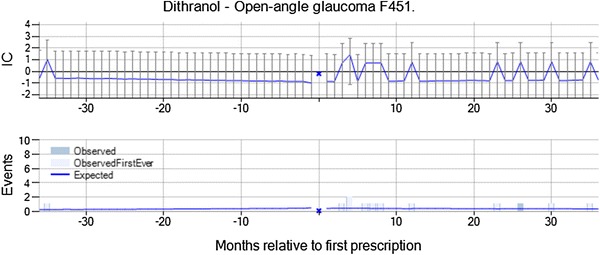
Open-angle glaucoma is temporally associated with new prescriptions of dithranol, but was dismissed from further evaluation since three of four patients had similar events recorded prior to initiation of dithranol treatment. IC information component
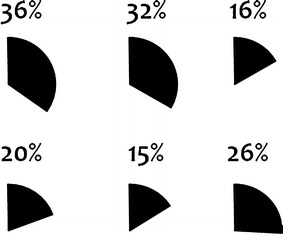
Inter-assessor Variability
Figures 8 and 9 show the proportion of drug–event pairs classified as ‘Labeled’ and ‘Merits further evaluation’ by each assessor. Whereas the proportions of drug–event pairs classified as labeled are similar, there is substantial variability between assessors with respect to the proportion of combinations that were classified as meriting further evaluation; these proportions range from 5 to 47 % (Fig. 9). While these figures are not directly comparable on account of different assessors evaluating different drug–event pairs, a similar tendency was observed for the replicated assessments. However, for this part of the study the numbers were too small to allow for a reliable interpretation.
Fig. 8.
Proportion of relevant drug–event pairs classified as ‘Labeled.’ Each pie chart represents one of the six assessors
Fig. 9.
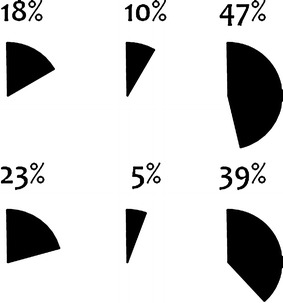
Proportion of relevant and unlabeled drug–event pairs classified as ‘Merits further evaluation.’ Each pie chart represents one of the six assessors
Discussion
Exploratory analysis of electronic medical records can identify potential safety signals of importance. In our study, it brought to light 91 pairs of temporally associated drugs and medical events, meriting further evaluation according to initial epidemiological review. These medical events range from life-threatening, such as multiple organ failure, to those that are less serious but important for patients and for adherence, such as epiphora. Some of these may be difficult to capture through the current pharmacovigilance system that relies on patients and health professionals to identify individual cases of suspected ADRs and report them. An adverse event such as epiphora might be considered related to aging rather than to exposure to a drug, especially if the onset is insidious and occurs after several months of treatment.
One in four reviewed temporal associations correspond to established ADRs, and this reinforces earlier results that have found the self-controlled cohort analysis to have adequate predictive ability for known ADRs [8, 9, 16, 17]. At the same time, three out of four temporal associations for previously unknown ADRs were dismissed from further evaluation after initial review, which underlines the importance of bringing statistical signal detection for longitudinal health data into a comprehensive triage process that also involves clinical and epidemiological review. In this context, statistical graphical methods such as the chronograph provide valuable broader perspectives on observed temporal associations. Univariate measures of association alone, on the other hand, risk over-simplifying or obscuring the relevant relationships. It is encouraging that many false positives associated with pre-existing conditions or the underlying disease were in fact detected and eliminated in the review. These would be important aspects to consider in evaluating potential signals in electronic medical records.
The design of our study did not permit evaluation of false negatives, i.e., true ADRs not detected by the initial screening or erroneously dismissed in the subsequent review. Earlier research has shown that vigiTrace’s self-controlled cohort analysis is relatively conservative [8], which may derive from the requirement that the observed-to-expected ratio in the surveillance period exceed not only that immediately prior to new prescriptions but also long before and on the day of prescription. An additional source of false negatives here is that long-latency ADRs would be missed, since the surveillance periods did not extend beyond 6 months. False negatives may also result from the reliance on individual event terms and the risk that a signal is diluted by variations in coding. A source of false negatives shared with other self-controlled designs relates to exposure misclassification whereby events might be erroneously counted in a control period instead of in a surveillance period [20]. Related to this, adverse reactions to first-line treatment may mask the same ADR for a second-line treatment.
In the context of the study, the clinical and epidemiological review followed a fairly strict protocol. One purpose for doing so was to reduce inter-assessor variability, but this appears to have been only partly successful. In particular, there seem to be systematic differences between assessors in their response to absence of evidence, when they could not reliably judge whether exposure to the drug or a possible alternative cause was the most likely explanation for the increased rate of the medical event. Under such circumstances, some assessors tended to mark the combinations for further evaluation whereas others tended to dismiss them. In addition, there were examples where combinations were dismissed by the assessor on account of confounding by, e.g., age or the underlying disease, without a motivation for why the rate of the medical event would be increased immediately after but not before the initiation of treatment. These are areas where the instructions for the structured assessment should have been clearer. It should also be noted that for the purpose of the study, each assessor performed their review alone, whereas in the real world, a more plausible scenario would be that multi-disciplinary teams carry out the evaluation together. Clearly, causality assessment for longitudinal observational data is a challenging task, and one that requires a broad range of expertise, more so, perhaps, than the analysis of individual case reports. We would propose that effective review of findings from exploratory analysis of longitudinal health data require clinical and epidemiological perspectives, but also a deep understanding of the analytical methods employed, and insight into data collection and medical practice in the setting of interest. The latter will be a challenge for the analysis of data from the emerging database networks, which hold great promise of improved statistical power but which pool data (or analyses) from many different settings.
Lack of concordance between assessors has been observed for pharmacovigilance causality assessment in general [21]. Even so, the observed variability between assessors in our study does raise concerns. To some extent, it may derive from the different training and experience of the assessors, and one might anticipate that the multiple perspectives of different professionals would improve the quality of assessments produced by a multidisciplinary team, and thereby their concordance. At the same time, there is substantial uncertainty surrounding many decisions made in pharmacovigilance, also as a broader community, and we should acknowledge that uncertainty may be inherent to the context of these decisions, and not possible to completely eliminate.
Our study was restricted to drugs with substantial exposure in THIN, and the scope of the structured assessment was adapted to the available data. As such, some of our findings may not apply to exploratory analysis of longitudinal health data in general. An insurance claims database would typically cover more patients and include data from secondary and tertiary care, but on the other hand, would suffer biases related to reimbursement rules and greater loss to follow-up. Consequently, the proportions of drug–event pairs classified as known adverse reactions, meriting further evaluation, and dismissed may therefore differ from those reported here.
Similarly, the sources of false positives and the associated considerations in the questionnaire depend intricately on the analysis strategy for initial screening, which in our case is self-controlled. Consequently, these aspects may generalize fairly well to other self-controlled designs, but should not be expected to hold for active comparator designs. As an example, active comparator designs would not be as sensitive as the self-controlled designs to protopathic biases and contraindications, to the extent that these are shared between a drug and an active comparator matched on indication for treatment. On the other hand, they would arguably be more sensitive to residual confounding from imperfect adjustment for time-constant systematic differences between the exposed and active comparator groups.
Still, it seems plausible that other methods and data sets, too, would generate substantial proportions of false positives, unless statistical associations are subjected to manual review. vigiTrace’s self-controlled cohort analysis has exhibited high positive predictive value for known ADRs compared with other screening methods for ADR surveillance [8, 9, 17], and the false positives in our study were largely due to systematic variability common in observational data rather than to irregularities specific to THIN.
It should be noted that the questionnaire and empirical evaluation considered here cover some but not all the aspects that would be relevant for a full assessment of potential safety signals from longitudinal electronic health data. They focus on the in-depth exploration of the temporal patterns, the demographics and the past medical history. All analyses were performed at the level of the cohort and were restricted to the data set at hand. In contrast, a comprehensive process would include review of individual patient histories and consultation of complementary information sources such as collections of individual case reports or the scientific literature. It would also explore other longitudinal health data and consider the temporal patterns for similar drugs and medical events in the same database. These aspects were out of the scope of this study and represent important areas for future research and evaluation. Ideally, their consideration would further improve a comprehensive process for safety signal detection in longitudinal health data.
Conclusions
Exploratory analysis of electronic medical records can detect important potential safety signals, in a prospective setting. However, to achieve an acceptable false positive rate, statistical signal detection should be combined with clinical and epidemiological review. This review requires a deep understanding of the analytical methods employed, and insight into data collection and medical practice in the setting at hand.
Acknowledgments
The authors would like to thank Ralph Edwards for helpful advice, and Bharat Thakrar, Susan Andersson, Montse Soriano-Gabarró, Mary Thompson for contributions to the early phases of the study.
The research leading to these results was conducted as part of the PROTECT consortium (Pharmacoepidemiological Research on Outcomes of Therapeutics by a European ConsorTium, www.imi-protect.eu), which is a public–private partnership coordinated by the European Medicines Agency. The PROTECT project has received support from the Innovative Medicines Initiative Joint Undertaking (http://www.imi.europa.eu) under Grant Agreement no. 115004, resources of which are composed of financial contributions from the European Union’s Seventh Framework Programme (FP7/2007–2013) and EFPIA companies’ in kind contribution. The views expressed are those of the authors only.
Conflicts of interest
Susanna Cederholm is a former employee of the Uppsala Monitoring Centre, and Geraldine Hill, Tomas Bergvall, Kristina Star, and G. Niklas Norén are employees of the Uppsala Monitoring Centre, which has developed and implemented the vigiTrace™ framework and may make it available as a commercial offering and/or as open source. Susanna Cederholm was previously employed by AstraZeneca. Alex Asiimwe is currently employed by Bayer Pharma, and holds stock options in Bayer Pharma and stock in Eli Lilly; he has also worked for AstraZeneca and Eli Lilly during the course of the project. Andrew Bate is a full-time employee and shareholder of Pfizer. Fatima Bhayat is employed by Takeda Development Centre, Europe; she has also worked for AstraZeneca during the course of the project. Gunnar Brobert is an employee of Bayer Pharma and was previously employed by AstraZeneca. David Ansell is employed by CSD MR UK, who own the THIN database utilized in this analysis.
Footnotes
IC = Information Component.
The original scope of the analysis included 49 drugs for seven assessors, out of which seven would have been replicated by a second assessor. However, one assessor was unable to complete the study, and therefore 42 drugs were included in the study, and there were five replicated assessments to analyze inter-assessor variability.
References
- 1.Norén GN, Hopstadius J, Bate A, Star K, Edwards IR. Temporal pattern discovery in longitudinal electronic patient records. Data Min Knowl Dis. 2010;20(3):361–387. doi: 10.1007/s10618-009-0152-3. [DOI] [Google Scholar]
- 2.Stang PE, Ryan PB, Racoosin JA, Overhage JM, Hartzema AG, Reich C, et al. Advancing the science for active surveillance: rationale and design for the observational medical outcomes partnership. Ann Inter Med. 2010;153(9):600–606. doi: 10.7326/0003-4819-153-9-201011020-00010. [DOI] [PubMed] [Google Scholar]
- 3.Woodcock J, Behrman RE, Dal Pan GJ. Role of postmarketing surveillance in contemporary medicine. Annu Rev Med. 2011;62:1–10. doi: 10.1146/annurev-med-060309-164311. [DOI] [PubMed] [Google Scholar]
- 4.Coloma PM, Schuemie MJ, Trifirò G, Gini R, Herings R, Hippisley-Cox J, et al. Combining electronic healthcare databases in Europe to allow for large-scale drug safety monitoring: the EU-ADR Project. Pharmacoepidemiol Drug Saf. 2011;20(1):1–11. doi: 10.1002/pds.2053. [DOI] [PubMed] [Google Scholar]
- 5.Brown JS, Kulldorff M, Chan KA, Davis RL, Graham D, Pettus PT, et al. Early detection of adverse drug events within population-based health networks: application of sequential testing methods. Pharmacoepidemiol Drug Saf. 2007;16(12):1275–1284. doi: 10.1002/pds.1509. [DOI] [PubMed] [Google Scholar]
- 6.Jick H. The discovery of drug-induced illness. N Eng J Med. 1977;296:481–485. doi: 10.1056/NEJM197703032960904. [DOI] [PubMed] [Google Scholar]
- 7.Coloma PM, Avillach P, Salvo F, Schuemie MJ, Ferrajolo C, Pariente A, et al. A reference standard for evaluation of methods for drug safety signal detection using electronic healthcare record databases. Drug Saf. 2013;36(1):13–23. doi: 10.1007/s40264-012-0002-x. [DOI] [PubMed] [Google Scholar]
- 8.Ryan PB, Madigan D, Stang PE, MarcOverhage J, Racoosin JA, Hartzema AG. Empirical assessment of methods for risk identification in healthcare data: results from the experiments of the Observational Medical Outcomes Partnership. Stat Med. 2012;31(30):4401–4415. doi: 10.1002/sim.5620. [DOI] [PubMed] [Google Scholar]
- 9.Ryan PB, Stang PE, Overhage JM, Suchard MA, Hartzema AG, DuMouchel W, et al. A Comparison of the empirical performance of methods for a risk identification system. Drug Saf. 2013;36(S1):143–158. doi: 10.1007/s40264-013-0108-9. [DOI] [PubMed] [Google Scholar]
- 10.Harpaz R, Vilar S, DuMouchel W, Salmasian H, Haerian K, Shah NH, et al. Combing signals from spontaneous reports and electronic health records for detection of adverse drug reactions. J Am Med Inform Assoc. 2013;20(3):413–419. doi: 10.1136/amiajnl-2012-000930. [DOI] [PMC free article] [PubMed] [Google Scholar]
- 11.Yih WK, Kulldorff M, Fireman BH, Shui IM, Lewis EM, Klein NP, et al. Active surveillance for adverse events: the experience of the Vaccine Safety Datalink Project. Pediatrics. 2011;127(Supplement 1):S54–S64. doi: 10.1542/peds.2010-1722I. [DOI] [PubMed] [Google Scholar]
- 12.Blak BT, Thompson M, Dattani H, Bourke A. Generalisability of The Health Improvement Network (THIN) database: demographics, chronic disease prevalence and mortality rates. Inform Primary Care. 2011;19(4):251–255. doi: 10.14236/jhi.v19i4.820. [DOI] [PubMed] [Google Scholar]
- 13.Blak BT, Thompson M. How does The Health Improvement Network (THIN) data on prevalences on chronic diseases compare with national figures? Value Health. 2009;12(7):A253. doi: 10.1016/S1098-3015(10)74240-6. [DOI] [Google Scholar]
- 14.Lindquist M. Vigibase, the WHO Global ICSR Database System: basic facts. Drug Inf J. 2008;42(5):409–419. [Google Scholar]
- 15.Trifiro G, Pariente A, Coloma PM, Kors JA, Polimeni G, Miremont-Salame G, et al. Data mining on electronic health record databases for signal detection in pharmacovigilance: which events to monitor? Pharmacoepidemiol Drug Saf. 2009;18(12):1176–1184. doi: 10.1002/pds.1836. [DOI] [PubMed] [Google Scholar]
- 16.Norén GN, Bergvall T, Ryan PB, Juhlin K, Schuemie MJ, Madigan D. Empirical performance of the calibrated self-controlled cohort analysis within temporal pattern discovery: lessons for developing a risk identification and analysis system. Drug Saf. 2013;36(1):107–121. doi: 10.1007/s40264-013-0095-x. [DOI] [PubMed] [Google Scholar]
- 17.Norén GN, Hopstadius J, Bate A, Edwards IR. Safety surveillance of longitudinal databases: results on real-world data. Pharmacoepidemiol Drug Saf. 2012;21(6):673–675. doi: 10.1002/pds.3258. [DOI] [Google Scholar]
- 18.Hallas J. Evidence of depression provoked by cardiovascular medication: a prescription sequence symmetry analysis. Epidemiology. 1996;7:5. doi: 10.1097/00001648-199609000-00004. [DOI] [PubMed] [Google Scholar]
- 19.Juhlin K, Ye X, Star K, Norén GN. Outlier removal to uncover patterns in adverse drug reaction surveillance—a simple unmasking strategy. Pharmacoepidemiol Drug Saf. 2013;22(10):1119–1129. doi: 10.1002/pds.3474. [DOI] [PubMed] [Google Scholar]
- 20.Gagne JJ, Fireman B, Ryan PB, Maclure M, Gerhard T, Toh S, et al. Design considerations in an active medical product safety monitoring system. Pharmacoepidemiol Drug Saf. 2012;21(Suppl 1):32–40. doi: 10.1002/pds.2316. [DOI] [PubMed] [Google Scholar]
- 21.Meyboom RH, Hekster YA, Egberts AC, Gribnau FW, Edwards IR. Causal or casual? The role of causality assessment in pharmacovigilance. Drug Saf. 1997;17(6):374–389. doi: 10.2165/00002018-199717060-00004. [DOI] [PubMed] [Google Scholar]