Abstract
4-D-computed tomography (4DCT) provides not only a new dimension of patient-specific information for radiation therapy planning and treatment, but also a challenging scale of data volume to process and analyze. Manual analysis using existing 3-D tools is unable to keep up with vastly increased 4-D data volume, automated processing and analysis are thus needed to process 4DCT data effectively and efficiently. In this paper, we applied ideas and algorithms from image/signal processing, computer vision, and machine learning to 4DCT lung data so that lungs can be reliably segmented in a fully automated manner, lung features can be visualized and measured on the fly via user interactions, and data quality classifications can be computed in a robust manner. Comparisons of our results with an established treatment planning system and calculation by experts demonstrated negligible discrepancies (within ±2%) for volume assessment but one to two orders of magnitude performance enhancement. An empirical Fourier-analysis-based quality measure-delivered performances closely emulating human experts. Three machine learners are inspected to justify the viability of machine learning techniques used to robustly identify data quality of 4DCT images in the scalable manner. The resultant system provides a toolkit that speeds up 4-D tasks in the clinic and facilitates clinical research to improve current clinical practice.
Keywords: Biomedical image processing, image analysis, classification algorithms, morphological operations, machine learning algorithms, data visualization, computed tomography
4-dimensional computed tomography (4DCT) provides not only a new dimension of patient-specific information for radiation therapy planning and treatment but also a challenging scale of data volume to process and analyze. Manual analysis using existing 3D tools is unable to keep up with vastly increased 4D data volume. This work applied ideas and algorithms from image/signal processing, computer vision and machine learning to 4DCT lung data so that lungs can be reliably segmented in a fully automated manner, lung features can be visualized and measured on-the-fly via user interactions, and data quality classifications can be computed in a robust manner.
I. Introduction
In radiation treatment planning, 4-dimensional computed tomography (4DCT) images—a stack of 3DCT images along the temporal dimension—provide not only a new dimension of patient-specific information for radiation therapy planning and treatment but also a challenging scale of data volume to process and analyze. Clinically 4DCT is useful to delineate the internal tumor volume (ITV), which is the tumor motion envelope or union of all gross tumor volumes within the breathing cycle, as the treatment target. Although 4DCT is very informative in both spatial and temporal scales, it has been under-utilized clinically, mostly because of the high demand of manual involvement with limited automatic tools. Processing and analysis on 4DCT images are innately challenging: 1) big data volume: a single set of 4DCT images, typically consisting of ten phases and each phase having about 150 Dicom slices where each pixel is represented by 16 bits, accounts for close to one gigabyte; 2) rampant motion artifacts: 4DCT images are known for high rate of motion artifacts. The retrospective reconstruction of 4DCT images with binning of projection images into different respiratory phases assumes a periodic respiration. However, human beings, especially lung patients, do not breathe like a ventilator, but vary from breath to breath. The breathing irregularities and heart beating at a different frequency render images distorted, blurring and noisy. The nature of 4DCT images makes manual 4D analysis and measurements extremely time-consuming, error-prone and thus impractical.
Thoracic 3DCT image segmentation has been established and applied in every radiotherapy treatment planning system. Most systems require a point seed or region of interest defined by a user, although implicit anatomic knowledge can be used [1]. Manual segmentation is always available to modify the result of a semi-automatic segmentation. The dependence on user initial input limits automatic image segmentation. From 3D to 4D CT, the increase in the number of image makes 4D planning cumbersome. Deformable image registration (DIR) can be applied to map the segmented organs from a reference CT to other phase CTs [2]–[4]. Usually, DIR is performed within a pair of images, so this has to repeat nine times for ten-phase 4DCT and results have to be visually checked.
To better visualize, measure and analyze the static and dynamic signatures of 4DCT lung images, state-of-the-art techniques from signal/image/video processing, computer vision, data mining and machine learning should apply. In the past decade immense progress have been made in these topics, such as the celebrated Viola-Jones’ cascade real-time face recognition [5] used in almost all current digital cameras, “GrabCut” [6] is universally available in all digital photography software systems, and image in-painting approaches [7] which has found a broad spectrum of utilities [8]. Some algorithm ideas similar to these cutting-edge approaches find their use in our current work. In our recent researches, we have invented and applied algorithms for visual object classification [9], lung tumor detection and tracking [10], and fast-moving object detection in Infra-Red sequences [11].
To make possible ensuing visualizations, measurements and classification, by using image processing techniques such as anisotropic smoothing, adaptive thresholding and mathematical morphological processing, we develop a procedure to automatically segment out lung region from each phase without any human interactions or interventions. This establishes the basis for further visualization and measurement of the 4D respiratory process.
Based on the segmented lungs several measures are developed to determine the quality of 4DCT images, aiming to filter out low quality 4DCT images from clinical studies or identify poor breathers as candidates of breath coaching for improvement. In the presence of random and systematic noises and especially motion artifacts, the poor quality of many 4DCT images renders them inappropriate for rigorous retrospective studies. Motion artifacts in 4DCT images impose a serious problem in tumor and anatomy delineation, causing a systematic error in radiotherapy treatment planning. The irregularity of respiration-induced organ motion is the direct cause for motion artifacts in 4DCT [12]. Gross tumor volume (GTV) delineated from different phase CT within a 4DCT image set can cause GTV to vary up to 90%−110%, primarily due to motion artifacts [13], [14]. Therefore, with appropriate margins to account for tumor microscopic extension and patient setup uncertainty, the radiation treatment plan based on the delineated GTV varies accordingly, causing potential marginal miss of the tumor or overdose to the surrounding normal tissue. Persson et al. [13] reported that the delineated peripheral lung tumor volumes (1 to 35  from 19 4DCT images varied as much as about 90%, primarily due to motion artifacts. Li et al. [14] reported a GTV variation in small peripheral lung tumors (<5
  up to 110%. Great efforts have been made to quantify and reduce motion artifacts in planning CT image [15], [16], so that patient anatomy will be authentically represented in radiation dose calculation.
To quantify motion artifacts, a straightforward mobile phantom study, with known shape and volume of an object and controllable motion speed and range, provides the ground truth comparing the imaging result with physical measurements [15]. In patients, however, GTV quantification is difficult since the actual tumor shape and volume cannot be directly measured as the ground truth [16]. As an alternative, frequency and amplitude of motion artifacts appearing in 4DCT can be manually evaluated by scrolling through all 4DCT images [16]. This is a tedious and time consuming process with an outcome difficult to compare among patients. Moreover, manual evaluations depend upon observers’ experience and interpretation of various motion artifacts; inter-observer variations would likely occur, making the conclusion subjective and thus unreliable and irreproducible. Automatic evaluations are therefore necessitated.
To extract useful motion information, a high-quality 4DCT images should be used to reliably extract and analyze signals rather than chasing after noises. Images with smaller amount of noises and less serious motion artifacts should be given higher priority in the ensuing careful and painstaking analysis. Choices made by eyeballing and manual measurements are unlikely sustainable. An automatic scanning is the only viable and scalable way to filter out 4DCT images that are unfit for the follow-up intensive studies. Clinically, it is necessary to build a quantitative tool to assess and monitor 4DCT image quality. Such a tool will be useful to evaluate if a new clinical imaging protocol or methodology can in fact result in better performances, whereof the quality of the resultant 4DCT images serves as a valuable proxy of the performance of new approaches.
To address the preceding needs, based on the segmented lung, a quality measure must be developed to reflect the noisy levels, motion artifacts and imaging qualities, to extend clinical use of the 4DCT images, and to betoken the efficacy of new protocols and methodologies. Several quality measures are developed to this end: one is a quality index based on Fourier analysis, the other is a set of methods based on machine learning techniques.
This paper is organized as below. Section II expanded on the technical details of the automatic segmentation, quality measurements and classification algorithms for 4DCT images. To illustrate the performances of the proposed algorithms, Section III presents the experimental results over real patient data. We conclude in Section IV with more remarks and discussions about the new algorithms and work to be done in the near future.
II. Automatic Segmentation, Measurements and Classification of 4DCT Lung Images
A. Automatic Lung Segmentation
The region associated with the lung was first segmented out from a 3DCT image, one phase of 4DCT images. To avoid commonly required initial seeds in segmentation, we designed an automatic procedure—without the need of any user interactions or interventions—which is the only viable and scalable way to handle the immense data volume induced by 4DCT images.
1). Pre-Processing Step: Image DE-Noising Based on Partial Differential Equation (PDE)
The first step in any visual object detection procedure is image cleaning or de-noising with Gaussian smoothing [17], [18]. Mathematically Gaussian smoothing,  being the convolution operator, is the solution to the following PDE of diffusion type:
 |
where  is the Laplacian operator. The random noise due to central limit theorem can be effectively removed. To clean images without unduly diffusing strong edge and object boundaries, a de-noising step other than conventional Gaussian smoothing is needed. The anisotropic smoothing can achieve exactly what we need. This approach was first introduced by Perona and Malik [18] with some recent new developments, e.g., [19]. The gist of all anisotropic diffusion is that: The smoothing operations along the normal direction of edges and visual object boundaries should be suppressed. The corresponding controlling PDE is given below:
 |
where div is the divergence operator,  is the gradient of 3DCT image I,
  is a decreasing function, a typical choice is defined in the following form:
 |
K is a controlling constant to decide the magnitude of smoothing. Due to Eq. (3) for locations of weak high frequency energies, namely, small  ,
,  approximates value 1, and Eq. (2) is roughly equivalent to Eq. (1), an actual Gaussian diffusion. Whereas for regions with significant
  the smoothing operations along the normal direction
  is close to 0 and thus being suppressed effectively. Therefore the valuable lung boundaries and textures are preserved as random noises are mitigated. In our lung segmentation algorithm, the pre-processing step is to use anisotropic diffusion for noise removal purposes. Considerably fewer errors are committed after this de-noising pre-processing step.
2). Adaptive Thresholding for 3DCT Image Binarization
To facilitate automatic lung region segmentation, the “gray-scale” (two bytes per voxel) of 3DCT images are converted to binary or logical ones so that the rich arsenal of mathematical morphological operations, the valuable suite to analyze geometrical and topological features for viable features and objects [20], can apply. The most widely used method for this transformation is Otsu’s threshold method. This method however is global: a single threshold is determined that causes the minimal combined variances  for the bi-modal gray-scale histogram [21], defined as below:
 |
where  and
and  ) are the percentages of voxels whose intensity values are smaller and larger than threshold t, respectively; while
  and
and  are the corresponding two variances determined by t. The assumption behind the workings of this method is that both the foreground and background regions are compact and well distinguishable. In 3DCT images, however, it is impossible to assure this compactness in the presence of rampant systematic and random noises. The adaptive thresholding approach makes a more humble assumption in determining the threshold: the illumination due to CT imaging instrument is assumed to be constant only in a small 3-D window where the Otsu’s method is applied. A voxel is labeled as foreground or background only if it is so denoted according to the local 3-D window it is situated. The resultant binary 3D image produced by the adaptive version of thresholding procedure serves as the foundation for our upcoming morphological operations. The resulting binary 3D matrix is denoted by B.
3). Lung Region Segmentation Using Morphological Operations
To separate the lung and the outside region, from the logical 3D matrix B produced in Subsection A.2, the segmentation procedure skips the top several axial slices until reaching the slice where the foreground regions were cut into 2 or 3 separate connected components with non-ignorable size due to trachea and one or both of the two lung apexes, which is reached by applying the 2D component labeling algorithm using 8-neighborhood system on 2D slices [8]. This way the foreground region due to the lung is effectively separated from the outside regions. To avoid false positives caused by CT imaging instruments (such as those significant horizontal and vertical stripes caused by clinical tubing and beddings which may also form a closed foreground regions), a Hough-transform-based line searching algorithm [8] applies to identify and delete them. Instead of resorting to human interactions to place the seeds of lung regions, this morphological-operation-based step effectively separates the lung region from outer regions, both having the same foreground (with value 1) voxel values in B. The resultant reduced logical matrix is denoted by B’.
Afterwards a 3D component labeling algorithm [17] partitions all foreground regions in B’ into connected components based on 3D 18-neighborhood system over the 3DCT data. The components were sorted according to their sizes in descending order. The largest component was deemed the outside region and thus discarded. While the components rank  or higher were too small to be relevant to the lung. The ratio of the 2
 and the 3
 component determines if the left and right lungs (ratio
  ) are well-separated. In the system, after testing a great array of known lung regions offline, the threshold
  used to decide if these two components are close is set at 0.3, that is, if the ratio of the size of the
  largest foreground component over that of the
  largest foreground component is larger than 0.3, the lung consists of both components. Otherwise, the
  component alone accounts for both the left and right lungs, and the
  component is discarded. In most cases the two lungs are connected.
In Fig. 1, the boxplot of the ratios of the  and
and  components for 40 3DCT lung data are illustrated: Group 1 corresponds to the case when the
  component should be discarded, where the median and largest ratios are 0.02 and 0.09, respectively. Whereas Group 2 indicates the case when the
  component is the other half of lung, the median and largest ratios in this group are 0.71 and 0.44, respectively. The threshold
  (0.3) shown as the horizontal line hence separates these two groups with adequate margin, which aligns with the experience of medical physicist well.
Figure 1.
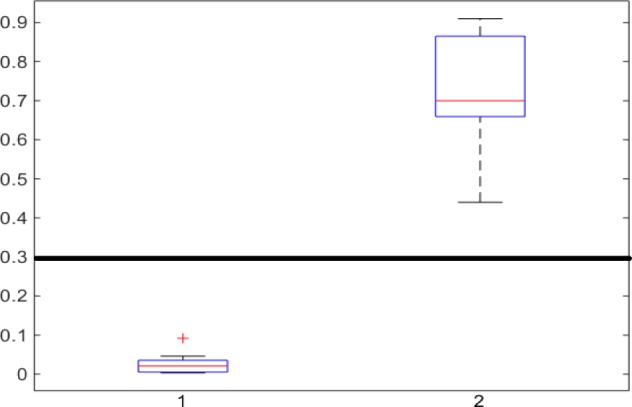
Ratios of 1 lung region over the largest non-lung region (Group 1) and 2 lung regions (Group 2).
Because some air bubbles may exist next to the lung in the stomach that can connect the lung regions, an image opening using a 3D ball of radius 5 voxels is performed to eliminate possible bubbles and thus separating authentic lung from belly regions that was falsely connected by air bubbles. Thereafter a second application of the same 3D component labeling is conducted. The largest connected component in the upper part is claimed to be the lung. Image closing and opening operators using a small ball of radius 3 voxels next cleanse possible noises and thus finalizing the lung region.
The resulting binary 3D lung mask is denoted by a binary matrix M. In the ensuing computation it is of interest to separate the left lung from the right lung when they are connected in M. This separation is approximated by searching for the sagittal cut planes of the lung around the center with the smallest possible lung area, the corresponding two lungs are denoted by  and
and  , respectively [22].
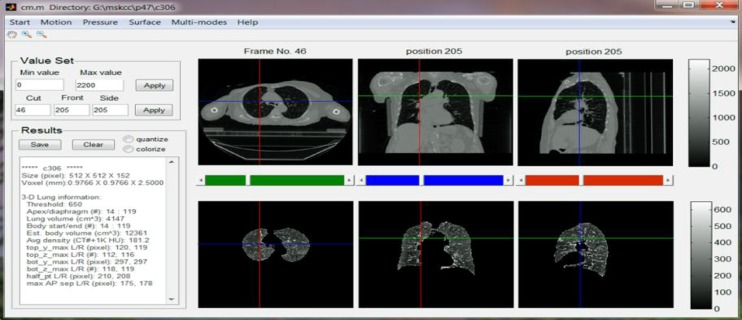
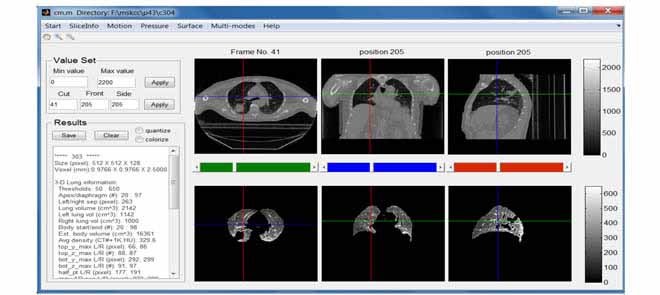
Based on M, one can compute the numerical and geometrical information for the lung just segmented such as the volume, the apex (the most superior point of the lung) and the diaphragm (the inferior border of the lung), the corresponding body volume around lung region in-between the apex and diaphragm, average density, and other related physiological, geometric and topological features. Visualization of 3D/4D anatomy provides the necessary tool to verify automatic results. Each of the extracted parameters can be visually verified in a graphics user interface (GUI) as shown in Fig. 2. The automatic segmentation of the lung and visualization controlled by user interactions make exploratory studies possible, which lays a solid foundation for future clinical research on radiotherapy planning and treatment.
Figure 2.
Main GUI of the MATLAB based system. Text input/output are on the left and graphical display of the CT (top) and segmented lung (bottom) are on the right in axial, coronal and sagittal views.
In a previous automatic lung segmentation method [23], the regions other than the lung region is assumed to be already excluded. However, in most protocols, the field of view (FOV) for CT images is fixed, thus the FOV covers not only the human subject, but additional regions outside of the human body, including the bed region. Selecting the largest two regions without handling these system noise, as done in [23], will cause mis-classification. Special care, i.e., the Hough-transform-based step, is taken by our segmentation algorithm so that the fully automatic processing, without any human interventions, can be effected. The dynamic programming (DP) procedure was used in [23] to separate the left and right lungs by searching for the optimal. From our prior work and observations [11], [24] DP-based partitions are too sensitive to noises rampant in CT images, our simple approach of finding the vertical plane with smallest lung areas to partition the two lungs yields more acceptable segmentations.
B. 4DCT Image Quality Measure
In response to the needs to identify 4DCT qualities as described in Section I, we developed two different approaches to automatically analyze 4DCT images and produce numeric indicators measuring their quality in batch mode: one applies Fourier analysis, a widely used signal processing technique [25], to assign a probability value corresponding to the goodness of the image quality; the other applies three supervised learning methods from machine learning [26], namely, Naïve Bayes, Support vector machine, and Random forests, to classify 4DCT data into either good or bad based on known training data.
1). Fourier-Analysis-Based Quality Measure
It is a norm in signal processing communities that in order to gain deeper insights into the signals in hand one always studies them in the spectral (frequency) domain, i.e., conduct investigations over the Fourier coefficients [25]. In 2D signal and image processing, the discrete cosine transform (DCT), the actual Fourier transform of even functions where all sine functions are nullified, is more appropriate since by reflecting 2D signals across their boundaries fewer artificial discontinuities will be induced thus resulting in more concise Fourier descriptors [27]. In this work, the discrete cosine transform (DCT), the discrete Fourier transform of even functions, is used instead of the original discrete Fourier transform.
The main reason behind the popularity of DCT lies in the optimality of DCT basis: the basis subtended by DCT is extremely similar to the basis image dictionaries adaptively and actively learned from big datasets [27]. Our intensive studies on 4DCT data representation and indexing confirmed the representational power of DCT: after trying a wide array of image/video analysis methods, global Fourier analysis turns out to be the best method giving rise to the best representational prowess that we can find so far. Preliminary results of this section were reported in [28].
Each phase of the original 4DCT data, an actual 3DCT image, is first filtered by the logical lung mask M, as described in Subsection II.A, that is, only the intensity values inside lung will be considered by the ensuing indexing procedure. The resulting lung data is denoted by  . The 3-dimensional DCT is then performed on
  to yield 3D matrix
  :
:
 |
where DCT3 operator first conducts 2D DCT over every slice of  , then a 1D DCT is performed for the 2D DCT coefficients of the same frequency, an actual 1D data sequences along the vertical direction.
We hypothesized that for quality measuring purposes some frequencies played a more important role than others: regions of the lowest frequencies reflect the global shape and layout of the lung, which carries little information about noises or motion artifacts; and regions of considerably higher frequencies reflect exceedingly busy local noise-like changes, which is of relatively little interest in our global quality indexing efforts. Consequently, to categorically indicate the global quality of 4DCT data we should focus on those spectral bands in the middle. A band-passing analysis in signal processing [25] is a potential solution.
To substantiate our hypothesis, for ease of analysis, we first transfer the 3D spectral space D from Eq. (5) (as usual the DC coefficient D(1,1,1) is set to 0 and afterwards D is L2 normalized, that is, the sum of the energy of D is normalized to one.) as defined in Eq. (6) to a 1-dimensional array:
 |
According Eq. (6), E(k) essentially summarizes the energies of the DCT coefficients where exactly one of the three frequency indexes is k. Our preceding logical reasoning suggests that our quality measure should focus on E(k) for k neither too large nor too small. From 4DCT image data with known quality designations after intensive exploratory data analysis, feature selections [29] and k-fold cross validation [30] we found that only E(k)’s for k between 5 through 8 are related. More concretely, for 3DCT’s of known good quality (according to medical experts’ judgments by inspecting the CT data from their prior training and experience, which may take several minutes or longer, depending on the specific nature of each CT data), the magnitudes of E(k) for k between 5 to 8 only change mildly since they represent rich textures inside lung, the busy macro-level 3D textures caused by bronchial trees dictates milder changes at these spectral regions. Conversely, for 3DCT’s of bad qualities, due to motion artifacts and systematic noises during imaging process, E(k)’s for k  and 6 are considerably larger than those for k
  , 8, these inflated coefficients at k
  and 6 cannot be caused by global shape due to the relative higher frequencies represented by these indexes k’s, and they cannot be explained by pure random noise since random noises are unable to increase E(k), k
  and 6, as E is normalized. Fig. 3 depicts the median values and standard deviations for E(k) as error bars with k
  to 10 for randomly chosen 30 good and 30 bad quality 4DCTs.
Figure 3.
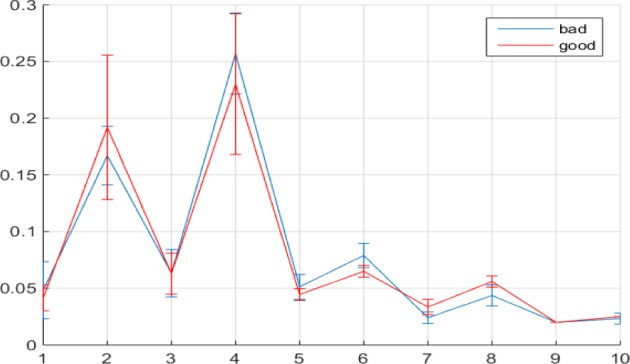
Median values of E(k) with error bars for k  to 10 for 30 good and bad quality 4DCT data.
The statistical properties of E(k)’s for good and bad quality 4DCT data demonstrated in Fig. 3 align well with the foregoing reasoning: The values for E(k) when k  to 4 and 9 and 10 cannot be clearly distinguished between different quality designations due to the almost entirely overlapping error bars at those points. E(k) values for k
  , 6 for bad 4DCT data are larger than those of good ones with only minimal error bar overlapping; while the E(k)’s for k
  , 8 for good 4DCTs are significantly larger than those for bad quality ones.
Consequently, we can designate the ratio of the sum of E(k), k  , 8 over that of E(k), k
  , 6 as the motion artifacts index for a 4DCT, i.e.,
 |
A considerably small index R thus signifies inflated energy at E(5)+E(6), suggesting the poor imaging quality and the presence of motion artifacts. 4DCT quality classification based on this numeric measure performs well, as presented in Section III.
2). Machine Learning Data Classification
In the preceding section, through exploratory studies and trials and errors the quality indicator R was developed by Eq. (7), whose benefit is its explanation power: based on the meaning of energy function E as defined in Eq. (6), the systematic noises and motion artifacts demonstrate different behavioral properties in E(k)’s from 5 to 8, consequently  is a plausible index about this impact as a proxy for the presence of system noises and motion artifacts. However, in the presence of more available data that defies careful investigations, more scalable approaches should be employed. Machine learning methods, the workhorse behind many of the successful applications of computers, serve us better in this regard. With data labeled by medical experts, instead of looking for a quality measure with plausible explanations, if we want to analyze these labeled data and try to emulate the known classification performance delivered by human experts, machine learning, especially the supervised learning methodology [30], is the route to be taken.
Instead of using Eq. (7), which was obtained by trials and errors during offline training and exploratory data analysis, to discriminate 3DCTs of good or bad quality, the supervised machine learning procedure tries to learn a classifier that can strike a valuable compromise between the fitting of the known labels on the training set and the conformation to the known labels (ground truth) provided by human experts over the validation set, a proxy of generality of the classifier. Each 3DCT is represented by a point in the 4-dimensional space whose coordinate is E(k), k  1, which effectively serves as the explanatory variables or features; while the labels given by human experts are the response variable or referred to as the outcome class labels. Therefore, the
  th instance is a 5-D tuple (
 (5),
(5),  (6),
(6),  (7),
(7),  (8),
(8),  , where the class labels
  is 1 or 0 indicating its good and bad quality, respectively. Three learners are trained in this work2:
-
1)
One is the simplest possible one, Naïve Bayes (NB) method that treats the four features as statistically independent [31]. Although extremely simple-minded and naïve, this method nonetheless performs well in many fields, e.g., speech processing.
-
2)
The second one is the support vector machine (SVM), one of the most popularly used classifiers in machine learning in the last decade [26]. It works by looking for the classifier that has the largest possible separating margin between the positive and negative instances, and thus attaining better generality.
-
3)
The third one is one of the most complex classifiers, random forest (RF). It is an ensemble method, which intentionally chooses diversified subsets of features in formulating a set of decision trees [32]. The collection of these diversified decision trees work together as a committee to classify new instances, which consistently delivers top performances.
Equipped with a wealth of training data, machine learning methods can achieve exceedingly impressive performances, as reported in the next section. And the more high quality training data, namely, more representative 4DCT data designated as good and bad quality by medical experts, are made available, the more knowledge will be encoded into the classifier and thus the better results the machine learning algorithm can deliver. One major problem of the machine learning methodology lies in its lack of explanatory power, especially more involved and successful ones such as RF where the number of decision trees and the randomized subsets of features used for individual trees are entirely and intentionally left to chance, thus one cannot pinpoint specific (medical or signal) reasons why it can attain its classification performance. It is thus problematic to use machine learning approaches in clinical work due to the lack of satisfactory explanations of the cause and effect for their workings. However, in our retrospective medical research, they forms the ideal arsenal to emulate human experts in choosing high quality 4DCT sequences for further studies.
III. Experimental Results
Experimental results based on patient data are reported. The next two subsections present test results corresponding to the methods described in the two subsections in Section II in the same order.
A. Automatic Lung Segmentation Results
All the functionalities described in Section II were implemented in a mainly MATLAB-based system, with some functions in C++ for performance considerations. To make them more accessible to clinical researchers a GUI was also developed. Fig. 2 illustrates the main GUI of this system when a 3DCT was loaded. The top row presents three views of a one-phase CT image, while the bottom row shows the corresponding lung segmented using the algorithm described in Section II.A. Numerical measures such as lung volumes and apex/diaphragm values are shown in the text area on the left side.
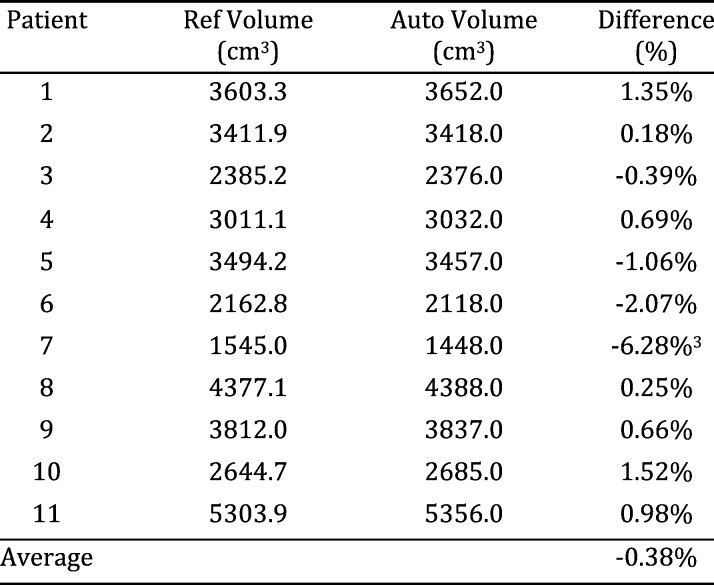
To check the correctness of this algorithm, a treatment planning system for research and planning purposes, was employed to segment out human lungs and compute the lung volumes as the ground truth, whereof intensive human interventions and interactions are needed to assign initial seeds and change thresholds in different regions for high quality lung segmentation. The Lung volumes are compared with those estimated by our algorithm, “Auto Volume” column, to test if our volume estimates are similar to those from the standard approach. The volumes are tabulated in Table 1.
TABLE I.
Volumes Computed by Treatment Planning Package and the Proposed Segmentation Algorithm for 11 Lung Cancer Patients.
The time for segmenting a 4DCT lung volume took about 30 minutes using a clinical semi-automatic tool, whereas the automatic segmentation of a 4DCT took 3–5 minutes.
Because the volumes on each row of Table 1 correspond to the same lung, paired t-test (ttest in MATLAB), which conducts a Student test of the hypothesis that two matched samples come from distributions with equal means, is performed to test the similarity between the data shown in the two columns: the corresponding p-value, the probability of obtaining a test statistic result at least as extreme as the one that was actually observed, is 0.92. This can be further justified by inspecting the relative differences demonstrated in the Difference column of Table 1, the mean and standard deviation of which are −0.38% and 2.30%, respectively. All these consistently suggested that the lung segmented by the proposed algorithm delivers results similar to that by the planning system. Keep in mind that in our system this similar segmentation result is achieved by an automatic procedure without any human interventions. Conversely, in the planning system initial seeds must be provided by human experts for each lung, which is non-scalable in the presence of many 4DCTs. On a Dell Precision M6600 laptop with Intel Core i7–2820QM CPU @ 2.30GHz, to load and segment lung region from a 3DCT ( voxels) takes about 21 seconds. It thus only takes the laptop less than four minutes (
 seconds) to generate all the volume estimates reported in Table 1. By contrast, it cost the human expert more than two hours to obtain the ten volumes from the planning system. The data reported in Table 1 are purely test data: they were not used to train the algorithm to obtain the optimal parameters.
After segmenting out and showing the lung regions, users can explore lung regions interactively. In this interactive mode, users can drag the three slider bars between the two rows to navigate through the 3D images. Window/level, colorized grey scale, and image location can be changed at will on the left panel. Numerical measurement outputs from the currently displayed lung data such as body volume, apex and diaphragm locations, as described in Section II.A.3, are presented in the text area, which can be saved by clicking the save button. The visualization and corresponding numeric evaluations readily available to clinical researchers make possible the interactive exploratory data analysis, one of the most time-consuming and important task in any scientific investigations [26].
The average of3 discrepancy between our new method and an existing planning system is −0.38% in volume difference, which is better than DIR-based method with higher uncertainty [2]–[4]. In addition, the performance of our method is 3−5 minutes for a 4DCT, superior to DIR-based methods, which may consume 30 minutes for all 10-phase CT with user intervention. Comparing with a previous method that also applied anatomic information implicitly [1], this method has better rate (100%) in finding the appropriate lungs and calculates the volume.
B. Tests of 4DCT Quality Measures
1). Tests for Fourier-Analysis-Based Quality Measure
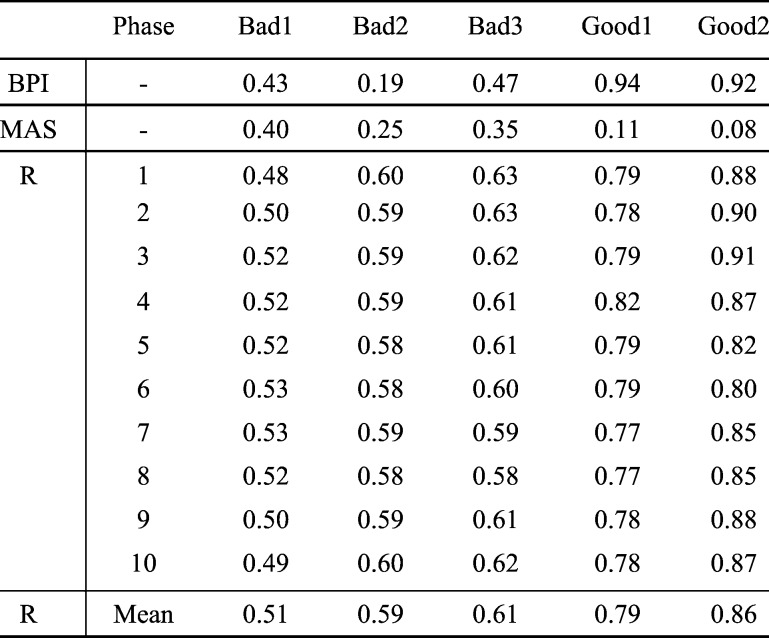
The indexes R’s defined by Eq. (7) in Subsection II.B.1 are computed for five randomly chosen 4DCTs, which are labeled by human experts as three “bad” images with many artifacts and two “good” ones with few artifacts. The R’s for all ten phases of all five 4DCTs are tabulated in Table 2. In Table 2, Breathing periodicity index, denoted by BPI, is defined as the sum of the largest five Fourier components of the breathing curve analysis [29]. Motion artifact severity, denoted by MAS, is the average artifacts in cm measured at each scanning bed junction in cine 4DCT scan across the diaphragm range. This MAS is normalized to maximum diaphragm displacement [29], [33].
TABLE II.
Indexes R’s According to eq. (7) for Ten Phases of Five 4DCTs, Three Bad Ones and Two Good Ones.
To perform paired t-test, all 30 R’s for bad 4DCTs and 20 R’s for good 4DCTs are pooled respectively to form two groups, the unequal sample size t-test can then apply, the resultant p-value is 1.26e-21, hence further indicating the fact that the difference between these two groups is conclusively statistically significant. For our 4DCT quality selection problem, after an intensive bootstrapping statistical study [34] with available data, a threshold 0.7 is chosen to discriminate good from bad quality 4DCT data—if the average R is larger than 0.7, the 4DCT is labeled as good one; bad one otherwise. For different scenarios or data sets, a new threshold different from 0.7 may be needed based on data with different quality criteria and imaging quality.
For ease of visualization, the line graph of R indexes for the five 4DCTs is depicted in Fig. 4, where the wide gaps among the R’s between good and bad quality 4DCTs clearly demonstrate themselves.
Figure 4.
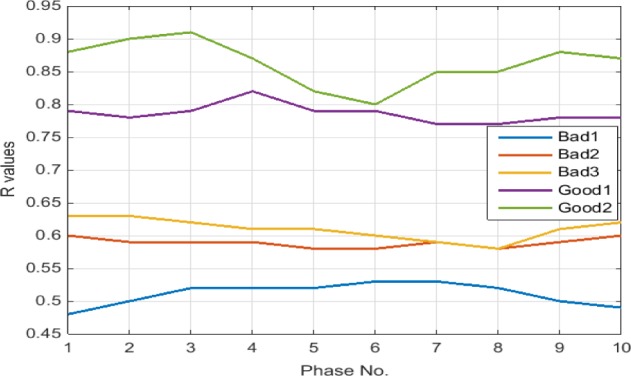
Line graph of index R’s according to Eq. (7) for five 4DCTs tabulated in Table 2.
2). Tests for Machine Learning Data Classification
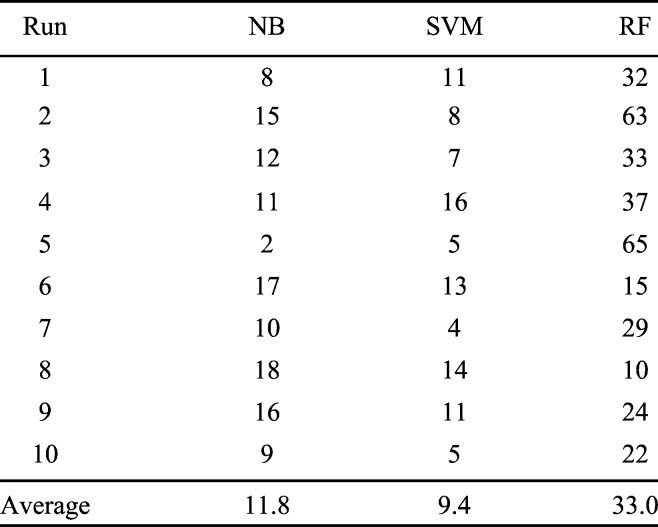
To inspect the performances of the three learners described in Subsection II.B.2, namely, NB, SVM4 and RF, the same five 4DCTs with known labels (assigned by a medical expert) as reported in Table 2 and Fig. 4 are used. To demonstrate their effective classification power, the randomized k-fold cross validation approach, the one widely employed in machine learning communities [26], is used. A two-fold cross validation is intentionally selected to provide a challenging situation for the classifiers: 50%, or 25, randomly chosen instances, of the 50 known instances, serve as the training samples to train the 3 classifiers. The remaining 25 instances are held out as validation samples. The errors of the trained learners over the hold-out test cases signify the classification performances of the corresponding approach. To reduce random fluctuations of error rates incurred by the necessarily randomized choice of training and validation data set, we ran the above-mentioned two-fold cross validation process 100 times and save the sum of errors throughout the 100 runs. Table 3 presents the total errors generated by this loop of cross validation process.
TABLE III.
Two-Fold Cross Validation Studies of NB, SVM and RF for Five 4DCT Data With Known Labels. Each Row Reports Number of Errors for 100 Calls of Cross Validation.
The average error rates for these three classifiers are 0.47%, 0.38% and 1.32%, respectively, which is obtained via dividing the total errors by the product of 100 (number of iterations) times 25 (number of test instances for each cross validation call). Although in general RF is a better methodology, as widely accepted in the machine learning community [30], its performance trails the other two significantly. By contrast, although NB is sometimes even referred to as a simple-minded or silly approach [31], in this 4DCT quality measuring problem it delivers better performance than RF: the t-test p-value for columns NB and RF is 0.0122, thus conclusively suggesting their significant differences. SVM achieved the best performance. However, its performance is insignificant from that by NB: the t-test p-value between columns NB and SVM is 0.1132.
One plausible rationale behind the superiority of the NB and SVM over the more involved random forest lies in the fact that the quality of 4DCT images is determined by a relation among the E(i)’s for i ranging from 5 to 8, one possible relation being the empirical formula Eq. (7). The statistically significant gap for R values between the good and bad quality 4DCTs, as demonstrated in Fig. 4, can also be picked up by NB and SVM (with linear kernel) classifiers. The RF, however, works by randomly choosing a subset of these E(i)’s: if only E(5) and E(6) or E(7) and E(8) are selected to construct some decision trees, more errors are bound to arise.
Besides performing better than RF, NB and SVM attain these results more rapidly: On average, the time consumed by the 100 iterations of the two-fold NB, SVM and RF is 3.62, 1.72, and 9.84 seconds, respectively. SVM (with linear kernel) is also the fastest of these three typical learning methods, besides attaining the best classification performances.
IV. Conclusion
To achieve personalized cancer treatment planning, the spatial and temporal data within the 4-dimensional computed tomography (4DCT) images serve as the foundation to retrieve crucial geometric, topologic and dynamic knowledge. Despite its information contents, the effective processing and analysis of 4DCT are hindered by its unprecedented data volumes. The need of constant human intervention makes it unsustainable and impossible to scale for the large set of 4DCTs. In this work, based on current image processing, computer vision and machine learning techniques, several algorithms were developed to automatically segment out the lungs from 4DCT data, generate an array of useful numeric data, provide user-friendly exploratory data analysis tools, and effective measures gauging the data quality of 4DCT. Based on patient data, the algorithms consistently deliver desirably accurate results with high efficiency in a consistent manner: while the numeric results by the algorithms are statistically similar to those by human experts, the algorithms generates these results faster in time by at least one order of magnitudes, in 4DCT lung segmentation.
Satisfactory performances delivered by the system against ground truths or their proxies were reported here. An initial 4DCT platform was formed by putting these features together. This 4DCT analysis platform not only allows users to use existing features currently available, but also enables us to add new features to extract new respiratory information in the process of clinical research and clinical practice in the radiation therapy clinic. Currently we are actively working on more features such as surface imaging manipulations, motion registration for better tracking, and the establishment of internal-external relationship [33], [35].
Biographies

Jie Wei is currently an Associate Professor with the Department of Computer Science, City College of New York, New York, NY, USA. His research interests include multimodal computing, signal/image/video processing, computer vision, machine learning, and medical imaging.

Guang Li is currently an Assistant Attending Physicist with the Department of Medical Physics, Memorial Sloan Kettering Cancer Center, New York, NY, USA. His research interests include multimodal image-guided radiotherapy and radiosurgery, motion management with 4-D imaging, and 4-D treatment planning.
Funding Statement
This work was supported in part by the National Institutes of Health under Grant U54CA132378 and Grant U54CA137788 and the City College of New York Seed Grant FY13.
Footnotes
E(k) for k between 5 and 8 are automatically selected by using subspace feature selection method as described in [27].
In MATLAB, the training and classification functions for Naïve Bayes, SVM and Random Forest are NaiveBayes.fit/predict, svmtrain/ svmclassify, and Treebagger/predict, respectively.
 Considerable many (>11) large tumors present in this 4DCT, thus causing larger errors in both volume evaluations.
 The results reported here are based on the SVM using linear kernel that delivered the best performance. Other complex kernels such as quadratic and Gaussian radial basis yield significantly worse results (similar to those attained by RF).
References
- [1].Haas B., et al. , “Automatic segmentation of thoracic and pelvic CT images for radiotherapy planning using implicit anatomic knowledge and organ-specific segmentation strategies,” Phys. Med. Biol., vol. 53, no. , pp. 1751–1771, 2008. [DOI] [PubMed] [Google Scholar]
- [2].Lu W., Olivera G. H., Chen Q., Chen M. L., and Ruchala K. J., “Automatic re-contouring in 4D radiotherapy,” Phys. Med. Biol., vol. 51, no. 5, pp. 1077–1099, 2006. [DOI] [PubMed] [Google Scholar]
- [3].Wang H., et al. , “Performance evaluation of automatic anatomy segmentation algorithm on repeat or four-dimensional computed tomography images using deformable image registration method,” Int. J. Radiat. Oncol., Biol., Phys., vol. 72, no. 1, pp. 210–219, 2008. [DOI] [PMC free article] [PubMed] [Google Scholar]
- [4].Wijesooriya K., et al. , “Quantifying the accuracy of automated structure segmentation in 4D CT images using a deformable image registration algorithm,” Med. Phys., vol. 35, no. 4, pp. 1251–1260, 2008. [DOI] [PMC free article] [PubMed] [Google Scholar]
- [5].Viola P. and Jones M. J., “Robust real-time face detection,” Int. J. Comput. Vis., vol. 57, no. 2, pp. 137–154, 2004. [Google Scholar]
- [6].Rother C., Kolmogorov V., and Black A., “‘GrabCut’: Interactive foreground extraction using iterated graph cuts,” ACM Trans. Graph., vol. 23, no. 3, pp. 309–314, 2004. [Google Scholar]
- [7].Bertalmio M., Sapiro G., Caselles V., and Ballester C., “Image inpainting,” in Proc. 27th SIGGRAPH, New Orleans, LA, USA, Jul. 2000, pp. 417–424. [Google Scholar]
- [8].Szeliski R., Computer Vision: Algorithms and Applications. New York, NY, USA: Springer-Verlag, 2011. [Google Scholar]
- [9].Wei J., “Shape indexing and recognition based on regional analysis,” IEEE Trans. Multimedia, vol. 9, no. 5, pp. 1049–1061, Aug. 2007. [Google Scholar]
- [10].Li G., Rosu M., Wei J., Kincard R., and Mechalakos J., “Diaphragm motion heterogeneity as a result of gravity-induced pleural pressure variation during free breathing,” Med. Phys. J., vol. 40, no. 6, pp. 180–181, 2013. [Google Scholar]
- [11].Wei J., “Small moving object detection from infra-red sequences,” Int. J. Image Graph., vol. 14, no. 3, pp. 1350014-1–1350014-18, 2013. [Google Scholar]
- [12].Li G., et al. , “Advances in 4D medical imaging and 4D radiation therapy,” Technol. Cancer Res. Treat., vol. 7, no. 1, pp. 67–81, 2008. [DOI] [PubMed] [Google Scholar]
- [13].Persson G., “Deviations in delineated GTV caused by artefacts in 4DCT,” Radiother Oncol., vol. 96, no. 1, pp. 61–66, 2010. [DOI] [PubMed] [Google Scholar]
- [14].Li G., Cohen P., Xie H., Low D., Li D., and Rimner A., “A novel four-dimensional radiotherapy planning strategy from a tumor-tracking beam’s eye view,” Phys. Med. Biol., vol. 57, no. 22, pp. 7579–7598, 2012. [DOI] [PubMed] [Google Scholar]
- [15].Coolens C., Bracken J., Driscoll B., Hope A., and Jaffray D., “Dynamic volume vs respiratory correlated 4DCT for motion assessment in radiation therapy simulation,” Med. Phys., vol. 39, no. 5, pp. 2669–2681, 2012. [DOI] [PubMed] [Google Scholar]
- [16].Yamamoto T., Langner U., Loo B. W. Jr., Shen J., and Keall P. J., “Retrospective analysis of artifacts in four-dimensional CT images of 50 abdominal and thoracic radiotherapy patients,” Int. J. Radiat. Oncol., Biol., Phys., vol. 72, no. 4, pp. 1250–1258, 2008. [DOI] [PMC free article] [PubMed] [Google Scholar]
- [17].Gonzalez R. C., Woods R. E., and Eddins S. L., Digital Image Processing Using MATLAB, 2nd ed. Gatesmark Pub, 2009. [Google Scholar]
- [18].Perona P. and Malik J., “Scale-space and edge detection using anisotropic diffusion,” IEEE Trans. Pattern Anal. Mach. Intell., vol. 12, no. 7, pp. 161–192, Jul. 1990. [Google Scholar]
- [19].Guidotti P., “Some anisotropic diffusions,” Ulmer Seminare, vol. 14, pp. 215–221, Jan. 2009. [Google Scholar]
- [20].Najman L. and Talbot H., Mathematical Morphology. New York, NY, USA: Wiley, 2010. [Google Scholar]
- [21].Sezgin M. and Sankur B., “Survey over image thresholding techniques and quantitative performance evaluation,” J. Electron. Imag., vol. 13, no. 1, pp. 146–168, 2004. [Google Scholar]
- [22].Wei J., “Lebesgue anisotropic image denoising,” Int. J. Imag. Syst. Technol., vol. 15, no. 1, pp. 64–73, 2005. [Google Scholar]
- [23].Hu S., Hoffman E. A., and Reinhardt J. M., “Automatic lung segmentation for accurate quantitation of volumetric X-ray CT images,” IEEE Trans. Med. Imag., vol. 20, no. 6, pp. 490–498, Jun. 2001. [DOI] [PubMed] [Google Scholar]
- [24].Wei J., “Markov edit distance,” IEEE Trans. Pattern Anal. Mach. Intell., vol. 26, no. 3, pp. 311–321, Mar. 2004. [DOI] [PubMed] [Google Scholar]
- [25].Oppenhaim A. V. and Schafer R. W., Discrete-Time Signal Processing, 3rd ed. Englewood Cliffs, NJ, USA: Prentice-Hall, 2009. [Google Scholar]
- [26].Murphy K. P., Machine Learning: A Probabilistic Perspective. Cambridge, MA, USA: MIT Press, 2012. [Google Scholar]
- [27].Lim J. S., Two-Dimensional Signal and Image Processing. Englewood Cliffs, NJ, USA: Prentice-Hall, 1989. [Google Scholar]
- [28].Wei J. and Li G., “Quantification of motion artifacts in 4DCT using global Fourier analysis,” in Proc. IEEE SPMB, New York, NY, USA, Dec. 2012, pp. 1–5. [Google Scholar]
- [29].Hoaglin D. C., Mosteller F., and Tukey J. W., Understanding Robust and Exploratory Data Analysis. New York, NY, USA: Wiley, 2000. [Google Scholar]
- [30].Hastie T., Tibshirani R., and Friedman J., The Elements of Statistical Learning, 2nd ed. New York, NY, USA: Springer-Verlag, 2009. [Google Scholar]
- [31].Mitchell T. M., Machine Learning. New York, NY, USA: McGraw-Hill, 1997, ch. 1. [Google Scholar]
- [32].Breiman L., “Random forests,” Mach. Learn., vol. 45, no. 1, pp. 5–32, 2001. [Google Scholar]
- [33].Li G., et al. , “Rapid estimation of 4DCT motion-artifact severity based on 1D breathing-surrogate periodicity,” Med. Phys., vol. 41, no. 11, p. 111717, 2014. [DOI] [PMC free article] [PubMed] [Google Scholar]
- [34].Efron B. and Tibshirani R. J., An Introduction to the Bootstrap. Boca Raton, FL, USA: Chapman & Hall, 1993. [Google Scholar]
- [35].Wei J., Yuan A., and Li G., “An automatic toolkit for efficient and robust analysis of 4D respiratory motion,” in Proc. AAPM, 2014. [Google Scholar]


