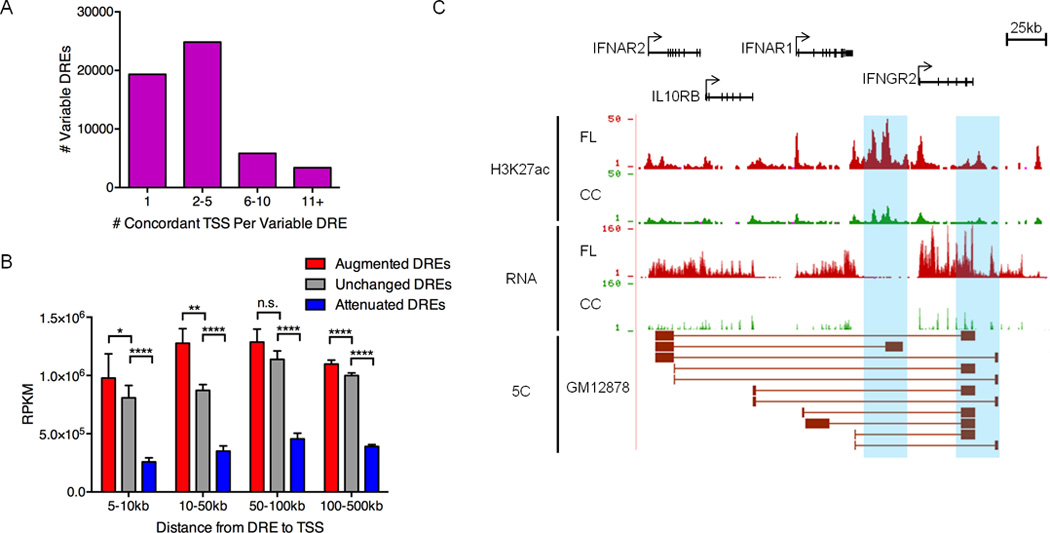
Figure 2. Pathogenic circuitry of FL.

A) Number of TSSs with chromatin fold-change that is concordant with nearby variable DREs (within 500kb). B) Mean transcript abundance as determined by RNA-Seq for genes linked to augmented, unchanged or attenuated DREs and located within the distances shown from the DREs. Statistical significance (Mann-Whitney test): *p≤ 0.05 ** p≤ 0.01, **** p≤ 0.0001. C) UCSC Genome Browser views of H3K27ac ChIP-seq data, showing augmented DREs (highlighted in blue). RNA-seq data depict the corresponding up-regulation of mRNA from DRE target genes. The bottom track shows significant spatial interactions in GM12878 B cells (ENCODE, 5C data) between restriction fragments encompassing the DREs and restriction fragments near the target gene TSSs (Sanyal et al., 2012).
