

Abstract
What kinds of amino acid sequences could possibly be protein sequences? From all existing databases that we can find, known proteins are only a small fraction of all possible combinations of amino acids. Beginning with Sanger's first detailed determination of a protein sequence in 1952, previous studies have focused on describing the structure of existing protein sequences in order to construct the protein universe. No one, however, has developed a criteria for determining whether an arbitrary amino acid sequence can be a protein. Here we show that when the collection of arbitrary amino acid sequences is viewed in an appropriate geometric context, the protein sequences cluster together. This leads to a new computational test, described here, that has proved to be remarkably accurate at determining whether an arbitrary amino acid sequence can be a protein. Even more, if the results of this test indicate that the sequence can be a protein, and it is indeed a protein sequence, then its identity as a protein sequence is uniquely defined. We anticipate our computational test will be useful for those who are attempting to complete the job of discovering all proteins, or constructing the protein universe.
Structurally, proteins are sequences of amino acids1. Not all sequences of amino acids correspond to proteins, however. Previous studies2,3,4 have focused on describing the structure of existing protein sequences in order to construct the protein universe. Recent studies have considered the expansion of the protein universe and its relationship to the Big Bang5,6,7. So far, however, no study has developed a criteria for distinguishing a protein that is part of the protein universe from an amino acid sequence that is not a protein.
In this paper we will describe a 99.69% accurate computational test for determining if an arbitrary amino acid sequence can be a protein. Our computational test makes it possible to quickly determine whether a certain amino acid sequence can be a protein.
Our test is based on a geometric representation of the protein universe that we have constructed using the natural vector representation8. According to this approach, each protein sequence is represented by a unique point in coordinate space.
Our testing has shown that the points corresponding to proteins cluster together and it has revealed a fundamental limit on the distribution of each amino acid within proteins that was not evident previously.
Results
The distribution of a specific amino acid “k” within an amino acid sequence can be described by three quantities:
nk the number of occurrences of the amino acid “k” within the sequence.
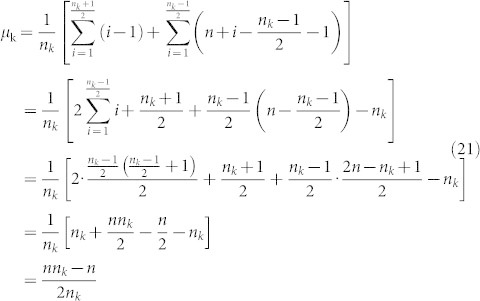
μk the mean distance of the amino acid “k” from the first position.
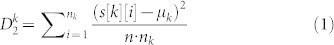
 the second normalized central moment of the distribution of amino acid “k”.
Here is a more precise definition of the second and third quantities:
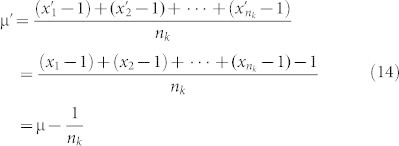
μk: Let s[k][i] be the distance from the first position of the sequence to the location of the ith occurrence of the amino acid k and let 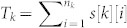 be the total of the distances of all occurrences of k from the start position. Then μk is simply Tk/nk
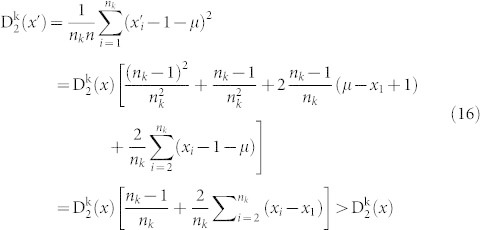
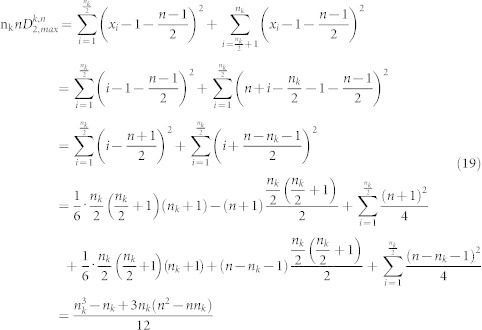
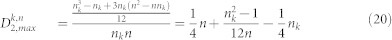
 : Let n denote the length of the sequence, then
  is defined by the following formula.
 |
Using the standard abbreviations (A,R,N,D,C,E,Q,G,H,I,L,K,M,F,P,S,T,W,Y,V) for the 20 amino acids, each amino acid sequence can be represented by a point (called its natural vector) in 60-dimensional space with coordinates:
 |
In general, the natural vector representation is not one to one. Many different amino acid sequences will correspond to the same point in 60-dimensional space. But that is not the case with actual protein sequences. The first key result of this paper is that after collecting all the known, reviewed complete protein sequences available in the UniprotKB database9 and computing their natural vectors, we verified that the natural vector representation is in fact one to one when it comes to known protein sequences.
We define protein space to be the set of all points in 60-dimensional space corresponding to protein sequences, and amino acid space to be the set of points that correspond to amino acid sequences with lengths ranging between the minimum and maximum lengths of the protein sequences.
In order to visualize how the points of protein space are distributed within amino acid space, we plotted them along two of the coordinate axes corresponding to the amino acid Alanine (A). Figures 1 (A) and (B) show the two dimensional projection onto the (nA, μA) coordinate plane, while (C) and (D) show its projection onto the  coordinate plane.
Figure 1. Alanine convex hull computed from the Uniprot 2013_03 dataset.

Blue points in each of these four subfigures stand for vectors corresponding to proteins. (A) shows the picture in (nA, μA) coordinate plane and (C) shows the picture  coordinate plane. (B) is the enlarged view of the protein area in (A). The black lines stand for the boundaries of the convex hull for protein area. (D) is the enlarged view of the protein area in (C). The black lines stand for the boundaries of the convex hull for the protein area.
In the (nA, μA) coordinate plane, the projection of amino acid space is bounded by the folowing three lines
 |
 |
 |
In the  coordinate plane, the projection of the amino acid space is bounded by the following three curves
 |
 |
 |
In these equations, n stands for the maximum length of proteins in the dataset. For the collection of known, reviewed complete protein sequences found in the UniprotKB data as of March 6, 2013, we found that n = 35213.
From Figure 1, we can clearly see that the points of protein space are clustered, rather than being broadly distributed. This makes us believe that as new protein sequences are described, their points will lie approximately within the convex hull of the points corresponding to known protein sequences.
Since there are no efficient algorithms to compute the convex hull in such a high dimensional space, we looked at three dimensional projections of the problem. For each amino acid “k”, we refer to the convex hull of points the form  corresponding to protein sequences as the “k”-protein area. The “k”-amino acid area is the set of points corresponding to amino acid sequences with lengths in the range of actual protein sequences.
We performed several tests to check whether the boundaries of these protein areas will remain stable over time as more proteins are described. We computed the protein areas using the protein sequences listed in an earlier snapshot of the UniprotKB database. Then we tested to see whether more recently added protein sequences would lie within those convex hull. We found that nearly all of the new proteins sequences lie within the convex hulls, and the few that did not were found to lie very close to the convex hull boundaries.
Thus, a second key result of this paper is that we have found strong evidence for the validity of the following computational test:
To check whether an arbitrary amino acid sequence can be a protein sequence, we start by computing its natural vector. Next we search a pre-computed database containing natural vectors that correspond to known protein sequences. If the natural vector is found within that database, we check whether the amino acid sequence is identical to the protein sequence we found. If they are identical, we have our answer. If they are not, the first key result of the paper allows us to conclude that the amino acid sequence is not a protein.
If the natural vector of the amino acid sequence is not found in the database, we proceed to check whether each of the 20 points 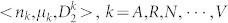 in 3-dimensional space lie within their corresponding “k”-protein area convex hull. If all these checks succeed, we conclude that this amino acid sequence could be a known or unknown protein. If on the other hand, not all points lie within the corresponding convex hulls, by this paper's second key result we would not expect the amino acid sequence to be a protein sequence.
Methods
We took three snapshots of the UniprotKB database to test our hypotheses: Uniprot 2013_03 (March 6, 2013), Uniprot 2014_03 (March 19, 2014), and Uniprot 2014_06 (June 11, 2014). In each case, only the reviewed, complete proteins were selected.
We followed the same procedure for generating all three datasets. We added the keyword “Complete proteome[KW-0181]” to select only complete sequences, eliminating sequences with missing amino acids. We also added the keyword “Reviewed” to restrict to only reviewed proteins. Sequence redundancy was not reduced. After the download, the datasets were normalized by removing protein sequences containing Selenocysteine (U) and Pyrrolysine (O), as well as protein sequences containing placeholders (B, Z, J, X).
Only a small number of protein sequences were eliminated by this normalization process: The number of protein sequences containing Selenocysteine, Pyrrolysine or one of the four placeholders is 971 in the Uniprot 2013_03 dataset, 1010 in the Uniprot 2014_03 dataset, and 1044 in the Uniprot 2014_06 dataset. See Table 1 for details of the counts of sequences in the three snapshots of UniprotKB:
Table 1. Detailed counts of sequences in the three snapshots of UniprotKB.
| Number of Distinct Sequences in Uniprot 2013_03 | 392455 |
| Number of Distinct Sequences in Uniprot 2014_04 | 395514 |
| Number of Distinct Sequences in Uniprot 2014_06 | 397348 |
| Number of Distinct Sequences Uniprot 2013_03 & Uniprot 2014_04 | 391704 |
| Number of Distinct Sequences Contained in all three | 391528 |
| Number of Sequences in Uniprot 2013_03 but not Uniprot 2014_03 | 751 |
| Number of Sequences in Uniprot 2014_03 but not Uniprot 2013_03 | 3810 |
| Number of Sequences in Uniprot 2013_03 & Uniprot 2014_03, but not Uniprot 2014_06 | 176 |
| Number of Sequences in Uniprot 2014_06 but not in the intersection of Uniprot 2013_03 & Uniprot 2014_03 | 5820 |
We used the Uniprot 2013_03 and Uniprot 2014_03 datasets to verify the first key result (the natural vector mapping produces a one-to-one correspondence between proteins and 60-dimensional natural vectors). As can be seen from Table 2, the number of distinct protein sequences in each of these datasets was equal to the number of distinct natural vectors.
Table 2. Corresponding between sequence counts and natural vectors.
| Number of Sequences Before Normalization | Number of Sequences | Number of Distinct Sequences | Number of Natural Vectors | Number of Distinct Natural Vectors | |
|---|---|---|---|---|---|
| Uniprot 2013_03 | 472284 | 471313 | 392455 | 471313 | 392455 |
| Uniprot 2014_03 | 475547 | 474537 | 395514 | 474537 | 395514 |
We also performed several tests to check whether our computational test was effective for determining whether a given amino acid sequence could be a protein or not.
First, we used the 391704 distinct protein sequences contained in both Uniprot 2013_03 and Uniprot 2014_03 to construct twenty 3-dimensional convex hulls using the Qhull algorithm10. Then we checked to see how many of the 3810 sequences contained solely in Uniprot 2014_03 failed to lie outside of the twenty convex hulls. We found that only 14 sequences (only 0.37% of the 3810 sequences) lie outside one of the convex hulls. We also used all 392455 sequences contained in Uniprot 2013_03 to construct convex hulls and the results were the same. None of these 14 sequences were far from the boundaries of the convex hulls. In Table 3, we list the 14 sequences and their distances from the convex hulls, and in Figure 2, we give a graphical display of one of the 14 sequences lying outside one of the convex hulls.
Table 3. The 14 protein sequence outliers in Uniprot 2014_03 and their distances from the convex hulls.
| No. | Sequence Length | Access ID | Convex hull(s) the sequences fall outside | Distance from point to convex hull |
|---|---|---|---|---|
| 1 | 11 | P85817 | Asparagine (N) | 0.0177 |
| 2 | 16 | P81071 | Aspartic acid (D) | 0.0110 |
| 3 | 19 | P68116 | Aspartic acid (D) | 0.0018 |
| 4 | 20 | P14469 | Isoleucine (I) | 0.003 |
| 5 | 199 | Q9ZVZ9 | Histidine (H) | 0.0000208 |
| 6 | 211 | P33191 | Tyrosine (Y) | 0.0027 |
| 7 | 237 | Q6M923 | Glutamine (Q) | 0.0362 |
| 8 | 287 | P50751 | Proline (P) | 0.0044 |
| 9 | 392 | Q5A8I8 | Proline (P) | 33.9023 |
| 10 | 1086 | Q59XL0 | Methionine (M) | 0.4508 |
| 11 | 1129 | Q9QR71 | Glutamic acid (E) | 5.5955 (E) |
| Glutamine (Q) | 1.4455 (Q) | |||
| 12 | 1404 | Q59SG9 | Serine (S) | 0.2427 |
| 13 | 2346 | A1Z8P9 | Glycine (G) | 0.2179 |
| 14 | 3461 | P62288 | Arginine (R) | 1.8593 |
Figure 2. Protein sequence (Access ID P85817) lying outside the Asparagine convex hull.

In the subfigure (A), the cyan surfaces stand for the surfaces of convex hulls in 3-dimensional space. The red point stands for the coordinate  for this sequence. The subfigure (B) is an enlarged view of subfigure (A) showing that the point really falls outside the convex hull.
Second, we computed new convex hulls using the above 391704 protein sequences plus the 14 sequences that failed the first test. We then checked each of the 5820 sequences that are contained in Uniprot 2014_06 but not in the intersection of Uniprot 2013_03 and Uniprot 2014_03 to see how many of them failed to lie within one of the convex hulls. The results of our testing showed that only 18 sequences (only 0.31% of the 5820 sequences) lie outside one of the convex hulls. As in the previous test, none of these 18 sequences were far from the boundaries of the convex hulls. See the supplementary information for tabulation of the distance of each sequence from the convex hulls. Table 4 lists the 18 sequences and their distance from their respective convex hulls.
Table 4. The 18 protein sequence outliers from Uniprot 2014_06 and their distances from the convex hulls.
| No. | Sequence Length | Access ID | Convex hull(s) the sequences fall outside | Distance from point to convex hull |
|---|---|---|---|---|
| 1 | 20 | P82867 | Aspartic acid (D) | 0.0045 |
| 2 | 19 | P68214 | Aspartic acid (D) | 0.0309 |
| 3 | 15 | P80612 | Alanine (A) | 0.3850 |
| 4 | 267 | P14918 | Arginine (R) | 0.0000042949 |
| 5 | 150 | P27787 | Phenylalanine (F) | 0.00025511 |
| 6 | 372 | Q5AKU5 | Histidine (H) | 0.00013742 |
| 7 | 105 | Q2RB28 | Leucine (L) | 0.000053612 |
| 8 | 105 | B9GBM3 | Leucine (L) | 0.000053612 |
| 9 | 94 | Q5G8Z3 | Aspartic acid (D) | 0.0022 |
| 10 | 391 | P46525 | Serine (S) | 0.1044 |
| 11 | 838 | P08489 | Methionine (M) | 0.0840 |
| Valine (V) | 3.0627 | |||
| 12 | 848 | P10388 | Glutamic acid (E) | 0.1269 |
| Methionine (M) | 0.1408 | |||
| Valine (V) | 3.1465 | |||
| 13 | 240 | P04702 | Glycine (G) | 0.000036147 |
| 14 | 240 | P06677 | Glycine (G) | 0.000036147 |
| 15 | 240 | P04703 | Glycine (G) | 0.000036147 |
| 16 | 240 | P06676 | Glycine (G) | 0.000036147 |
| 17 | 267 | P04698 | Glycine (G) | 0.000070559 |
| 18 | 187 | B6U769 | Proline (P) | 0.0037 |
As a final test, we tested to see whether the Top 711, HOP212, and GLUT113 protein sequences lie within the convex hulls constructed from the sequence contained in both Uniprot 2013_03 and Uniprot 2014_03. All three proteins lie inside the twenty convex hulls as expected.
Discussion
Although there were a few proteins in each test which lay outside at least one of the convex hulls, our results are quite promising. The percentage of proteins failing the test were small in both cases (0.37% and 0.31%). In addition, proteins not contained within a convex hull were never far from the boundary of the convex hull. We have every indication to believe that as more protein sequence data becomes available the convex hulls we compute will become more and more reliable and eventually stabilize to give an accurate test for quickly determining whether a certain amino acid sequence can be a protein sequence.
In particular we envision this test being utilized by researchers in at least two different areas. Protein designers attempting to synthesize a new protein could use this test to quickly screen out amino acid sequences which are unlikely to be proteins before undertaking more expensive synthesis work in the laboratory. Similarly, biologists studying alternative splicing14,15 now have a new tool to predict whether an alternative splicing would produce a real protein sequence.
Derivation for the equations of the boundaries of amino acid space
The boundaries of amino acid k in the (nk, μk) plane
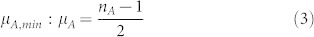
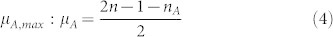
We need to find the minimum value μk,min and maximum value μk,max of the mean among all sequences of length n with nk occurrences of the amino acid k:
Theorem 1. Let nk be the number of occurrences of amino acid k in a sequence of length n. Then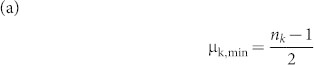
Proof: (a) Obviously if we choose the amino acid k to be distributed in positions  , then we will get the minimum value of μk which is
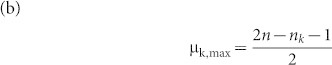
(b) Similarly if we choose the amino acid k to be distributed in positions  , then we will get the maximum value of μk which is
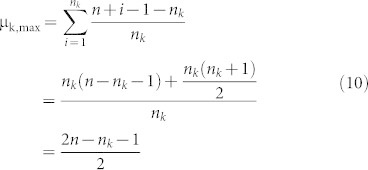
 Remark: The line
  for 1 ≤ nk ≤ c gives the lower boundary of the region while the line
 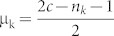 for 1 ≤ nk ≤ c gives the upper boundary of the region. Here c is the maximum length of the sequences in our data set.
The boundaries of amino acid k in the  plane
plane
We start by determining the maximum value  of the second normalized moment among all sequences of length n with nk occurrences of the amino acid k. The following lemmas show that any distribution which doesn't have amino acid k in both the first and last positions will have a second normalized moment which is not maximal.
Lemma 2. Let  be a distribution of the amino acid k. Let
  be another distribution with the properties that
  for 1 ≤ i ≤ nk − 1 and
  . Then
 |
 |
 |
 |
 Lemma 3. let
  be a distribution of the amino acid k. Let
  be another distribution with the properties that
  and
and  for 2 ≤ i ≤ nk. Then
 |
Proof:
 |
 |
 |
 We can now determine the precise distribution of the amino acid k where the maximum value of the second normalized moment is assumed.
Theorem 4. Let 0 < nk ≤ n be fixed positive integers. Let  be a distribution of the amino acid k. If
  attains the maximum value
  among all possible distributions, then
  is of the following form:
Case 1 nk even integer
 |
Case 2 nk odd integer
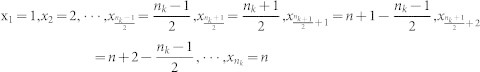 |
Proof: We shall only prove the case when nk is an even integer since the proof for nk an odd integer is the same. We use induction on nk. Let  be any distribution of the amino acid k. In view of Lemma 2 and Lemma 3, we have
 |
 Now that the arrangement of the amino acids is known, the value of
  can be computed.
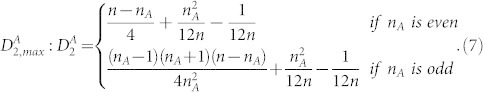
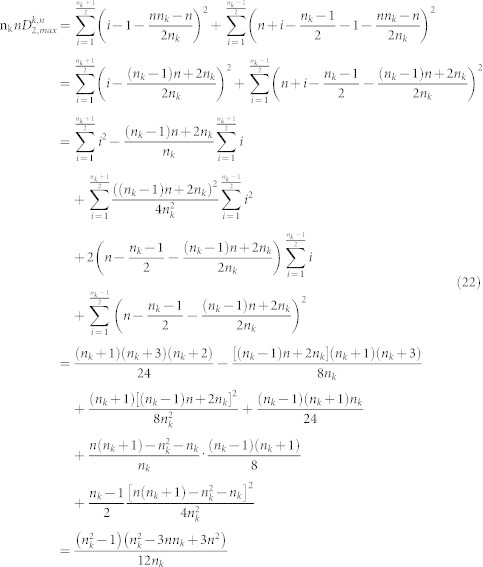
Theorem 5. Let 0 < nk ≤ n be fixed positive integers. Then the maximum value  of all possible distributions
  of amino acid k is given by the following formulas.
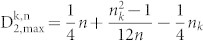
(1) nk even, then 
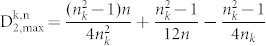
(2) nk odd, then 
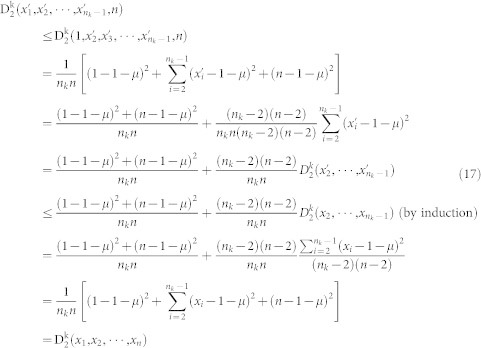
Proof (1) If nk is even, in view of Theorem 4, we have 
(2) If nk is odd, then in view of Theorem 4
 |
 |
 |
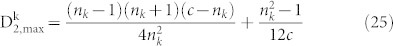
 Corollary 6. Let c be the maximum length of the sequences in the dataset. Let nk, the number of occurrences of the amino acid k, be a fixed even integer. Then
  in the data set is given by
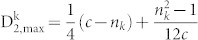 |
Proof: Let 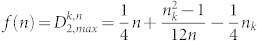 for nk ≤ n ≤ c. We need to find the maximum value of f(n). It is easy to show that f(n) gets its minimum value at the point
  . When n is larger than
  increases as n increases. Since
 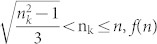 gets its maximum value at point c.
Therefore,
 |
 Corollary 7. Let c be the maximum length of the sequences in the dataset. Let nk, the number of occurrences of the amino acid k, be a fixed odd integer. Then
  in the data set is given by
 |
Proof: Let  for nk ≤ n ≤ c. In this case, the minimum value of f(n) is assumed at
  . When n is larger than
  ., f(n) increases as n increases. Since
  gets its maximum value at point c.
Therefore,
 |
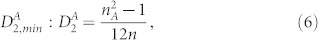
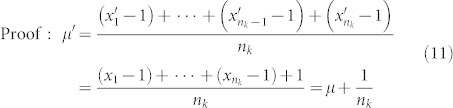
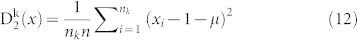
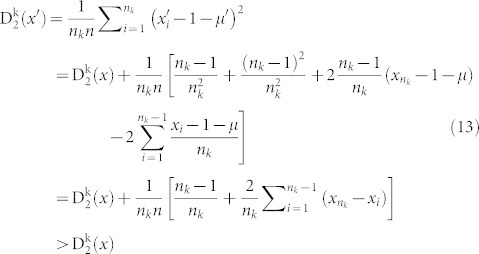
 The final step is to compute the minimum value
  of the second normalized moment. This value is assumed when the amino acid k occupies the first nk positions.
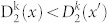
Proposition 8. Let 0 < nk ≤ n be fixed positive integers. Let xi = i, 1 ≤ i ≤ nk, be a distribution of the amino acid k, Then
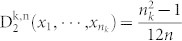
 where
where  is any distribution of the amino acid k.
Proof: We only need to prove (1) since (2) is obvious. 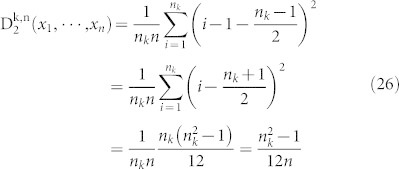
 Corollary 9. Let c be the maximum length of the sequences in the dataset. Let nk, the number of occurrences of the amino acid k, be a fixed number. Then
Author Contributions
S.S.-T.Y. conceived the two criteria and designed the studies. W.G.M. carried out the data analysis including figures drawing. S.S.-T.Y., W.G.M. and R.L.H. provided the theory in Supplementary Materials. All authors participated in writing up the paper. The final version is done by M.B.
Supplementary Material
Supplementary Information
Acknowledgments
This research is supported by the USA Natural Science Foundation. (DMS-1120824 to S. S.-T. Yau), National Natural Sciences Foundation of China. (31271408 to S.S.-T. Yau), Tsinghua University start up fund (to S. S.-T. Yau) and Tsinghua University independent research project grant (to S. S.-T. Yau).
References
- Sanger F. The arrangement of amino acids in proteins. Adv. Protein Chem. 7, 1–66 (1952). [DOI] [PubMed] [Google Scholar]
- Holm L. & Sander C. Mapping the protein universe. Science 273, 595–602 (1996). [DOI] [PubMed] [Google Scholar]
- Levitt M. Nature of the protein universe. Proc. Natl. Acad. Science USA 106, 11079–11084 (2009). [DOI] [PMC free article] [PubMed] [Google Scholar]
- Rackovsky S. Sequence physical properties encode the global organization of protein structure space. Proc. Natl. Acad. Science USA 106, 14345–14348 (2009). [DOI] [PMC free article] [PubMed] [Google Scholar]
- Koonin E. V., Wolf Y. I. & Karev G. P. The structure of the protein universe and genome evolution. Nature 420, 218–223 (2002). [DOI] [PubMed] [Google Scholar]
- Dokholyan N. V., Shakhnovich B. & Shakhnovich E. I. Expanding protein universe and its origin from the biological Big Bang. Proc. Natl. Acad. Science USA 99, 14132–14136 (2002). [DOI] [PMC free article] [PubMed] [Google Scholar]
- Povolotskaya I. S. & Kondrashov F. A. Sequence space and the ongoing expansion of the protein universe. Nature 465, 922–926 (2010). [DOI] [PubMed] [Google Scholar]
- Yu C. et al. Protein space: a natural method for realizing the nature of protein universe. J Theor Biol, 318, 197–204 (2013). [DOI] [PubMed] [Google Scholar]
- The Uniprot Consortium. Activities at the Universal Protein Resource (Uniprot) Nucleic Acids Res. 42, D191–D198 (2014). [DOI] [PMC free article] [PubMed]
- Barber C. B., Dobkin D. P. & Huhdanpaa H. T. The Quickhull algorithm for convex hulls. ACM Transactions on Mathematical Software, 22, 469–483 (1996). [Google Scholar]
- Kuhlman B. et al. Design of a novel globular protein fold with atomic-level accuracy. Science, 302, 1364–1368 (2003). [DOI] [PubMed] [Google Scholar]
- Chan Y. -L. et al. The third exon of the budding yeast meiotic recombination gene HOP2 is required for calcium-dependent and recombinase Dmc1-specific stimulation of homologous strand assimilation. .J Biol Chem 289, 18076–86 (2014). [DOI] [PMC free article] [PubMed] [Google Scholar]
- Deng D. et al. Crystal structure of the human glucose transporter GLUT1. Nature 510, 121–125 (2014). [DOI] [PubMed] [Google Scholar]
- Nilsen T. W. & Graveley B. R. Expansion of the eukaryotic proteome by alternative splicing. Nature 463, 457–463 (2010). [DOI] [PMC free article] [PubMed] [Google Scholar]
- Keren H., Lev-Maor G. & Ast G. Alternative splicing and evolution: diversification, exon definition and function. Nat Rev Genet 11, 345–55 (2010). [DOI] [PubMed] [Google Scholar]
Associated Data
This section collects any data citations, data availability statements, or supplementary materials included in this article.
Supplementary Materials
Supplementary Information