

Abstract
Objectives
Aberrant DNA methylation and gene expression have been reported in postmortem brain tissues of psychotic patients, but until now there has been no systematic evaluation of synergistic changes in methylation and expression on a genome-wide scale from brain tissue.
Methods
In this study, genome-wide methylation and expression analysis were performed on cerebellum samples from 39 patients with schizophrenia, 36 patients with bipolar disorder, and 43 unaffected controls, to screen for the correlation in gene expression and CpG methylation.
Results
Out of 71,753 CpG Gene Pairs (CGPs) tested across the genome, 204 were found to significantly correlate with gene expression after correction for multiple testing [p < 0.05, false discovery rate (FDR) q < 0.05]. The correlated CGPs were tested for disease-associated expression and methylation by comparing psychotic patients with bipolar disorder and schizophrenia to healthy controls. Four of the identified CGPs were found to significantly correlate with the differential expression and methylation of the PIK3R1, BTN3A3, NHLH1, and SLC16A7 in psychotic patients (p < 0.05, FDR q < 0.2). Additional expression and methylation datasets were used to validate the relationship between DNA methylation, gene expression, and neuropsychiatric diseases.
Conclusions
These results suggest that the identified differentially expressed genes with an aberrant methylation pattern can represent novel candidate factors in the etiology and pathology of neuropsychiatric disorders.
Keywords: bipolar disorder, BTN3A3, CpG Gene Pairs (CGPs), DNA methylation, gene expression, NHLH1, PIK3R1, schizophrenia, SLC16A7
DNA methylation is an epigenetic modification that regulates gene expression in response to environmental stimuli (1). DNA methylation play a role in the etiology of illnesses such as schizophrenia and bipolar disorder (referred to here as psychosis). Brain studies using methylation-specific polymerase chain reaction (PCR), bisulfite sequencing, or DNA methylation array reported different DNA methylation levels between psychosis and controls (2-5).
Abnormal methylation can result in aberrant gene expression and is thought to contribute to the susceptibility to and pathology of psychiatric disorders (1, 6, 7). Over the past decade, abnormal DNA methylation and gene expression have been reported in the brain of patients with psychosis (2, 8, 9). For example, reelin (RELN) plays important roles in brain development and maintenance of synaptic function, and its expression is nearly half down-regulated in psychosis (10, 11). Using postmortem brain samples, two groups have found hypomethylated CpG sites in RELN promoter region in patients with schizophrenia rather than in controls (12, 13). Another study from Tamura et al.'s group (14) observed inverse correlation between DNA methylation and RELN expression (i.e., increased methylation correlated with decreased expression), as well as that the level of DNA methylation is correlated with age in normal controls, but no significant correlation in patients with schizophrenia or bipolar disorder. All of those findings confirm RELN's expression is regulated by DNA methylation, and methylation aberration of RELN may be a risk factor in psychiatric disorders.
Correlations between DNA hypermethylation and differential expression of other candidate genes in neuropsychiatric disorders have also been investigated, including dopamine receptor (DRD2, DRD4, DRD5) (15), sex-determining region Y-box containing gene 10 (SOX10) (3), membrane-boundcatechol-O-methyltransferase (MB-COMT) (16), serotonin transporter (17), glutamate metabotropic receptor (18). Those studies imply that DNA methylation may induce lasting and stable changes in gene expression, and consequently, may confer susceptibility to bipolar and schizophrenia. However, to date, there have been no genome-wide studies of the association between DNA methylation and gene expression in the brain to comprehensively identify the functional methylation sites and their corresponding regulatory target genes, and further evaluate their synergic contribution to the development of psychotic disorders.
Recent evidence also suggests that the cerebellum plays important roles in psychotic diseases (19, 20). Schmitt et al. (21) observed altered expression of NMDA receptor subunits in the cerebellum of patients with schizophrenia, and Smolin et al. (22) found aberrant expression patterns of genes encoding neuronal ion-channel subunits in the cerebellum in several psychiatric disorders. Our recent whole-genome expression study also detected an expression module in the cerebellum associated with schizophrenia and bipolar disorder (23). Those findings suggest the existence of novel biomarkers for neuropsychiatric conditions in the cerebellum, indicating its potential significant role in the susceptibility to mental disorders, perhaps through robust projections to multiple neocortical regions. It is also possible that gene expression profiles in the cerebellum are shared with other brain regions directly relevant to neuropsychiatric conditions (19, 23). In either case, the cerebellum may serve as a target brain region in the discovery of biomarkers for psychiatric diseases.
In this study, using cerebellum brain samples we aimed to identify candidate genes with differential methylation and expression patterns in psychotic patients. We did not observe generalized differences between CpG methylation in the brains of patients versus normal controls, when applying strict statistical criteria. We then tested whether disease-associated changes in CpG methylation were present when methylation levels were correlated with the expression of the corresponding genes. With this in mind, we narrowed our search to correlated changes in DNA methylation and gene expression profiles by considering any CpGs located in cis regions of each gene, that is, the CpG Gene Pairs (CGPs). Next, we analyzed the identified gene with cis-positioned CpGs for differential expression in psychotic patients versus normal controls. Finally, the genes with a correlated CpGs and differential expression were examined for differential methylation in psychotic patients. The correlations between differential expression, methylation, and neuropsychiatric conditions were further tested in independent datasets.
Materials and methods
Discovery data collection
Data collection
Brain cerebellum tissue was obtained from the Stanley Medical Research Institute (SMRI) Neuropathology Consortium and Array collection. The cerebellum samples are from the lateral aspect of the posterior lobe (24). After removal of non-European and replicated samples, and quality evaluation of DNA samples and arrays, we had 119 expression arrays and 138 methylation arrays left for differentiation test. The overlapped 118 samples between gene expression and methylation datasets were tested for correlation. Detailed sample characteristics including patients' age and gender, postmortem interval (PMI), and brain pH are provided in Supplementary Table 1.
Genomic DNA was extracted from frozen cerebellar tissues provided by the SMRI. A phenol/chloroform/isoamyl alcohol protocol was modified and followed. The DNA was resuspended in 0.1 mM EDTA TE buffer. Genomic DNA was evaluated by NanoDrop ND-1000 spectrophotometer (NanoDrop Technologies, Wilmington, DE, USA) for concentration and by 1% agarose gel to validate the DNA integrity. All chromosomes, including sex chromosomes, were included in all analysis.
Methylation assays
DNA methylation was profiled at the Genomics Core Facility of Northwestern University (Chicago, IL, USA) with Illumina Infinium HumanMethylation27 BeadChips (Illumina Inc., San Diego, CA, USA) (25). We removed CpG probes as follows: without annotation information, containing common single nucleotide polymorphisms (SNPs), low call rates across samples, or cross-hybridization in the genome. We used ComBat to adjust for batch effects (26, 27). We designed 15 replicate samples in this experiment, and the correlation coefficients of replicate pairs were larger than 0.99. Before analysis, we removed non-European samples, and randomly deleted one sample from replicate pairs. In total, 20,769 CpG probes and 138 samples were selected for further analysis. Beta value (ß) was used to measure methylation level.
Gene expression
RNA was extracted from the cerebellum cortex using the RNeasy Mini kit (Qiagen, Valencia, CA, USA). Affymetrix HuGene 1.0 ST array was used for expression profiling at the NIH Neuroscience Microarray Consortium facility at Yale University. We used RMA (robust multi-array average) to summarize data, and then removed non-expressed probes, deleted non-annotated and common-SNP-containing probes. In addition, we removed probes which were called as ‘absent’ in more than 20% of the samples (23). Batch effects were also adjusted by ComBat (26, 27). In total, 19,984 probes and 119 samples were left for further analysis.
Validation data collection
We used different cohorts to validate the results from discovery dataset (Table 1, Fig. 1).
Table 1. Data summary.
| Type | Source | Region | Sample size | Platform | |
|---|---|---|---|---|---|
| Discovery data | Expression | SMRI | Cerebellum | 119 | Affymetrix HuGene 1.0 ST array |
| Methylation | SMRI | Cerebellum | 138 | Illumina Infinium HumanMethylation27 BeadChips | |
| Validation data | Expression | GEOa | Cerebellum | 106 | Illumina humanRef-8 v2.0 expression beadchip |
| Methylation | GEOa | Cerebellum | 106 | Illumina Infinium HumanMethylation27 BeadChips | |
| Expression | VBBN | Prefrontal cortex | 59 | Affymetrix Human Genome U133 Plus 2.0 Array | |
| Methylation | HBSFRC | Frontal cortex | 48 | Illumina Infinium HumanMethylation450 BeadChips |
SMRI = Stanley Medical Research Institute; GEO = Gene Expression Omnibus; VBBN = Victorian Brain Bank Network; HBSFRC = Human Brain and Spinal Fluid Resource Centre.
Provided by Singleton's lab.
Fig. 1.
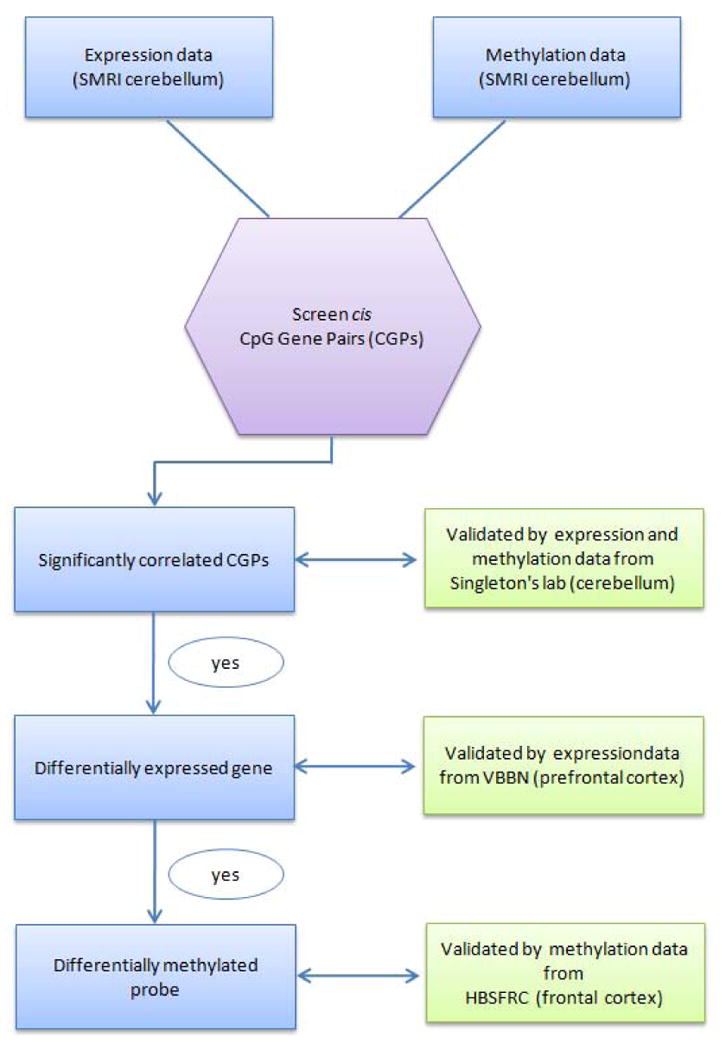
Flow chart of the experimental design. SMRI = Stanley Medical Research Institute; VBBN = Victorian Brain Bank Network; HBSFRC = Human Brain and Spinal Fluid Resource Centre.
Validation data for the correlation test between methylation and expression were downloaded from Gene Expression Omnibus (GEO) database (GSE15745), and generated in the laboratory of Dr. Andrew Singleton. All samples were brain cerebellar tissues collected from non-psychiatric individuals and were profiled for genome-wide DNA methylation and mRNA expression. Demographic information and methodology of brain tissue preparation, RNA extraction, and microarray hybridization were described previously (7). Instead of only testing CpGs in gene promoter region in Singleton's study, our screening strategy allowed us to examine correlation pairs in which the CpG was located in the promoter, gene body and 3′UTR (see our screen method in Data analysis).
Validation data for the correlation test between gene expression and the disease were obtained from the Victorian Brain Bank Network (VBBN). Data contained expression profiles of the prefrontal cortex (Brodmann Area 46) collected from 30 patients with schizophrenia and 29 age- and gender-matched controls. Detailed demographic information, brain tissue preparation, RNA extraction, and microarray experiments were described before (28).
We validated the correlation between DNA methylation and disease by using Wockner's results directly (29). They performed genome-wide DNA methylation analysis on frontal cortex postmortem brain tissue from patients with schizophrenia (n = 24) and normal controls (n = 24). Tissues were obtained from Human Brain and Spinal Fluid Resource Centre [(HBSFRC), brainbank.ucla.edu]. Detailed information about DNA extraction, Illumina Infinium BeadChip experiment, data processing and differential methylation detection were provided in (29).
Data analysis
Screen possible CGPs
We first used perl script to screen all possible cis methylation and expression pairs, where cis was defined as CpG sites located within 50kb upstream or downstream of the corresponding genes (30, 31). Any CpGs mapped in the cis region of the gene will be assigned as one CGP. Thus, one gene can possibly be paired with multiple CpG sites (Fig. 2A). Similarly, one CpG site can possibly be paired with multiple genes (Fig. 2B).
Fig. 2.
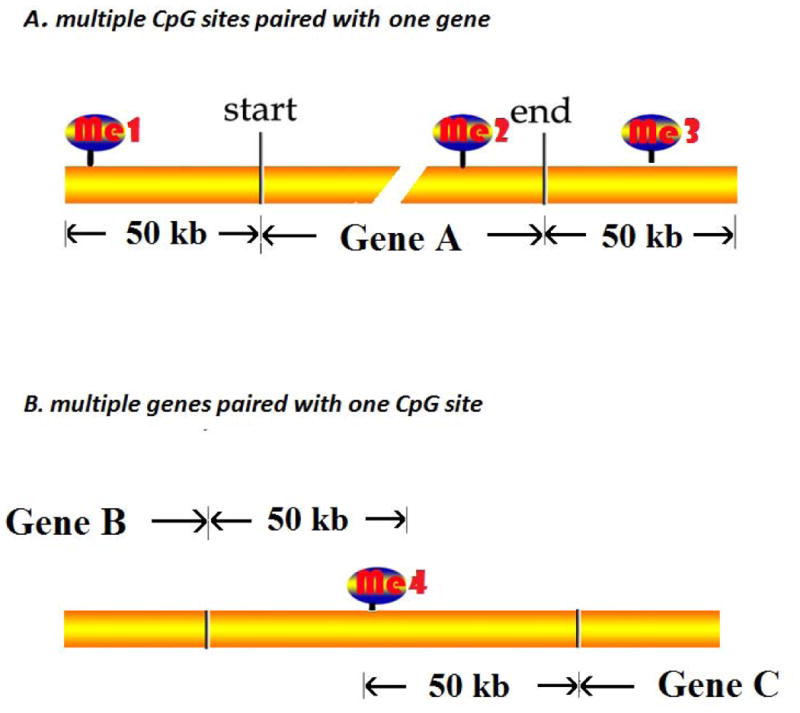
The schema illustrated the strategy to seek all possible CpG Gene Pairs (CGPs). Any CpGs located from upstream 50kb of transcription start site to downstream 50kb of transcription end site of corresponding gene will be assigned as one CGP. (A) Multiple CpGs paired with one gene: me1-Gene A, me2-Gene A, me3-Gene A. (B) Multiple genes paired with one CpG: me4-Gene B, me4-Gene C.
Methylation and gene expression correlation analysis
We used the overlapped samples from both expression and methylation experiment to perform correlation tests. All data were quantile normalized before correlation testing. Overall, 118 samples, including 39 schizophrenia, 36 bipolar disorder, and 43 controls, were used to detect the significant correlations. The correlation test statistic is based on Pearson's correlation coefficient between DNA methylation beta values and gene expression values. The multiple testing correction of correlation p-values was performed using the Partek Genomics Suite (32). Similar statistical tests were performed for the validation datasets. While SMRI samples were profiled for mRNA expression using Affymetrix HG 1.0 ST array and the validation datasets were analyzed using IlluminaHumanRef-8 v2.0 expression beadchip, only the correlation pairs identified in both assays were considered in the calculation for the replication analysis.
Differential gene expression between patients and unaffected controls
A multiple linear regression algorithm was used for each transcript to remove potentially confounding effects. We used age, gender, brain pH, and PMI as covariates. For multiple testing corrections, the p-values for differential expression were adjusted based on 204 correlated CGPs. For expression in the validation datasets, we used nominal p-values without further correction.
Differential DNA methylation between patients and unaffected controls
A multiple linear regression algorithm was used for each methylation probe to remove potentially confounding effects. We used age, gender, brain pH, and PMI as covariates. For multiple testing corrections, the p-values for methylation were adjusted based on 20 differentially expressed genes from correlated CGPs (the result from the analysis in Differential gene expression between patients and unaffected controls). For methylation in the validation datasets, we used nominal p-values without further correction.
The flow chart of study design is shown in Figure 1.
Results
Differentially expressed transcripts and differentially methylated CpGs
The SMRI postmortem brain bank provided cerebellum samples from schizophrenia, bipolar disorder patients and normal controls (24). Details of sample information after quality control are provided in Supplementary Table 1. Each sample was examined for genome-wide DNA methylation at more than 27,000 CpG sites and for the expression of more than 30,000 mRNAs (23, 33).
We first tested differential expression between patients with schizophrenia (n = 39) and controls (n = 43), and between patients with bipolar disorder (n = 36) and controls. For schizophrenia, after adjusting for age, gender, brain pH, and PMI, we found that 4,711 out of 25,811 transcripts showed differences between patients with schizophrenia and controls, with nominal p-values < 0.05. And 874 transcripts were confirmed to be significant after multiple testing corrections [false discovery rate (FDR) q-value < 0.05]. For bipolar disorder, we found that 4,390 out of 25,811 transcripts showed differences between patients (n = 36) and controls, with nominal p-values < 0.05. And 612 transcripts were confirmed to be significant after multiple testing corrections (FDR q-value < 0.05).
Because of the strong genetic correlation between schizophrenia and bipolar disorder (34), we also examined the difference in gene expression between patients diagnosed with the combined two conditions and normal controls. After adjusting for age, gender, brain pH, and PMI, we found that 3,392 out of 25,811 transcripts showed differences between groups with nominal correlation p-values < 0.05. After multiple testing corrections, differential expression of 244 transcripts was confirmed to be significant, with FDR q-value < 0.05. Genes involved in synaptic function were significantly over-presented [p = 2.0E-5, FDR q = 2.7E-2; DAVID functional annotation tool (35)].
The same cohorts were tested for CpG methylation. After adjusting for age, gender, brain pH, and PMI, we found that 488 out of 20,769 CpGs showed differences between patients with schizophrenia and controls, with nominal p-values < 0.05. And 828 out of 20,769 CpGs showed methylation differences between patients with bipolar disorder and controls. In a combined data set, 1,609 out of 20,769 CpGs showed differential methylation comparing the combined two conditions and normal controls with a nominal p-value < 0.05. However, none of CpG sites tested from these three groups is significantly different by FDR (q-value was < 0.05).
Correlation between CpG methylation and gene expression
Next, we analyzed correlated changes of DNA methylation and gene expression. For this, we generated a list of CGPs located in the cis region of each gene using GENCODE data for gene annotation (http://www.gencodegenes.org/). The longest transcript was used if the gene had multiple splicing isoforms. A cis region was defined as the region within 50kb upstream of the gene transcription start site (TSS) and 50kb downstream of the transcription end site (TES).
In total, 71,753 of all possible CGPs were detected based on 20,769 CpGs and 25,811 transcripts (Fig. 2; detailed descriptions in Methods). We used 118 SMRI samples that passed quality control and were overlapped in expression and methylation array for the downstream correlation analysis. Overall, 204 CGPs showed significant correlation after the correction for multiple testing (FDR q < 0.05). Among these, 143 pairs (70.1%) were located within 10 kb upstream or downstream of the TSSs, indicating that the expression-correlated CpG sites were enriched in the 10 kb cis regions. Although CpG methylation is traditionally considered to be associated with gene repression, 46 CpG sites among the 204 differentially methylated CGPs showed a strong positive correlation with gene expression, i.e., increased methylation correlated with increased expression (Supplementary Fig. S1). Most of the differentially methylated CpG sites (117) were located inside CpG islands, while 87 CpG sites were found outside of such islands.
Association of differentially methylated CGPs with gene expression differences between psychotic patients and controls
We narrowed our targets to the set of 204 significantly correlated expression-methylation CGPs, and analyzed for the differential expression for affection status. Unlike 3,392 out of 25,811 transcripts showed differences using the whole data set, we detected 20 genes that exhibited a significant expression difference between controls and patients with a combination of schizophrenia and bipolar disorder, using this 204 CGPs as background (p < 0.05, q < 0.2). These 20 genes were further evaluated for methylation status in the CpG sites; among them, four genes' corresponding CpGs showed significant methylation differences between patients and controls (p < 0.05, q < 0.2) (Table 2), and all of them had previously been reported to be related with neuronal development.
Table 2. Correlation between differential gene expression and DNA methylation in discovery and validation datasets.
| Gene | CpG site | Discovery data | Validation data | ||||||
|---|---|---|---|---|---|---|---|---|---|
| Correlationa | Correlation p (FDR q) | Gene pb (FDR q) | Methylation pc (FDR q) | Correlation (CB2) | Correlation p (CB2) | Gene pb (VBBN) | Methylation pc (HBSFRC) | ||
| PIK3R1 | cg15021292 | -0.39 | 2.5e-9 (3.6e-6) | 7.7e-4 (0.046) | 0.017 (0.085) | -0.07 | 0.44 | 0.18 | 1.3E-05 |
| BTN3A3 | cg25193278 | -0.41 | 3.6e-7 (3.0e-4) | 0.008 (0.010) | 0.0038 (0.032) | -0.40 | 1.7e-5 | 0.08 | N/A |
| NHLH1 | cg12529228 | -0.43 | 3.3e-07 (2.7e-4) | 0.017 (0.133) | 0.039 (0.14) | -0.26 | 2.9e-3 | N/A | N/A |
| SLC16A7 | cg11871280 | 0.29 | 1.3e-4 (0.044) | 0.029 (0.16) | 2.1e-4 (5.4e-3) | 0.30 | 1.4e-4 | 0.90 | N/A |
Among the significantly correlated CpG Gene Pairs (CGPs), we first analyzed the differentially expressed genes and then tested the differentially methylated CpG sites. Cases included patients with schizophrenia and bipolar disorder. Only significant results are shown. FDR = false discovery rate; CB2 = expression and methylation data from Singleton's lab.
Correlation between expression and methylation was tested for each CGP.
Gene p refers to the probability of differential expression between combined schizophrenia and bipolar disorder samples and normal controls in the discovery Stanley Medical Research Institute (SMRI) dataset and between schizophrenia samples and normal controls in the validated Victorian Brain Bank Network (VBBN) dataset.
Methylation p refers to the probability of differential methylation between combined schizophrenia and bipolar disorder samples and normal controls in both discovery SMRI and Human Brain and Spinal Fluid Resource Centre (HBSFRC) datasets.
Phosphoinositide-3-kinase, regulatory subunit 1 (PIK3R1) has been reported to mediateneuregulin1-induced cell survival and to be involved in neurotransmission and neurodevelopment (36, 37). The association of the PIK3R1 gene with neuropsychiatric disorders has been indicated by aberrant PIK3R1expression in the superior temporal gyrus in patients with schizophrenia (38); in addition, the inhibition of PI3K activity has been suggested as a therapeutic strategy for schizophrenia based on a mouse model of psychosis (39). Butyrophilin, subfamily 3, member A3 (BTN3A3), located on chromosome 6p21, is among the strongest gene candidates associated with genetic polymorphisms in Major Histocompatibility Complex (MHC) regions of patients with schizophrenia (40, 41). NHLH1, encoding nescient helix-loop-helix 1protein, has been shown to be expressed in the developing central nervous system (42). Solute carrier family 16, member 7 (monocarboxylic acid transporter 2), encoded by SLC16A7, is involved in shuttling lactate between different cells in brain, and played essential role in synaptic plasticity (43).
Validation of the correlation between DNA methylation and gene expression
To validate the correlation of the selected CGPs with gene expression, we analyzed an independent group of normal cerebellum brain tissues (validation dataset) previously characterized for both gene expression and methylation in the laboratory of A. B. Singleton (7). The analysis was based on 106 samples from non-psychiatric individuals.
After quality control, 47,332 CGPs were selected from this validation dataset. Out of the 204 differentially methylated CGPs selected by the analysis of SMRI samples (discovery dataset), 110 could be tested against the validation dataset (the others were excluded from analysis or filtered out during quality control). Among the tested CGPs, 68 (61.8%) were validated (overlapping test, hypergeometric p < 0.0001). Three out of four previously detected disease-linked CGPs (75%) showing correlation with BTN3A3, NHLH1, and SLC16A7 expression were also confirmed for significant association with psychosis in the validation dataset. The expression of PIK3R1 did not show significant correlation with the methylation in the corresponding CpG site (cg15021292), but the correlation trend was similar to that detected in the discovery dataset (Table 2).
Validation of differential expression
To validate the difference in gene expression, we used an additional expression dataset from the VBBN comprising samples collected from the prefrontal cortex of 30 patients with schizophrenia and 29 normal controls.
We found that BTN3A3 and PIK3R1 showed marginal differential expression (with p-values of 0.08 and 0.18, respectively), whereas SLC16A7 levels did not differ between patients and healthy controls (p = 0.90) (Table 2). The data for NHLH1 was not available in the VBBN dataset.
Validation of differential methylation
To validate the difference in DNA methylation between psychotic patients and healthy individuals, we used published results from an Australian group (29). This group compared methylation differences between patients with schizophrenia (n = 24) and non-psychiatric controls (n = 24) on genome-wide scale. They used frontal cortex tissues provided by HBSFRC, and methylation levels were assessed using Illumina Infinium HumanMethylation450 Bead Chip, which covers over 485,000 CpG sites.
In this sample set, cg15021292 (correlated with PIK3R1) showed a significantly differential methylation in psychotic patients (p = 1.3E-05, FDR q-value = 0.006), whereas the p-values of the other three sites were not provided in Wockner's study (Table 2).
Discussion
Based on the results of this study, we propose a new approach to identify functional DNA methylation-gene expression pairs that could be involved in the etiology or pathology of neuropsychiatric disorders. In our investigation, we focused on correlated variation in methylation and gene expression pairs over the whole genome, and narrowed our targets on correlated pairs to screen for functionality of the methylated sites.
Our study provided novel candidates for the investigation of neuropsychiatric diseases. Four genes showed correlated differential expression and methylation patterns in the brains of psychotic patients. Among them, PIK3R1 was the only gene previously reported as a candidate biological marker for schizophrenia (38, 39, 44), and our analysis suggests that PIK3R1 expression may be functionally regulated by methylation. BTN3A3, known to be involved in adaptive immune responses, is located in the MHC region that was linked to schizophrenia in previous genome-wide association studies (40, 41). However, the MHC region contains multiple genes, and it is difficult to distinguish their individual contribution to the disease. Our study provides a new, simplified approach to examine the functional involvement of the MHC-located genes in psychiatric disorders. Another gene identified in our analysis, NHLH1, was observed to be expressed in the developing nervous system (42, 45).
We also identified one novel target, SLC16A7, which has not been directly reported in psychotic diseases. However, SLC16A7 is translated to protein monocarboxylate transporters 2 (MCT2), which transports the glycolytic product of glucose metabolism, lactate, into and out of neuron cells (43). And the reduce uptake of glucose was reported to produce chronic cognitive difficulties, perpetuate acute symptoms, which may help us to understand in understanding the imaging, postmortem, and pharmacological findings in schizophrenia (46). Moreover, inadequate glucose transport will lead to relative intracellular hypoglycaemia, which will produce acute symptoms, for example disorientation, misperceptions, misinterpretations, anxiety and irritability. Those are the clinical features of prodromal and first-onset schizophrenia (43).
Our study afforded a good opportunity to assess the previous gene expression-methylation correlation results. For example, in our result, COMT expression is inversely correlated with cg15926585 in promoter region (r = -0.16, p = 0.014), which is 818 bp upstream of the TSS; RELN expression is inversely correlated with methylation site cg10007262, and the CpG site locates at 1256 bp downstream of the TSS; OPRM1 expression is inversely correlated with methylation site cg14262937 in promoter region 92 bp upstream of the TSS (r = -0.33, p = 2.98e-4); glutamate/neutral amino acid transporter, SLC1A4 expression is inversely correlated with cg07715387 (r = -0.26, p = 9.67e-4), which locates 144 bp downstream of the TSS. Other reported genes' correlation results were summarized in Table 3. In general, we found that genes indicated earlier were all significantly correlated with at least one CpG site, which proved that our correlation testing result is solid and reproducible.
Table 3. Summary of correlations between CpGs and genes under methylation regulation in previous studies.
| Methylation CpG site | Gene symbol | Correlation | Correlation p-value | CpG islanda | Chromosome | Strand | Dis_TSSb |
|---|---|---|---|---|---|---|---|
| cg14262937 | OPRM1 | -0.329 | 0.000298 | False | Chr6 | + | -92 |
| cg07715387 | SLC1A4 | -0.263 | 0.000967 | True | Chr2 | + | 144 |
| cg10007262 | RELN | -0.213 | 0.004023 | True | Chr7 | − | -1256 |
| cg09722397 | GRIN2C | -0.200 | 0.009505 | True | Chr17 | − | 1023 |
| cg02218260 | GRM2 | -0.197 | 0.046061 | False | Chr3 | + | 1800 |
| cg15926585 | COMT | -0.165 | 0.014661 | False | Chr22 | + | -864 |
| cg19257200 | SOX10 | -0.237 | 0.002032 | False | Chr22 | − | 2446 |
| cg06614002 | SOX10 | -0.232 | 0.013858 | False | Chr22 | − | 2990 |
False (CpG island) = CpG site is not in CpG island; True (CpG island) = CpG site is in CpG island.
Dis_Tss = distance to the transcription start site. Negative value means that the CpG locates on the promoter region; and positive value means that the CpG locates on the gene body region.
However, we also acknowledge that the detected signals were relatively modest to consider for a strong association with the disease, although the correlation between methylation and gene expression was highly significant and replicated throughout the datasets. This observation suggests that the contribution of epigenetic regulatory mechanisms to psychiatric disease may have weak effects, as is the situation with the genetic factors. A larger group of high-quality samples are required for obtaining more conclusive results. Another limitation of our study is most of the patients received antipsychotic treatment, which has been shown to influence DNA methylation (47) and, thus, may be a significant confounding factor. Given that postmortem brains from drug-naïve patients are almost impossible to obtain, future studies should adjust for antipsychotic medications.
To the best of our knowledge, this is the first study on the functional correlation between DNA methylation and gene expression profiles in psychotic disorders. Our results indicate that the major benefit of such a combinatorial approach is that it considers mechanistic links between epigenetic variations and gene transcription and, thus, may provide greater statistical power while using fewer evaluations. By considering functional links between methylation status and gene expression, this method filters out non-synergistic variations and is, therefore, potentially less likely to produce false positive results.
In conclusion, we used expression-methylation correlation as a filter to enhance the detection of genes associated with psychotic diseases. We reduced the number of tests for multiple correction by focusing only on expression-correlated CGPs, and then on disease-associated CGPs. Finally, we detected genes previously shown to be involved in neurotransmission, neurodevelopment, and adaptive immune responses, suggesting a possibility that these genes also contribute to pathogenic mechanisms in psychotic diseases and may be candidates for further investigation.
Supplementary Material
Acknowledgments
The work was funded in part by the Chicago Biomedical Consortium with support from the Searle Funds at The Chicago Community Trust (L-004), by the NIMH 1 R01MH094483-01A1, Conte Center for Computational Neuropsychiatric Genomics (NIH P50MH94267), Eklund Family, and Geraldi Norton Foundation.
Footnotes
Disclosures: The authors of this paper do not have any commercial associations that might pose a conflict of interest in connection with this manuscript.
References
- 1.Jaenisch R, Bird A. Epigenetic regulation of gene expression: how the genome integrates intrinsic and environmental signals. Nature Genet. 2003;33:245–254. doi: 10.1038/ng1089. [DOI] [PubMed] [Google Scholar]
- 2.Mill J, Tang T, Kaminsky Z, et al. Epigenomic profiling reveals DNA-methylation changes associated with major psychosis. Am J Hum Genet. 2008;82:696–711. doi: 10.1016/j.ajhg.2008.01.008. [DOI] [PMC free article] [PubMed] [Google Scholar]
- 3.Iwamoto K, Bundo M, Yamada K, et al. DNA methylation status of SOX10 correlates with its downregulation and oligodendrocyte dysfunction in schizophrenia. J Neurosci. 2005;25:5376–5381. doi: 10.1523/JNEUROSCI.0766-05.2005. [DOI] [PMC free article] [PubMed] [Google Scholar]
- 4.Grayson DR, Jia X, Chen Y, et al. Reelin promoter hypermethylation in schizophrenia. Proc Natl Acad Sci U S A. 2005;102:9341–9346. doi: 10.1073/pnas.0503736102. [DOI] [PMC free article] [PubMed] [Google Scholar]
- 5.Pidsley R, Mill J. Epigenetic studies of psychosis: current findings, methodological approaches, and implications for postmortem research. Biol Psychiatry. 2011;69:146–156. doi: 10.1016/j.biopsych.2010.03.029. [DOI] [PubMed] [Google Scholar]
- 6.Jones PA. Functions of DNA methylation: islands, start sites, gene bodies and beyond. Nat Rev Genet. 2012;13:484–492. doi: 10.1038/nrg3230. [DOI] [PubMed] [Google Scholar]
- 7.Gibbs JR, van der Brug MP, Hernandez DG, et al. Abundant quantitative trait loci exist for DNA methylation and gene expression in human brain. PLoS Genet. 2010;6:e1000952. doi: 10.1371/journal.pgen.1000952. [DOI] [PMC free article] [PubMed] [Google Scholar]
- 8.Sequeira PA, Martin MV, Vawter MP. The first decade and beyond of transcriptional profiling in schizophrenia. Neurobiol Dis. 2012;45:23–36. doi: 10.1016/j.nbd.2011.03.001. [DOI] [PMC free article] [PubMed] [Google Scholar]
- 9.Connor CM, Akbarian S. DNA methylation changes in schizophrenia and bipolar disorder. Epigenetics. 2008;3:55–58. doi: 10.4161/epi.3.2.5938. [DOI] [PubMed] [Google Scholar]
- 10.Impagnatiello F, Guidotti AR, Pesold C, et al. A decrease of reelin expression as a putative vulnerability factor in schizophrenia. Proc Natl Acad Sci U S A. 1998;95:15718–15723. doi: 10.1073/pnas.95.26.15718. [DOI] [PMC free article] [PubMed] [Google Scholar]
- 11.Folsom TD, Fatemi SH. The involvement of Reelin in neurodevelopmental disorders. Neuropharmacology. 2013;68:122–135. doi: 10.1016/j.neuropharm.2012.08.015. [DOI] [PMC free article] [PubMed] [Google Scholar]
- 12.Grayson DR, Jia XM, Chen Y, et al. Reelin promoter hypermethylation in schizophrenia. Proc Natl Acad Sci U S A. 2005;102:9341–9346. doi: 10.1073/pnas.0503736102. [DOI] [PMC free article] [PubMed] [Google Scholar]
- 13.Abdolmaleky HM, Cheng KH, Russo A, et al. Hypermethylation of the reelin (RELN) promoter in the brain of schizophrenic patients: a preliminary report. Am J Med Genet B Neuropsychiat Genet. 2005;134B:60–66. doi: 10.1002/ajmg.b.30140. [DOI] [PubMed] [Google Scholar]
- 14.Tamura Y, Kunugi H, Ohashi J, Hohjoh H. Epigenetic aberration of the human REELIN gene in psychiatric disorders. Mol Psychiatry. 2007;12:593–600. doi: 10.1038/sj.mp.4002014. [DOI] [PubMed] [Google Scholar]
- 15.Kordi-Tamandani DM, Sahranavard R, Torkamanzehi A. Analysis of association between dopamine receptor genes' methylation and their expression profile with the risk of schizophrenia. Psychiatr Genet. 2013;23:183–187. doi: 10.1097/YPG.0b013e328363d6e1. [DOI] [PubMed] [Google Scholar]
- 16.Abdolmaleky HM, Cheng KH, Faraone SV, et al. Hypomethylation of MB-COMT promoter is a major risk factor for schizophrenia and bipolar disorder. Hum Mol Genet. 2006;15:3132–3145. doi: 10.1093/hmg/ddl253. [DOI] [PMC free article] [PubMed] [Google Scholar]
- 17.Abdolmaleky HM, Nohesara S, Ghadirivasfi M, et al. DNA hypermethylation of serotonin transporter gene promoter in drug naive patients with schizophrenia. Schizophr Res. 2014;152:373–380. doi: 10.1016/j.schres.2013.12.007. [DOI] [PMC free article] [PubMed] [Google Scholar]
- 18.Kordi-Tamandani DM, Dahmardeh N, Torkamanzehi A. Evaluation of hypermethylation and expression pattern of GMR2, GMR5, GMR8, and GRIA3 in patients with schizophrenia. Gene. 2013;515:163–166. doi: 10.1016/j.gene.2012.10.075. [DOI] [PubMed] [Google Scholar]
- 19.Konarski JZ, McIntyre RS, Grupp LA, Kennedy SH. Is the cerebellum relevant in the circuitry of neuropsychiatric disorders? J Psychiatry Neurosci. 2005;30:178–186. [PMC free article] [PubMed] [Google Scholar]
- 20.Andreasen NC, Pierson R. The role of the cerebellum in schizophrenia. Biol Psychiatry. 2008;64:81–88. doi: 10.1016/j.biopsych.2008.01.003. [DOI] [PMC free article] [PubMed] [Google Scholar]
- 21.Schmitt A, Koschel J, Zink M, et al. Gene expression of NMDA receptor subunits in the cerebellum of elderly patients with schizophrenia. Eur Arch Psychiatry Clin Neurosci. 2010;260:101–111. doi: 10.1007/s00406-009-0017-1. [DOI] [PMC free article] [PubMed] [Google Scholar]
- 22.Smolin B, Karry R, Gal-Ben-Ari S, Ben-Shachar D. Differential expression of genes encoding neuronal ion-channel subunits in major depression, bipolar disorder and schizophrenia: implications for pathophysiology. Int J Neuropsychopharmacol. 2012;15:869–882. doi: 10.1017/S1461145711001428. [DOI] [PubMed] [Google Scholar]
- 23.Chen C, Cheng L, Grennan K, et al. Two gene co-expression modules differentiate psychotics and controls. Mol Psychiatry. 2013;18:1308–1314. doi: 10.1038/mp.2012.146. [DOI] [PMC free article] [PubMed] [Google Scholar]
- 24.Torrey EF, Webster M, Knable M, Johnston N, Yolken RH. The Stanley Foundation brain collection and Neuropathology Consortium. Schizophr Res. 2000;44:151–155. doi: 10.1016/S0920-9964(99)00192-9. [DOI] [PubMed] [Google Scholar]
- 25.Bibikova M, Le J, Barnes B, et al. Genome-wide DNA methylation profiling using Infinium (R) assay. Epigenomics. 2009;1:177–200. doi: 10.2217/epi.09.14. [DOI] [PubMed] [Google Scholar]
- 26.Johnson WE, Li C, Rabinovic A. Adjusting batch effects in microarray expression data using empirical Bayes methods. Biostatistics. 2007;8:118–127. doi: 10.1093/biostatistics/kxj037. [DOI] [PubMed] [Google Scholar]
- 27.Chen C, Grennan K, Badner J, et al. Removing batch effects in analysis of expression microarray data: an evaluation of six batch adjustment methods. PloS One. 2011;6:e17238. doi: 10.1371/journal.pone.0017238. [DOI] [PMC free article] [PubMed] [Google Scholar]
- 28.Narayan S, Tang B, Head SR, et al. Molecular profiles of schizophrenia in the CNS at different stages of illness. Brain Res. 2008;1239:235–248. doi: 10.1016/j.brainres.2008.08.023. [DOI] [PMC free article] [PubMed] [Google Scholar]
- 29.Wockner LF, Noble EP, Lawford BR, et al. Genome-wide DNA methylation analysis of human brain tissue from schizophrenia patients. Transl Psychiatry. 2014;4:e339. doi: 10.1038/tp.2013.111. [DOI] [PMC free article] [PubMed] [Google Scholar]
- 30.Harris RA, Wang T, Coarfa C, et al. Comparison of sequencing-based methods to profile DNA methylation and identification of monoallelic epigenetic modifications. Nat Biotechnol. 2010;28:1097–1105. doi: 10.1038/nbt.1682. [DOI] [PMC free article] [PubMed] [Google Scholar]
- 31.Quon G, Lippert C, Heckerman D, Listgarten J. Patterns of methylation heritability in a genome-wide analysis of four brain regions. Nucleic Acids Res. 2013;41:2095–2104. doi: 10.1093/nar/gks1449. [DOI] [PMC free article] [PubMed] [Google Scholar]
- 32.Downey T. Analysis of a multifactor microarray study using Partek Genomics Solution. Meth Enzymology. 2006;411:256–270. doi: 10.1016/S0076-6879(06)11013-7. [DOI] [PubMed] [Google Scholar]
- 33.Zhang D, Cheng L, Badner JA, et al. Genetic control of individual differences in gene-specific methylation in human brain. Am J Hum Genet. 2010;86:411–419. doi: 10.1016/j.ajhg.2010.02.005. [DOI] [PMC free article] [PubMed] [Google Scholar]
- 34.Lee SH, Ripke S, Neale BM, et al. Genetic relationship between five psychiatric disorders estimated from genome-wide SNPs. Nature Genet. 2013;45:984–994. doi: 10.1038/ng.2711. [DOI] [PMC free article] [PubMed] [Google Scholar]
- 35.Dennis G, Jr, Sherman BT, Hosack DA, et al. DAVID: Database for Annotation, Visualization, and Integrated Discovery. Genome Biol. 2003;4:P3. [PubMed] [Google Scholar]
- 36.Kainulainen V, Sundvall M, Maatta JA, Santiestevan E, Klagsbrun M, Elenius K. A natural ErbB4 isoform that does not activate phosphoinositide 3-kinase mediates proliferation but not survival or chemotaxis. J Biol Chem. 2000;275:8641–8649. doi: 10.1074/jbc.275.12.8641. [DOI] [PubMed] [Google Scholar]
- 37.Krivosheya D, Tapia L, Levinson JN, et al. ErbB4-neuregulin signaling modulates synapse development and dendritic arborization through distinct mechanisms. J Bio Chem. 2008;283:32944–32956. doi: 10.1074/jbc.M800073200. [DOI] [PMC free article] [PubMed] [Google Scholar]
- 38.Bowden NA, Scott RJ, Tooney PA. Altered gene expression in the superior temporal gyrus in schizophrenia. BMC Genomics. 2008;9:199. doi: 10.1186/1471-2164-9-199. [DOI] [PMC free article] [PubMed] [Google Scholar]
- 39.Law AJ, Wang YH, Sei Y, et al. Neuregulin 1-ErbB4-PI3K signaling in schizophrenia and phosphoinositide 3-kinase-p110 delta inhibition as a potential therapeutic strategy. Pro Natl Acad Sci U S A. 2012;109:12165–12170. doi: 10.1073/pnas.1206118109. [DOI] [PMC free article] [PubMed] [Google Scholar]
- 40.Shi JX, Levinson DF, Duan JB, et al. Common variants on chromosome 6p22.1 are associated with schizophrenia. Nature. 2009;460:753–757. doi: 10.1038/nature08192. [DOI] [PMC free article] [PubMed] [Google Scholar]
- 41.Schizophrenia Working Group of the Psychiatric Genomics Consortium. Biological insights from 108 schizophrenia-associated genetic loci. Nature. 2014;511:421–427. doi: 10.1038/nature13595. [DOI] [PMC free article] [PubMed] [Google Scholar]
- 42.Lipkowitz S, Gobel V, Varterasian ML, Nakahara K, Tchorz K, Kirsch IR. A comparative structural characterization of the human NSCL-1 and NSCL-2 genes. Two basic helix-loop-helix genes expressed in the developing nervous system. J Biol Chem. 1992;267:21065–21071. [PubMed] [Google Scholar]
- 43.Halestrap AP. The SLC16 gene family - Structure, role and regulation in health and disease. Mol Aspects Med. 2013;34:337–349. doi: 10.1016/j.mam.2012.05.003. [DOI] [PubMed] [Google Scholar]
- 44.Liu Y, Li Z, Zhang M, Deng Y, Yi Z, Shi T. Exploring the pathogenetic association between schizophrenia and type 2 diabetes mellitus diseases based on pathway analysis. BMC Med Genomics. 2013;6(Suppl. 1):S17. doi: 10.1186/1755-8794-6-S1-S17. [DOI] [PMC free article] [PubMed] [Google Scholar]
- 45.Brown L, Espinosa R, 3rd, Le Beau MM, Siciliano MJ, Baer R. HEN1 and HEN2: a subgroup of basic helix-loop-helix genes that are coexpressed in a human neuroblastoma. Pro Natl Acad Sci U S A. 1992;89:8492–8496. doi: 10.1073/pnas.89.18.8492. [DOI] [PMC free article] [PubMed] [Google Scholar]
- 46.McDermott E, de Silva P. Impaired neuronal glucose uptake in pathogenesis of schizophrenia - Can GLUT 1 and GLUT 3 deficits explain imaging, post-mortem and pharmacological findings? Med Hypotheses. 2005;65:1076–1081. doi: 10.1016/j.mehy.2005.06.022. [DOI] [PubMed] [Google Scholar]
- 47.Melka MG, Laufer BI, McDonald P, et al. The effects of olanzapine on genome-wide DNA methylation in the hippocampus and cerebellum. Clin Epigenetics. 2014;6:1. doi: 10.1186/1868-7083-6-1. [DOI] [PMC free article] [PubMed] [Google Scholar]
Associated Data
This section collects any data citations, data availability statements, or supplementary materials included in this article.