Abstract
Objective
A new equation for predicting the hand activity level (HAL) used in the ACGIH threshold limit value® (TLV®), was based on exertion frequency (F) and percentage duty cycle (D).
Background
The TLV® includes a table for estimating HAL from F and D originating from data in Latko et al. (1997) and post-hoc adjustments that includes extrapolations outside of the data range.
Methods
Multimedia video task analysis determined D for two additional jobs from Latko’s study not in the original data set, and a new non-linear regression equation was developed to better fit the data and create a more accurate table.
Results
The equation, , generally matches the TLV® HAL lookup table, and is a substantial improvement over the linear model, particularly for F > 1.25 Hz and D > 60% jobs.
Conclusion
The equation more closely fits the data and applies the TLV® using a continuous function.
Practitioner Summary
The original HAL lookup table is limited in resolution, omits values, and extrapolates values outside of the range of data. A new equation and table was developed to address these issues.
Keywords: repetitive motion, work related musculoskeletal disorders, exposure assessment
1. Introduction
The American Conference for Government Industrial Hygienists (ACGIH) hand activity level (HAL) was developed for use with normalized peak hand force (NPF) to estimate the threshold limit value® (TLV®), which is a measure of the risk of work related distal upper extremity musculoskeletal disorders (ACGIH Worldwide, 2001). The TLV® is limited to mono-task jobs that can be characterized as repeated exertions separated by periods of rest and that are performed for four or more hours daily.
The HAL scale was first introduced by Latko, et al. (1997) and incorporated into the TLV®. Up to the time of the Latko (1997) study, repetitive work was characterized in terms of cycle time or exertion frequency (Lupajarvi, et al 1978; Silverstein et al. 1987). Latko et al. (1997) proposed a 10-point visual-analog scale that ranged from idle most of the time/ no regular exertions to rapid, steady motion/ difficulty keeping up or continuous exertion. The observers consider exertion frequency, rest pauses and speed of motion according to specified guideline descriptions.
Latko et al. (1997) reported a coefficient of determination of R2=0.88 for repeated ratings by the same observers after 79 to 118 weeks to show that ratings were consistent over time. Ebersole and Armstrong (2002) analyzed 410 jobs at an automotive assembly plant using two observers recording initial and final rating. Before discussion, HAL reliability was rated as moderate and after discussion, HAL kappa values were rated as good (i.e. 0.75). Ebersole and Armstrong (2006) reported that inter-rater reliability for repetition was high with an interclass correlation coefficient value of 0.71 prior to discussion and 0.87 after discussion. Paulsen et al. (2014) recently reported that HAL inter-rater reliability was a reliable exposure assessment method for 858 cyclic (r̄-barw = 0.69) and non-cyclic work tasks (r̄-barw = 0.68).
Previous studies have shown that a cycle time less than 30 seconds was associated with risk of carpal tunnel syndrome and tendinitis (Silverstein et al. 1987; Armstrong et al. 1989; Roquelaure 1997). Latko et al. (1997) reported that HAL ratings were not strongly related to cycle time but were more closely related to hand exertion frequency (R2=0.58) and duty cycle (R2=0.53). They argued that frequency and duty cycle were better indicators of the biomechanical burden than cycle time. When the TLV® was proposed by the ACGIH, a need for a lookup table was identified for objectively determining HAL based on job descriptions, and exertion time and frequency measurements.
A linear regression model for HAL as a function of frequency and duty cycle was developed by the ACGIH Physical Agents Committee using the data from 31 of 33 jobs in Latko et al. (1997). The equation was then was used to develop a lookup table for estimating HAL. The 2001 TLV® guideline HAL look-up table (reproduced in Table 1) gives approximate HAL values given estimates for exertion frequency F and duty cycle D, where:
Cells in the table that corresponded to D and F below the range of the observed data were left blank or set to one if the predicted value was less than one. When applying the TLV guidelines, practitioners can ascertain frequency and duty cycle information using instruments, video frame-by-frame analysis or other means.
Table 1.
HAL look-up table published in the TLV® Document (2001)
| Frequency (exertions/s) | Period (s/exertion) | Duty Cycle (%)
|
||||
|---|---|---|---|---|---|---|
| 0-20 | 20-40 | 40-60 | 60-80 | 80-100 | ||
| 0.125 | 8.0 | 1 | 1 | -- | -- | -- |
| 0.25 | 4.0 | 2 | 2 | 3 | -- | -- |
| 0.5 | 2.0 | 3 | 4 | 5 | 5 | 6 |
| 1.0 | 1.0 | 4 | 5 | 5 | 6 | 7 |
| 2.0 | 0.5 | -- | 5 | 6 | 7 | 8 |
Although it offers objective measures of HAL, the look-up table provided in the TLV® (Table 1) has several limitations. The HAL values are rounded to the nearest integer and the table includes only five frequency and five duty cycle values. In addition, HAL values are provided for frequency duty cycle combinations outside the range of the experts’ data. An equation that continuously and accurately predicts HAL values along with appropriate ranges for its use would overcome these limitations.
Since its introduction, numerous studies have been published for quantifying repetitive hand motion or for evaluating the efficacy of the TLV® for estimating risk using the HAL scale based on observational or table look-up methods. Observational methods for measuring HAL were employed by Latko et al. (1999), Franzblau et al. (2005), Gell et al. (2005), Violante, et al. (2007), Harris, et al. (2011), Garg, et al. (2012), Bonfiglioli (2013), and Kapellusch et al. (2013). Video frame-by-frame analysis was used by Bao, et al. (2006). Both observational and video methods were employed by Wurzelbacher et al. (2010) and Burt, et al. (2011).
Whether estimating HAL using the observational rating scale or the TLV® lookup table, a positive relationship between HAL and risk of hand and wrist musculoskeletal disorders was established. Significant relationships were found between the TLV® action limit and elbow/forearm tendonitis and carpal tunnel syndrome (CTS) in a cross-sectional study of 908 workers from seven different job sites (Franzblau et al., 2005). Werner et al. (2005) investigated predictors of upper extremity discomfort in a longitudinal study involving 501 industrial and clerical workers over 5.4 years, and found significant increases in musculoskeletal pain were associated with exceeding the TLV® (Odds Ratio = 2.14). A longitudinal study of workers from ten diverse manufacturing facilities and followed monthly for 6 years, found that the TLV®, when treated as a continuous variable, was predictive of increased risk of carpal tunnel syndrome (Garg, et al., 2012), predicted increased risk for carpal tunnel syndrome while controlling for obesity and job strain (Burt, et al., 2013), and that the TLV® showed a statistical trend of association with increased risk of flexor tendon entrapment of the digits using the ACGIH limits (Kapellusch et al., 2013). Armstrong et al. (2006) suggested that the TLV® action limit might be lowered, particularly for surveillance purposes or if other risk factors are observed.
Recent advances allow HAL to be calculated directly using automated video analysis that employs semi-automatic marker-less tracking to measure frequency and duty cycle (Chen et al., 2012). The video-based direct exposure assessment method was demonstrated as promising in a simple laboratory simulation of a hand load transfer task. Such an approach is objective, unobtrusive and does not require attaching sensors to the body of workers, and suitable for a real-time, direct reading exposure assessment instrument for HAL. Automated methods for measuring HAL would benefit from a continuous and accurate equation for calculating HAL directly from the measured parameters.
The Latko et al. (1997) data is reproduced in Table 2 for the 33 jobs that were rated by a team of expert raters. These jobs are described in Latko (1997) for HAL ranging from 1 to 9. Latko had each job rated by the observers (HAL Rating Time 1), and again by the same team a week later (HAL Rating Time 2). These ratings and their average are shown for each job in Table 2.
Table 2.
Data* Used for Calculations in Latko et al. (1997)
| Job | Description | Industry | HAL Rating Time 1 | HAL Rating Time 2 | Average HAL | Frequency (exertions/s) F | Duty Cycle (%) D | Cycle time (s) |
|---|---|---|---|---|---|---|---|---|
| 1 | Inspection | Appliance mfg | 0.8 | 0.4 | 0.6 | 0.125 | 26 | 8.0 |
| 2 | Milacron | Fiber drum mfg | 1.0 | 2.0 | 1.5 | 0.167 | 11 | 30.0 |
| 3 | Marriage Load | Auto components | 1.0 | 1.0 | 1.0 | 0.281 | 54 | 71.3 |
| 4 | Auto Edge Wrap | Auto components | 1.8 | 3.5 | 2.65 | 0.338 | 45 | 80.0 |
| 5 | Water Jet | Auto components | 2.0 | 2.25 | 2.13 | 0.376 | 55 | 122.5 |
| 6 | Transfer Task | Laboratory | 2.2 | 2.5 | 2.35 | 0.167 | 32 | 6.0 |
| 7 | Line Stack | Fiber drum mfg | 2.5 | 4.5 | 3.5 | 0.740 | 31 | 7.0 |
| 8 | Ground Wire | Appliance mfg | 3.4 | 6.25 | 4.83 | 0.820 | 71 | 12.2 |
| 9 | DC Inspection | Glass/mirror mfg | 4.2 | 4.25 | 4.21 | 0.385 | 26 | 13.0 |
| 10 | Silkscreen | Auto components | 4.2 | 5.25 | 4.73 | 0.769 | 86 | 7.8 |
| 11 | Rotary | Fiber drum mfg | 4.4 | 6.0 | 5.2 | 0.500 | 74 | 4.0 |
| 12 | Hanging Parts | Appliance mfg | 4.4 | 4.5 | 4.45 | 0.555 | 59 | 9.0 |
| 13 | Bulkhead | Appliance mfg | 4.6 | 4.0 | 4.3 | 0.320 | 47 | 53.0 |
| 14 | Panel Upholstery | Office furniture mfg | 4.9 | 4.75 | 4.83 | 0.550 | 83 | 150.0 |
| 15 | Fabric Wrap | Auto components | 5.2 | 6.75 | 5.98 | 1.330 | 74 | 40.5 |
| 16 | Transfer Task | Laboratory | 5.2 | 5.25 | 5.23 | 0.333 | 43 | 3.0 |
| 17 | Securing Fan | Appliance mfg | 5.7 | 6.75 | 6.23 | 1.080 | 95 | 12.0 |
| 18 | Wiring Heat Box | Appliance mfg | 5.8 | 6.75 | 6.28 | 0.730 | 84 | 12.3 |
| 19 | Upper Back Panel | Appliance mfg | 6.0 | 6.5 | 6.25 | 0.870 | 100 | 11.5 |
| 20 | Rear Console | Appliance mfg | 6.4 | 5.5 | 5.95 | 0.667 | 87 | 12.0 |
| 21 | Securing Top Panel | Appliance mfg | 6.5 | 6.75 | 6.63 | 0.833 | 100 | 12.0 |
| 22 | Shape Cutter | Glass/mirror mfg | 6.6 | 6.75 | 6.68 | 1.050 | 88 | 42.0 |
| 23 | Paint - Visors | Auto components | 7.2 | 7.5 | 7.35 | 1.260 | 90 | 30.0 |
| 24 | Paint - Armrest | Auto components | 7.2 | 7.75 | 7.48 | 1.110 | 91 | 19.0 |
| 25 | Lid Assembly | Auto components | 7.2 | 7.0 | 7.1 | 0.917 | 95 | 24.0 |
| 26 | CAN Sewing | Auto components | 7.2 | 8.75 | 7.98 | 1.580 | 93 | 48.0 |
| 27 | Deck Sewing | Auto components | 7.4 | 7.5 | 7.45 | 0.568 | 96 | 95.0 |
| 28 | Cup Assembly | Auto components | 7.6 | 7.75 | 7.68 | 0.800 | 92 | 125.0 |
| 29 | Ergo. Upholstery | Office furniture mfg | 7.9 | 8.0 | 7.95 | 0.814 | 90 | 214.0 |
| 30 | Curler | Fiber drum mfg | 8.0 | 8.25 | 8.13 | 1.429 | 71 | 3.5 |
| 31 | Hand Operation 2 | Fiber drum mfg | 8.0 | 9.0 | 8.5 | 1.430 | 81** | 1.4 |
| 32 | Hand Operation 1 | Fiber drum mfg | 8.0 | 9.0 | 8.5 | 1.670 | 82** | 1.2 |
| 33 | Transfer Task | Laboratory | 8.2 | 8.5 | 8.35 | 0.667 | 61 | 1.5 |
|
| ||||||||
| Min | 0.8 | 0.4 | 0.6 | 0.125 | 11 | 1.2 | ||
| Max | 8.2 | 9 | 8.5 | 1.670 | 100 | 214 | ||
| Median | 5.7 | 6.5 | 6.0 | 0.740 | 74 | 12.3 | ||
Shaded region in the table contains data and statistics not originally published in Table II in Latko et al. (1997).
Values obtained for this analysis. Not included in Table II in Latko et al. (1997).
Latko et al. (1997) averaged the observable recovery time across five or more cycles. The time spent in recovery was defined as time in which the busiest hand in the cycle “was not holding, manipulating, triggering, pushing, pulling, or otherwise handling an object.” The average recovery time was divided by the average time spent “performing operations” on one unit of product (the cycle time) to yield an average percent of time spent in recovery. The remaining integer percent (100-R) was reported as duty cycle D.
This paper first determines D estimates for two additional jobs from Latko’s study that were not included in the original data set. Next an equation is developed that more accurately predicts the 33 Latko et al. (1997) HAL values as a function of F and D. Finally the equation is compared to the TLV® HAL table and a new look-up table is presented.
2. Methods
Using the 33 job descriptions in Latko’s study, corresponding figures in Latko et al. (1997), jobs numbered 31 and 32 without duty cycle information were identified as the two handle assembly; riveting jobs in a fiber drum manufacturer both of which have an average HAL of 8.5. These jobs have high frequencies (1.43, 1.67) and low cycle times (1.4, 1.2 seconds). Digital methods were required to find the percent recoveries for both jobs.
The Latko videos of Jobs 31 and 32 were digitized and single frame analysis was conducted utilizing multimedia video task analysis (MVTA, Yen and Radwin, 1995) in order to obtain the previously unavailable recovery time data. The video frame-rate was 30 fps. This allowed frame-by-frame identification and analysis of hand load for the short cycle time jobs. The analyst looked at a sequence of frames to determine whether it was an active exertion.
The motion classifications and definitions from Latko et al. (1997) were used to label active and recovery segments for both jobs. Hand exertions of the most active hand were observed for at least five cycles of the job and averaged. Recovery time was defined as periods when the hand was not holding, manipulating, triggering, pushing, pulling, or otherwise handling an object, and included times when the hand was completely idle, resting upon an object for voluntary support, moving freely, or reaching for an object. These values were divided by cycle time to obtain percent recovery time within the cycle. After confirming the frequency across various cycles throughout the entire video, nine cycles of each job were used to calculate duty cycle. These values appear in Table 2.
A new model for predicting HAL from F and D was developed by fitting candidate three and four parameter asymptotic growth models using F as the “x” variable and allowing the asymptote and growth rate to vary by various functions of D (Ratkowsky, 1990). A broken line model (two segment linear spline) was also considered. All models were fit using non-linear least squares, a generalization of linear least squares used for fitting models that are non-linear in their parameters. This minimization is an iterative process as there is no closed form solution for non-linear models. The ability of the models to fit the data was evaluated using residual plots.
A model that fits the data well will produce a residual plot with residuals evenly scattered around zero. The models that produced good fits to the data were then compared using likelihood ratio tests for nested models (models where one is a version of the other with one or more parameters set to zero) and AIC (Akaike 1974) for non-nested models. The AIC is a measure of the distance between the fitted values and the data penalized for the number of parameters in the model. We also sought to find a model that produces fitted HAL values reasonably consistent with the values in the TLV® table in order to provide continuity with previous research and applications that used that table.
3. Results and Discussion
The newly calculated duty cycle for Jobs 31 and 32 are included in Table 2. The complete 33 job Latko data set is shown in Figure 1. Only two of the 33 jobs exhibited frequencies greater than 1.50 exertions/s, and no job exceeded 1.70 exertions/s. Jobs with high frequencies tended to have long duty cycles (Spearman correlation = 0.66). Summary statistics for the job parameters for the full data set was computed and provided in Table 2.
Figure 1.
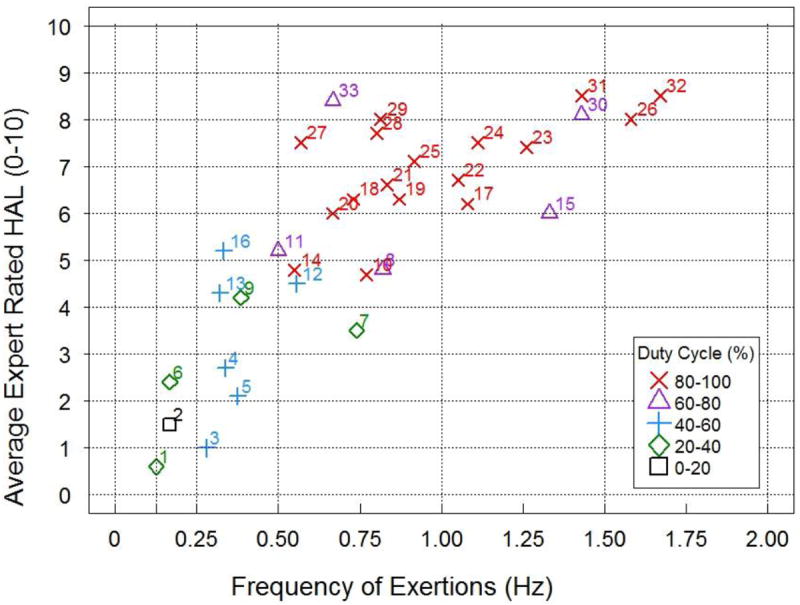
Complete 33 job data set. Job numbers are shown next to plotted values (including Jobs 31 and 32).
Overlays of the Latko frequency of exertions and duty cycle data (33 jobs) and the TLV® table HAL ranges are shown in Figure 2. Some of the HAL values in the TLV® table are for frequency and duty cycle combinations not covered by the data, especially for high frequencies that were extrapolated outside of the range of the observed data. The regions corresponding to these table cells are colored grey in Figure 2. Eight of the HAL predictions are outside the range of the observed frequencies and duty cycles in the original data. In general, predictions from a model that are outside the range of the data are unreliable since there is no way to know if the model is accurate in these regions. Given the lack of data above 1.5 exertions/s, it is proposed that the frequency row labeled 2 exertions/s in the TLV® table should more accurately be labeled 1.5 exertions/s.
Figure 2.
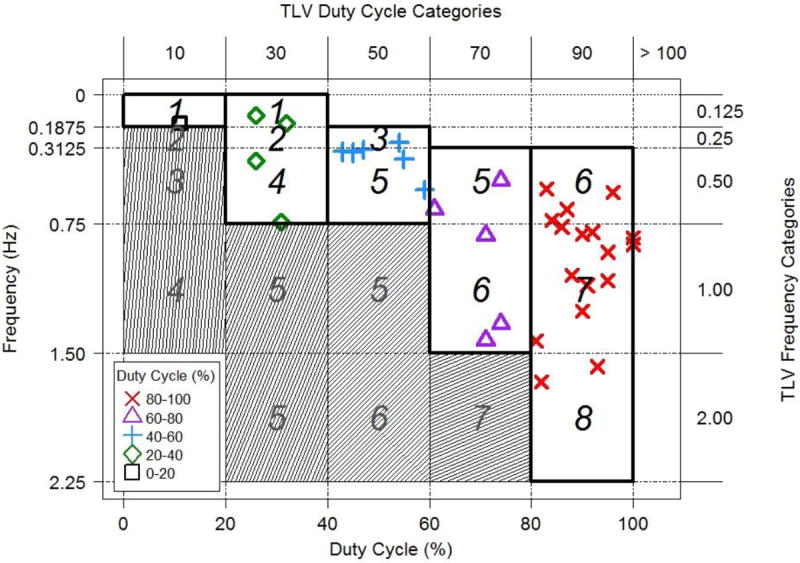
The Latko data (33 observations) are compared against the HAL values in the TLV Table 1. The plot is oriented similar to the HAL table and areas where table values are provided without data are shaded in grey.
3.1 Linear Regression Model
The linear regression model for average rated HAL as a function of period and duty cycle used to populate the TLV table was reproduced using the Latko et al. (1997) data shown in Table 2 (omitting Jobs 31 and 32). That model is
| (Equation 1) |
where F is frequency in exertions/s, D is percent duty cycle HAL is average HAL. The HAL values predicted by Equation 1 for the 5 duty cycle values in the TLV table are shown in Figure 3 as curves. The HAL values from the TLV® table are shown as symbols.
Figure 3.
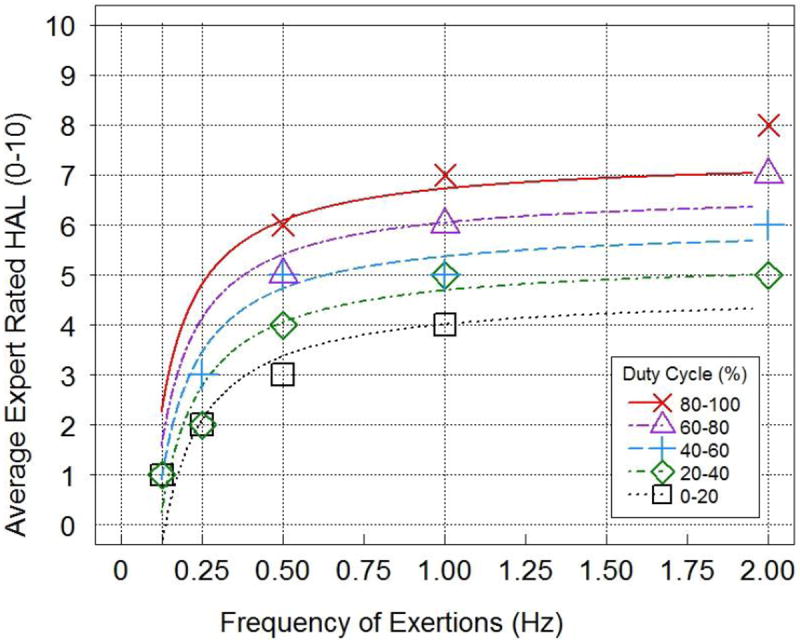
HAL values predicted by Equation 1 from Table 1 of the TLV. The smooth curves are the fitted values for Duty Cycles of 10, 30, 50, 70 and 90 as a function of Frequency. The symbols are the values from the TLV® Table 1.
It is apparent that the TLV® table HAL values for the higher frequencies and duty cycles have been adjusted from the values predicted by the linear regression equation (Equation 1). The TLV® table values were adjusted upwards from the regression model predictions for F = 2 and D ≥ 50% (as described in the TLV® documentation). The TLV® table also specifies HAL=1 when Equation 1 predicts negative HAL values (i.e. F ≤ 0.125, D < 50). Consequently Equation 1 is not useful as a continuous representation of HAL for measured values of F and D.
The linear regression model in Equation 2 was estimated using the complete 33 job data set:
| (Equation 2) |
The addition of jobs 31, 32 to the data set increased the fitted values at higher frequencies slightly, but the model was still not a good fit to the data. The residuals from this fit are shown in Figure 4 (a). The residuals for small and large predicted HAL values are all larger than zero indicating that the linear curve under predicts very small and very large HAL values.
Figure 4.
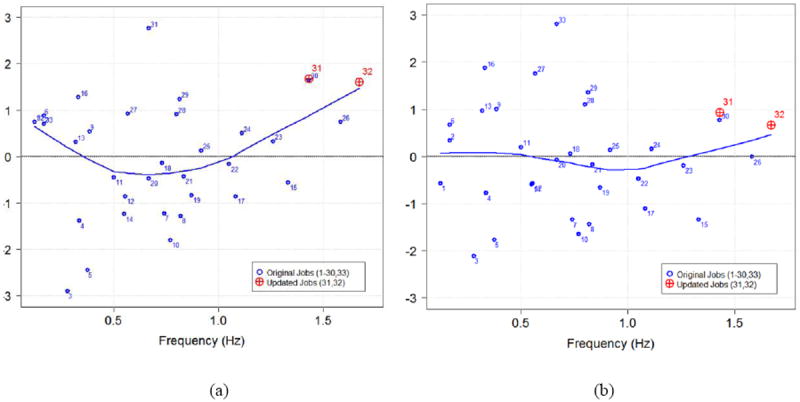
Residual plot (observed value - predicted value) for the linear model (a) in Equation 2 and the non-linear regression model (b) in Equation 3. The numbers adjacent to data points correspond to the job numbers in Table 2. The curves indicate the trend of the residuals. Ideally these would lie exactly on the residual equal zero line.
3.2 Non-linear Regression Model
We considered other linear and nonlinear functions of frequency and duty cycle to see if a better model could be developed for HAL. The model shown in Equation 3 is the simplest model found that provided both a good fit to the data and closely matched the HAL table (Table 1) values from the Latko (1997) data that are within the range of the data. The predictions from the model are plotted with the Latko data in Figure 5 (b) and a residual plot is shown in Figure 4 (b). The residuals for this model indicate a better fit to the data than Equation 2, the estimated residual standard deviation (the typical distance from the data to the fitted model) is smaller for the nonlinear model (1.18 vs 1.31) and the AIC is lower (109.3 vs. 116.2).
| (Equation 3) |
Figure 5.
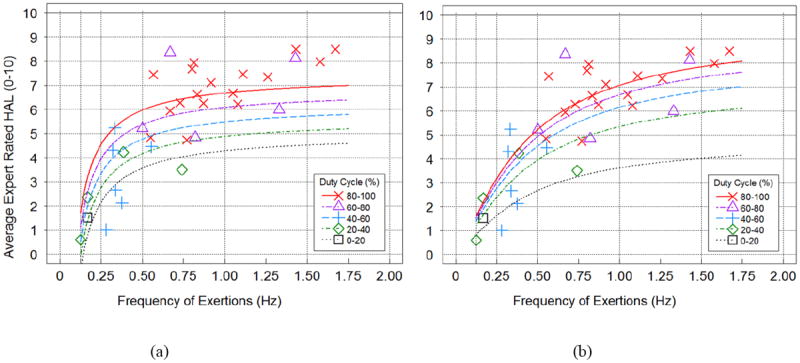
Linear (a) and non-linear (b) regression models with complete Latko et al. (1997) data. The smooth curves are the fitted values for Duty Cycles of 10, 30, 50, 70 and 90 as a function of Frequency.
The nonlinear model in Equation 3 closely follows the original TLV® table (Table 1). Differences between Equation 3 predictions and the original TLV® table are plotted in Figure 6. The adjustments for 90 percent duty cycle made for the original TLV® table are captured by Equation 3.
Figure 6.
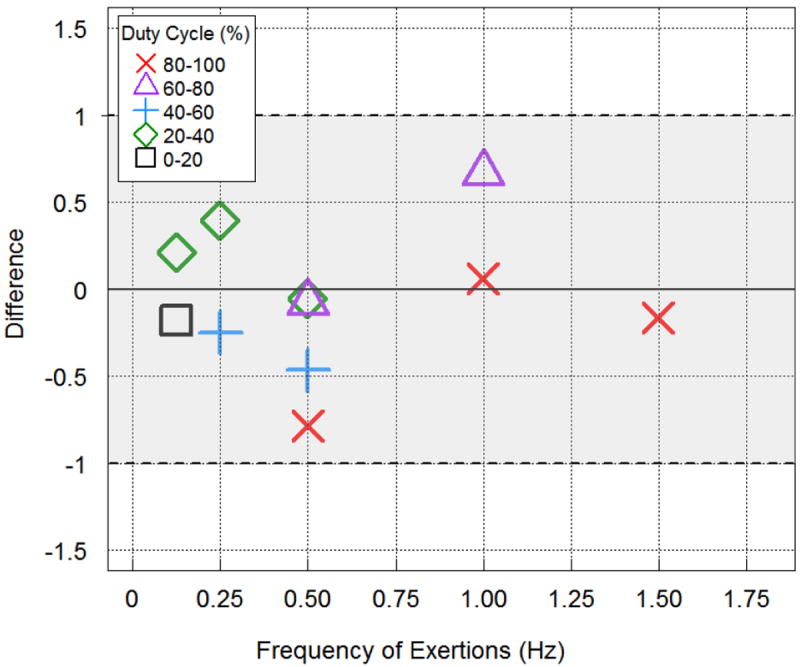
Differences between the nonlinear model predictions and values in the original TLV® table which are within the range of the data.
The TLV® table corresponding to Equation 3 is shown in Table 3. Values that differ from the current TLV® table (Table 1) are indicated by an asterisk. Ebersole and Armstrong (2002) found that observers were in agreement within one point of the scale 91% of the time. We have reported the predicted HAL values to one decimal place so that these values can be used in calculations such as means and differences and for comparison.
Table 3.
HAL look-up table based on Equation 3
| Frequency (exertions/s) | Period (s/exertion) | Duty Cycle (%)
|
||||
|---|---|---|---|---|---|---|
| 0-20 | 20-40 | 40-60 | 60-80 | 80-100 | ||
| 0.125 | 8.0 | 0.8 | 1.2 | |||
| 0.25 | 4.0 | 2.4 | 2.8 | |||
| 0.5 | 2.0 | 4 | 4.5 | 4.9 | 5.2* | |
| 1.0 | 1.0 | 6.7* | 7.1 | |||
| 1.5** | 0.67** | 7.4** | 7.8** | |||
Differs from the TLV® table
Entries not included in the original TLV® table
 Outside the range of the data
Once calculations are complete HAL values should be rounded to integer values. HAL values were rounded off to the nearest whole number because it was believed that even single decimal values implied greater accuracy and precision than could be supported by the data (ACGIH 2001). In light of recent studies (e.g., Ebersole, et al., 2002; Bao, et al., 2006; Paulson, et al., 2014), single decimal values may facilitate comparing ratings and jobs. Also, single decimal accuracy helps provide insight to the analyst about how much exertion frequency needs to be decreased or recovery time needs to be increased to achieve compliance with the TLV®. It can help the analyst decide if the value should be rounded up or down due to other exposure factors such as posture. A mathematical expression provides estimates of HAL to the nearest 0.1 units will be useful for practitioners.
The TLV® was based on epidemiological and fatigue studies that were available at the time the TLV® was first proposed in 2000 (ACGIH 2001) for estimating combinations of peak force and HAL associated with elevated risk of hand, wrist and forearm work related musculoskeletal disorders. The TLV® for hand, wrist, and forearm work related musculoskeletal disorders recommended an action limit (AL) that should trigger a control program that includes risk factor and health surveillance, education and appropriate control measures as well as a TLV® that should also trigger a control program immediate attention to that exceed the TLV® and to workers performing them.
The availability of an accurate equation for HAL makes it possible to visualize the TLV® guidelines graphically and analytically. The TLV® normalized peak force (NPF) can be expressed as an equation:
Using the expression for HAL given in Equation 3 we obtain the following equation for the TLV:
This limit is shown as a function of frequency for a number of duty cycle values in Figure 8. Similarly, the AL linear equation for NPF is:
and is displayed in Figure 8 as a function of frequency and duty cycle.
Figure 8.
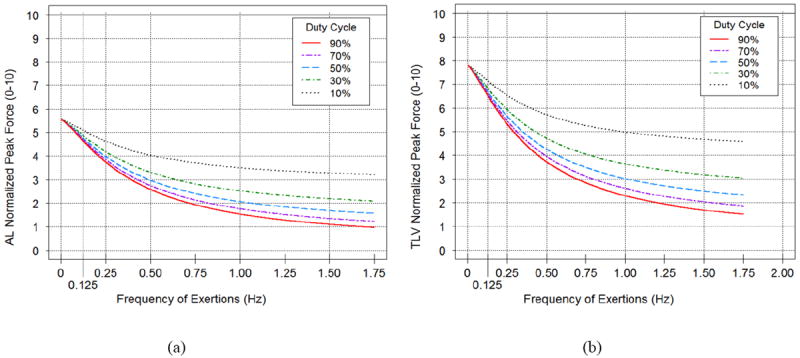
Action Limit (a) and Threshold Limit (b) for normalized peak force plotted against frequency and duty cycle values of 10, 30, 50, 70 and 90, according to Equation 3 and the specified AL and TLV functions.
The utility of using this equation in practice may be illustrated in the following example. Consider a task having a frequency F=0.5 Hz and duty cycle D=90%. Under the HAL look-up table (Table 1) published in the TLV® Document (2001), the job would have a HAL=6. Correspondingly, Equation 3 yields HAL=5.2. Rounding HAL to5 would result in a difference in NPF for the TLV of 0.78 on a 0 to 10 scale, and consequently over-estimate the TLV using the original Table 1.
The current HAL scales, equations, and tables are all based on a relatively small number of observed data that were used in the original studies by Latko et al. (1997). While the proposed equations appear to provide reasonable extrapolations beyond the range of observed data -- they are still extrapolations and should not be relied on beyond the range of the original data. Theoretical models are needed that account for the tradeoff between force, frequency and recovery time. This is a complex multi factorial relationship involving both short term and long term biomechanical and physiological processes that will most likely prove to be nonlinear. Future research may further optimize the equation and complete gaps in the table. Observations of additional jobs over the range of forces and frequencies of the jobs shown in Table 1 should be used to validate the proposed equations until theoretical models are developed and accepted.
3.3 Equation Validation
The nonlinear equation for HAL (Equation 3) was validated against a set of 30 job video segments (tasks) from Harris, et al. (2011). Tasks were selected at random and deemed eligible for inclusion if the video contained no breaks, corruptions or jumps, had unambiguous task descriptions, and had corresponding expert HAL ratings. Five tasks were excluded from the initial random selection due to video recording jumps or incomplete task depiction in the video record. The resulting random selection included 30 different subjects performing 24 unique tasks, and had expert rated HAL values ranging between 2 and 8.
MVTA single frame video analysis was performed to measure frequency and duty cycle for each task. Exertion time and rests periods in these segments were consistent with Latko (1997). Exertions were considered a unique application of force by a loaded hand, while rest was marked only when the hand was unloaded. At least 10 cycles of exertions and rest periods for each video segment were marked using MVTA software and the subsequent frequencies and duty cycles were calculated directly.
The resulting linear regression (with intercept set to zero) between the equation predicted HAL and the observed HAL values had a slope of 1.04 (p < .001) and R2 = 0.95, and is plotted in Figure 9. Residual analysis for this regression (equation fit-observed HAL) compared against table-predicted HAL values from Table 1 (table value-observed HAL) suggested an improvement for Equation 3 over the original HAL table, especially for high and low HAL values. Table residual values ranged between -3.5 to 2, while all residual values from Equation 3 were contained within the range -2.2 to 2.2. The equation to predict HAL was more randomly distributed and reduced the tendency to under-predict HAL for high frequency and high duty cycle combinations.
Figure 9.
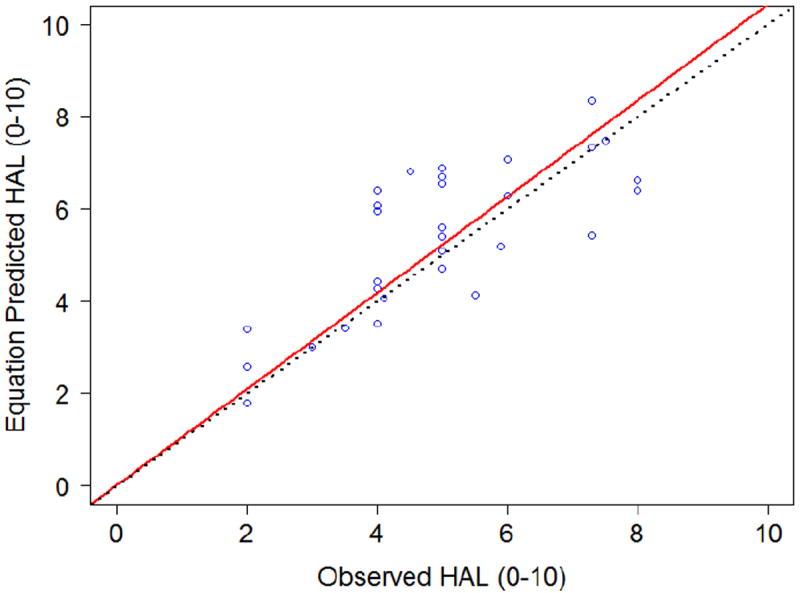
Validation (N = 30) between expert observed HAL and equation predicted HAL (by Equation 3.)
Although the equation to predict HAL offers a better estimate than a look-up table, the non-linear regression model contained residuals for some data points that exceeded HAL=2 (Figure 5b), indicating that the model did not account for some of the variance. A companion paper (Akkas, et al., 2014) explores substituting tracked RMS hand speed for F to automatically estimate HAL using video tracking, and compares the fit when modeling HAL based on F or speed.
4. Summary and Conclusions
This paper reviewed the origin of the table for calculating HAL from objective measures of F and D, used in the calculation of the repetitive motion TLV®, examined its limitations and developed a new equation that provides a continuous HAL scale and allows an improved table. We have arrived at the following observations and conclusions.
Some of the HAL values in the ACGIH TLV® table are for frequency and duty cycle combinations not covered by the original Latko et al. (1997) data, especially for high frequencies.
The Latko et al. (1997) data omitted duty cycle for two high frequency jobs (No. 31 and 32), which were not used in creating the TLV® HAL Table. We digitized the original videos and calculated the duty cycles for these jobs. The percent recovery for Jobs 31 and 32 was 81% and 82% respectively.
We observed that when the TLV® HAL Table was created, the values for low frequencies and short duty cycles were set to 1, HAL for frequencies of 2 exertions per second were adjusted one unit greater than the original linear model actually predicted, and extrapolated outside the range of the available data.
A new equation was developed that provides HAL predictions for all values of duty cycle and frequency within the range of the Latko et al. (1997) data.
Given the lack of data above 1.5 exertions/s, it is proposed that the frequency row labeled 2 exertions/s in the ACGIH TLV® table should more accurately be labeled 1.5 exertions/s.
Acknowledgments
This study was funded, in part, by a grant from the National Institute for Occupational Safety and Health (NIOSH/CDC), R21OH010221 (Radwin). Additional support came from the National Institute for Occupational Safety and Health (NIOSH/CDC), R01OH007914 (Rempel).
References
- ACGIH Worldwide. Hand Activity Level TLV®. Cincinnati, OH: 2001. [Google Scholar]
- ACGIH Worldwide. Documentation of the TLVs® and BEI with other worldwide occupational exposure values. Cincinnati, OH: 2005. [Google Scholar]
- Akaike Hirotugu. A new look at the statistical model identification. IEEE Transactions on Automatic Control. 1974;19(6):716–723. [Google Scholar]
- Akkas O, Azari DP, Chen C-HE, Hu YH, Ulin SS, Armstrong TJ, Rempel D, Radwin RG. A hand speed and duty cycle equation for estimating the ACGIH hand activity level rating. Ergonomics. 2014 doi: 10.1080/00140139.2014.966155. In Press. [DOI] [PMC free article] [PubMed] [Google Scholar]
- Armstrong TJ, Fine LJ, Goldstein SA, Lifshitz YR, Silverstein BA. Ergonomics considerations in hand and wrist tendinitis. The Journal of Hand Surgery. 1987;12(5):830–837. doi: 10.1016/s0363-5023(87)80244-7. [DOI] [PubMed] [Google Scholar]
- Armstrong TJ, Ebersole ML, Franzblau A, Ulin S, Werner R. The ACGIH TLV®: A Review of Some Recent Studies. International Ergonomics Association Meeting; Maastricht , The Netherlands. 2006. [Google Scholar]
- Bao S, Howard N, Spielholz P, Silverstein B. Quantifying repetitive hand activity for epidemiological research on musculoskeletal disorders – Part II: comparison of different methods of measuring force level and repetitiveness. Ergonomics. 2006;49(4):381–392. doi: 10.1080/00140130600555938. [DOI] [PubMed] [Google Scholar]
- Bonfiglioli R, Mattioli S, Armstrong TJ, Graziosi F, Marinelli F, Farioli A, Violante FS. Validation of the ACGIH TLV for hand activity level in the OCTOPUS cohort: a two-year longitudinal study of carpal tunnel syndrome. Scandinavian journal of work, environment & health. 2013;39(2) doi: 10.5271/sjweh.3312. [DOI] [PubMed] [Google Scholar]
- Burt S, Crombie K, Jin Y, Wurzelbacher S, Ramsey J, Deddens J. Workplace and individual risk factors for carpal tunnel syndrome. Occupational and Environmental Medicine. 2011;68:928–933. doi: 10.1136/oem.2010.063677. [DOI] [PubMed] [Google Scholar]
- Burt S, Deddens JA, Crombie K, Jin Y, Wurzelbacher S, Ramsey J. A prospective study of carpal tunnel syndrome: workplace and individual risk factors. Occupational and environmental medicine. 2013;70(8):568–574. doi: 10.1136/oemed-2012-101287. [DOI] [PMC free article] [PubMed] [Google Scholar]
- Chen C-H, Hu YH, Yen TY, Radwin RG. Automated video exposure assessment of repetitive hand activity level for a load transfer task. Human Factors: The Journal of the Human Factors and Ergonomics Society. 2013;55(2):298–308. doi: 10.1177/0018720812458121. [DOI] [PMC free article] [PubMed] [Google Scholar]
- Ebersole ML, Armstrong TJ. Inter-Rater Reliability for Hand Activity Level (HAL) and Force Metrics. Proceedings of the Human Factors and Ergonomics Society Annual Meeting; 2002. pp. 1037–1040. [Google Scholar]
- Ebersole ML, Armstrong TJ. Analysis of an Observational Rating Scale for Repetition, Posture, and Force in Selected Manufacturing Settings. Human Factors: The Journal of the Human Factors and Ergonomics Society. 2006;48(3):487–98. doi: 10.1518/001872006778606912. [DOI] [PubMed] [Google Scholar]
- Franzblau A, Armstrong TJ, Werner RA, Ulin SS. A cross-sectional assessment of the ACGIH TLV for hand activity level. Journal of Occupational Rehabilitation. 2005;15(1):57–67. doi: 10.1007/s10926-005-0874-z. [DOI] [PubMed] [Google Scholar]
- Garg A, Kapellusch J, Hegmann K, Wertsch J, Merryweather A, Deckow-Schaefer G, Malloy EJ and the WISTAH Hand Study Research Team. The Strain Index (SI) and Threshold Limit Value (TLV) for Hand Activity Level (HAL): risk of carpal tunnel syndrome (CTS) in a prospective cohort. Ergonomics. 2012;55(4):396–414. doi: 10.1080/00140139.2011.644328. [DOI] [PubMed] [Google Scholar]
- Gell N, Robert A, Werner RA, Franzblau A, Ulin SS, Armstrong TJ. A Longitudinal Study of Industrial and Clerical Workers: Incidence of Carpal Tunnel Syndrome and Assessment of Risk Factors. Journal of Occupational Rehabilitation. 2005;15(1):47–55. doi: 10.1007/s10926-005-0873-0. [DOI] [PubMed] [Google Scholar]
- Harris C, Eisen EA, Goldberg R, Krause N, Rempel D. 1st place, PREMUS best paper competition: workplace and individual factors in wrist tendinosis among blue-collar workers – the San Francisco study. Scandinavian Journal of Work Environment Health. 2011;37(2):85–98. doi: 10.5271/sjweh.3147. [DOI] [PMC free article] [PubMed] [Google Scholar]
- Kapellusch JM, Garg A, Milwaukee, Hegmann KT, Thiese MS, Malloy EJ. The Strain Index and ACGIH TLV for HAL: Risk of Trigger Digit in the WISTAH Prospective Cohort. Human Factors. 2013 doi: 10.1177/0018720813493115. [DOI] [PubMed] [Google Scholar]
- Latko WA, Armstrong TJ, Foulke JA, Herrin GD, Rabourn RA, Ulin SS. Development and evaluation of an observational method for assessing repetition in hand tasks. American Industrial Hygiene Association Journal. 1997;58(4):278–85. doi: 10.1080/15428119791012793. [DOI] [PubMed] [Google Scholar]
- Latko WA, Armstrong TJ, Franzblau A, Ulin SS, Werner RA, Albers JW. Cross-sectional study of the relationship between repetitive work and the prevalence of upper limb musculoskeletal disorders. American Journal of Industrial Medicine. 1999;36:248–259. doi: 10.1002/(sici)1097-0274(199908)36:2<248::aid-ajim4>3.0.co;2-q. [DOI] [PubMed] [Google Scholar]
- Paulsen R, Schwatka N, Gober J, Gilkey D, Anton D, Gerr F, Rosecrance J. Inter-rater reliability of cyclic and non-cyclic task assessment using the hand activity level in appliance manufacturing. International Journal of Industrial Ergonomics. 2014;44(1):32–38. doi: 10.1016/j.ergon.2013.10.001. [DOI] [PMC free article] [PubMed] [Google Scholar]
- Ratkowsky DA. Handbook of nonlinear regression models. M. Dekker; New York: 1990. [Google Scholar]
- Roquelaure Y, Mechali S, Dano C, Fanello S, Beneffi F, Bureau D, Mariel J, Marfin Y-H, Derriennic F. Occupational and personal risk factors for carpal tunnel syndrome in industrial workers. Scand J Work Environ Health. 1997;23(5):364–369. doi: 10.5271/sjweh.233. [DOI] [PubMed] [Google Scholar]
- Silverstein BA, Fine LJ, Armstrong TJ. Occupational factors and carpal tunnel syndrome. American Journal of Industrial Medicine. 1987;11(3):343–358. doi: 10.1002/ajim.4700110310. [DOI] [PubMed] [Google Scholar]
- Violante FS, Armstrong TJ, Fiorentini C, Graziosi F, Venturi S, Curti S, Zanardi F, Cooke R, Bonfiglioli R, Mattoli S. Carpal tunnel syndrome and manual work: A longitudinal study. Journal of Occupational and Environmental Medicine. 2007;49:1189–1196. doi: 10.1097/JOM.0b013e3181594873. [DOI] [PubMed] [Google Scholar]
- Werner R, Franzblau A, Gell N, Ulin S, Armstrong T. A longitudinal study of industrial and clerical workers: predictors of upper extremity tendonitis. J Occup Rehabil. 15(2005):37–46. doi: 10.1007/s10926-005-0872-1. [DOI] [PubMed] [Google Scholar]
- Wurzelbacher S, Burt S, et al. A comparison of assessment methods of hand activity and force for use in calculating the ACGIH(R) hand activity level (HAL) TLV(R) J Occup Environ Hyg. 2010;7(7):407–416. doi: 10.1080/15459624.2010.481171. [DOI] [PubMed] [Google Scholar]
- Yen TY, Radwin RG. A video-based system for acquiring biomechanical data synchronized with arbitrary events and activities. IEEE Transactions on Biomedical Engineering. 1995;42(9):944–948. doi: 10.1109/10.412663. [DOI] [PubMed] [Google Scholar]


