Abstract
Optical coherence tomography (OCT) is a technique that allows for the three-dimensional imaging of small volumes of tissue (a few millimeters) with high resolution (~10μm). Optical microangiography (OMAG) is a method of processing OCT data, which allows for the extraction of the tissue vasculature with capillary resolution from the OCT images. Cross-sectional B-frame OMAG images present the location of the patent blood vessels; however, the signal-to-noise-ratio (SNR) of these images can be affected by several factors such as the quality of the OCT system and the tissue motion artifact. This background noise can appear in the en face projection view image. In this work we propose to develop a binary mask that can be applied on the cross-sectional B-frame OMAG images, which will reduce the background noise while leaving the signal from the blood vessels intact. The mask is created by using a Naïve Bayes (NB) classification algorithm trained with a gold standard image which is manually segmented by an expert. The masked OMAG images present better contrast for binarizing the image and quantifying the result without the influence of noise. The results are compared with a previously developed frequency rejection filter (FRF) method which is applied on the en face projection view image. It is demonstrated that both the NB and FRF methods provide similar vessel length fractions. The advantage of the NB method is that the results are applicable in 3D, and that its use is not limited to periodic motion artifacts.
1.Introduction
Optical coherence tomography (OCT) is a non-invasive method for providing high resolution (~10μm) and three-dimensional images of microstructures within biological tissues [1]. Optical microangiography (OMAG) is a technique for processing OCT data, which allows the extraction of the three-dimensional microvasculature from the OCT images, with capillary resolution [2]. OMAG has been used in a variety of applications which include tracking wounds [3] and burns [4] in mouse ear, imaging of the human corneo-scleral limbus [5] and human retina [6], studies of mouse brain [7], and others.
The OMAG method consists of analyzing two or more sequential B-frames acquired by the system at the same (or highly overlapping) location but at different time points. When the two OCT B-frames are highly correlated in space, the OMAG images can have high signal-to-noise ratio (SNR). However, when there are system imperfections (such as lack of scanner precision due to galvanometer inaccuracies, and system mechanical jitters) or motion artifacts, the background noise increases; therefore, reducing the SNR. There are several sources of motion artifacts, including the heart beat which has been previously described in the human retina [8] and the esophagus [9].
There have been several techniques developed to minimize the image acquisition sensitivity to background noise and motion artifacts. For example, properly triggering the acquisition based on the heart rate has been demonstrated in other fields such as two-photon fluorescence microscopy [10]. Acquiring a high number of B-frames at the same location and averaging them together may reduce the background noise [11,12]. Also, it is possible to remove the frames that have motion artifacts above a certain threshold [13]. Another approach investigated has been to perform an image registration when there is supra-pixel movement, which allows the correction of the subsequent frame decorrelation [14]. Previous work by other groups have used lateral and axial displacements to minimize the squared difference between adjacent structural B-frames to correct for the bulk motion artifacts [15]. Tracking mechanisms have also been implemented to help align frames that are in motion [16]. Frequency rejection filters (FRF) have also been used to suppress motion artifacts which appear in projection view images [17]. In summary, there are several options that can be used to minimize the effect of the background noise and motion artifacts; however, some of these techniques have required an increased cost (due to the addition of hardware), an increase in total acquisition time, or it is only effective in the 2D en face projection view representation.
The use of supervised classification algorithms for vessel segmentation has been previously used in several imaging modalities such as optical fundus imaging [18], computed tomography [19], MRI [20], and others. However, these imaging methods do not have the high sensitivity to motion artifacts, nor the high resolution present in OMAG images. As a result, new vessel segmentation methods need to be provided to eliminate the motion artifacts, and accurately segment small vessels such as capillaries.
In this study we propose to enhance the SNR by creating a two-dimensional B-frame mask that will filter out the noise while keeping the signal intact. The technique does not require the addition of hardware and does not require increasing the total acquisition time. The proposed method consists of using a supervised machine learning algorithm. Specifically, we use a Naïve Bayes (NB) classifier, which is trained by using a manually segmented B-frame OMAG image from an expert. The NB uses four features obtained from the OMAG and structural images. As a result, the algorithm automatically creates the mask for all the subsequent images. The masked OMAG images are less prone to the background noise when they are segmented (binarized) for image quantification. The results are compared with the FRF method [17], and it is demonstrated that the vessel length fraction (VLF) [21] have similar results. However, the NB method has the advantage that the filter is not limited to the 2D en face projection view visualization, unlike the FRF method.
2. System Setup and Experimental Preparation
2.1 System Setup
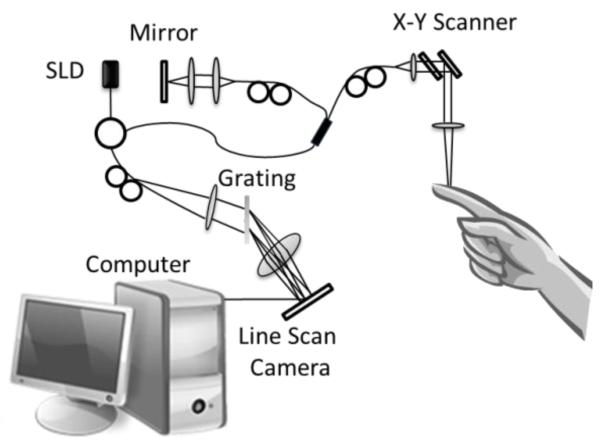
A home-built Fourier domain OCT system was used to image an in vivo sample, as presented in Figure 1. The light for the OCT system is provided by a superluminescent diode (Thorlabs Inc.). The light source has a central wavelength of 1340nm and a full width half maximum (FWHM) of 110nm which provides an axial resolution of ~7 μm in air. The light is divided into two arms. One arm is transmitted to the biological tissue, while the other arm is transmitted to a reference mirror. In the sample arm, the light was directed to a collimating lens, an XY galvanometer and an objective lens. The objective lens has a 10× magnification, and an 18mm focal length, and a NA of 0.11, which provides a lateral resolution of ~7 μm. The light that was reflected from the reference mirror and the biological tissues was combined to produce an interference signal which was detected by a spectrometer and analyzed with a computer. The spectrometer had a spectral resolution of ~0.141 nm and provided an imaging depth of ~3mm at each side of the zero delay line. The spectrometer uses an InGaAs camera (Goodrich Inc.) with an A-scan rate of 92k Hz. The system had a measured dynamic range of 105dB with the light power of 3.5mW at the sample surface. By collecting 400 A-lines per B-frame we obtained a frame rate of 180 fps. The smallest blood flow velocity that can be measured is ~4μm/s [22].
Figure 1.
Schematic diagram of the Fourier domain optical coherence tomography system. An index finger is used as a sample.
2.2 Human Preparation
Images were obtained from the middle phalanx of the index finger of a human volunteer. The finger was wiped down with alcohol before imaging to avoid any dirt or sweat to affect the images. Finally a few drops of oil were applied to minimize the specular reflection at the surface of the finger.
2.3 Scanning Protocol
The scanning protocol was based on the ultrahigh sensitive OMAG method [23]. The x-scanner (fast) was controlled by using a saw tooth function, while the y-scanner (slow) was controlled by a step function. Both scanners imaged a range of 2.5×2.5 mm2 through the sample. Each B-scan contained 400 A-lines, there were 400 positions in the slow-direction (C-scan), and at each position 5 B-frames were acquired. The whole 3D image was acquired within ~11 seconds.
3. Methodology
3.1 Optical microangiography
OMAG extracts the location of blood vessels in three-dimensional space without using contrast agents [2,22,24]. The movement of cells within the blood vessels is the contrast for OMAG imaging.
The OMAG method can be applied in either the fast or slow axis. When OMAG is used in the fast axis, it is sensitive to the fast blood flow rate which is commonly found in the large vessels. On the other hand, when OMAG is applied on the slow axis, it is sensitive to the fast and slow blood flow rate. In this study, we applied OMAG in the slow axis to be more sensitive to the vessels with slow flow, such as the capillaries.
The data analyzed from the camera can be expressed as:
| (1) |
where k is the wavenumber (2π/λ), λ is the wavelength of the light, t is the time point when the data is captured, ER is the light reflected from the reference mirror, S(k) is the spectral density of the light source, n in the tissues index of refraction, z is the depth position, a(z,t) is the amplitude of the back scattered light, v is the velocity of the moving blood cells located at depth z1. We do not consider the offset nor the self cross-correlation between the light backscattered within the sample given its weak signal.
The depth information (I(t,z)) is obtained by calculating the Fourier transform (FT) of the spectrum. The result provides a complex term that contains a magnitude (M(t,z)) and a phase (φ(t,z)), given by:
| (2) |
OMAG uses high pass filtering to isolate the high frequency signal (moving particles) from the low frequency signal (static tissue), based on the properties of applying a Fourier transform to a derivative. The proposed approach is to take a differential operation across the slow-axis:
| (3) |
where i represents the index of the B-scan and N is the total number of frames that are averaged together. For this study N is equal to 4, given that 5 B-frames were acquired and two adjacent frames provide one OMAG frame.
3.2 Naïve Bayes Mask
The objective of this work is to create a B-frame mask that can separate the background noise from the signal on OMAG images. The mask can be created in several ways. For example, shape model based procedures have been previously used to segments blood vessels from cross-sectional OCT images [25]. Also, the mask can be created manually; however, this can prove to be very tedious and time consuming. As a result we propose to develop an automatic method for creating the mask using a machine learning supervised method, the Naïve Bayes method. Nevertheless, this algorithm requires to be trained; therefore, it is required to have a few “gold standard” images. In our case we used four manually segmented images as our reference.
The goal is to classify each pixel within an OMAG B-frame as a vessel or non-vessel. The Bayes rule derives the posterior probability as a consequence of two phenomena, a prior probability and a likelihood function derived from a probability model for the data to be observed. Bayes rule is given by:
| (4) |
where X is the evidence or the features and Y is the outcome (in our case 1 for vessel and 0 for non-vessel), P(Y) is the prior probability (the probability of Y before X is observed), P(Y|X) is the posterior probability (the probability of Y given X is observed), P(X|Y) is the likelihood (the probability of observing X given Y), and P(X) is the marginal likelihood (the probability of the features X).
A condition for Bayes rule is that the features represented in X be independent. Several possible features and combination of features were analyzed. The best feature combination was selected which consisted of four features: (i) the average of the flow pixel value, (ii) the standard deviation of the flow pixel value, (iii) the average of the structure pixel value, and (iv) the axial derivative of the flow. A 5×5 window was created around each pixel in the B-frame image. The average and standard deviation of those 25 points were calculated on the flow image which were the inputs for the feature (i) and (ii), respectively. Also the average of the 5×5 window applied on the structural image was used as feature (iii). Finally, the derivative of the flow image was calculated in the z-direction (axial), and this value was used as feature (iv). The four feature values are independent of each other and have a correlation coefficient close to 0. In summary, the matrix X contained four columns (one column per feature), and the number of rows was equivalent as the total number of pixels in the image whose structural value was above a certain threshold. Vector Y contained one column (with 1’s and 0s’), and the number of rows was equivalent as the total number of pixels in the image whose structural value was above a certain threshold. The structural threshold was determined to be 10dB above the noise. The values below the threshold were removed because those pixels do not contain clearly discernible blood vessels. Consequently, by removing those pixels we reduce the possibility of having bias in the data set.
3.3 Training Samples
The NB classifier is a supervised learning method which requires training. To train a classifier method it is necessary to obtain labelled data. In this case there are two labels (0 = non-vessel, and 1 = vessel). To obtain labelled data, an expert was recruited to manually segment several frames with different background noise levels. The manually segmented data is considered the absolute truth, and the goal of the NB classifier is to be able to reproduce as closely as possible the manually segmented image.
Each B-frame was first classified by the amount of background noise present in the image. The level of background noise was determined by providing a histogram of the whole image which included the areas of the image where the structural image intensity was 10dB above the noise level. The location of the peak of the histogram was used as the estimate of the level of background noise. The lower value for the location of the peak indicates a lower background noise.
We empirically estimated that there are four levels of background noise. Each frame was assigned to one of the background noise levels based on the location of the peak of the histogram. There were four manually segmented training images (one for each background noise level). The four images were used to train four NB classifiers. Finally vector Y for each image was predicted using the NB classifier that contained its same background noise level.
To estimate Y we calculated P(1|X) and P(0|X) from Eq. (4). The sum of those two values is equal to 1. If P(1|X) was greater than P(0|X), then Y was set to 1 (a vessel). Otherwise, Y was set to 0 (a non-vessel).
3.4 Frequency Rejection Filter
The previously described FRF method [17] was also applied on the en face projection view image to remove the stripe motion artifacts, and the results were compared with the proposed NB method. Briefly, a filter (F(u,v)) is created as described in:
| (5) |
The filter is multiplied by the Fourier transform of the 2D en face projection view image, and the result is inverse Fourier transformed. For this application we used α = 0.35.
4. Experimental Results
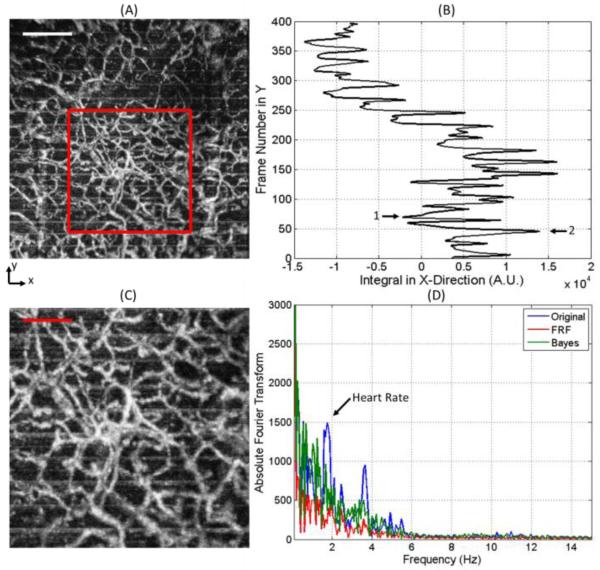
In Figure 2(A) we present the en face projection view of the sample angiography obtained using the OMAG method, and the image within the red box is presented in Figure 2(C). Within the image, the presence of horizontal lines (in the x-direction) is observed periodically at several vertical (in the y-direction) locations. If we integrate the image in the horizontal direction, we obtain the plot in Figure 2(B). This image presents a view of the frames where the peaks that occur periodically (every time there is a bulk motion artifact) are located. Figure 2(D) presents the Fourier transform of Figure 2(B), in the blue line. A peak is observed at a frequency which can be attributed to the heart rate of the subject.
Figure 2.
A) En face maximum projection view image of the sample. Scale bar is 500μm. (B) Integration of the image observed in (A) in the x-direction. (C) Zoom image indicated by red box in (A). Scale bar is 250μm. (D) Blue line is the Fourier Transform of the signal presented in (B) indicating the heart rate peak. Red and green line is the Fourier Transform of the signal after the FRF method and Bayes mask was applied, respectively.
An example for different levels of background noise is presented in Figure 3, where we observe the B-frame cross-sectional images obtained from two frame locations indicated by arrows 1 and 2 of Figure 2(B). Figure 3(A) is an image that presents lower background noise compared to its counterpart in Figure 3(B). Given the high background noise observed in Figure 3(B), the maximum projection view cannot distinguish the signal from the noise; therefore, resembling a horizontal line, as observed periodically in Figure 2(A). However, it is important to note that although the signal to noise ratio is reduced, the vessels can still be observed in the cross-sectional image.
Figure 3.
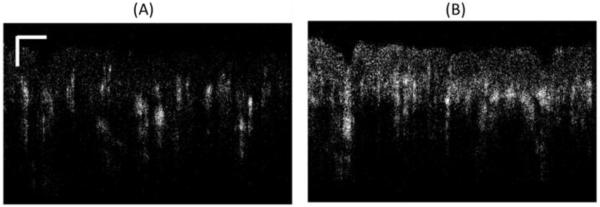
(A) Cross-sectional flow image with low background noise indicated by Arrow 1 in Figure 2(B). Scale bar is 250μm. (B) Cross-sectional flow image with high background noise indicated by Arrow 2 in Figure 2(B).
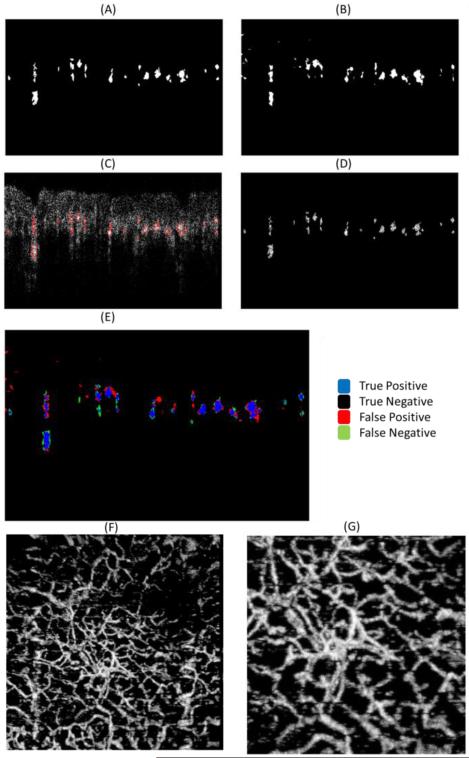
The B-frame mask method works by applying a mask on the cross-sectional image in such a way that the noise is minimized, while maintaining the signal from the vessels intact. Figure 4(A) is an example of a mask from Figure 3(B) which was created manually by an expert. Figure 4(C) overlaps the manually segmented mask (red circles) over Figure 3(B), and finally Figure 4(D) is the resulting image after multiplying the mask by the OMAG frame. The majority of the noise has been reduced to a value of zero, and the signal from the vessels remained unchanged.
Figure 4.
(A) Vessel mask of Figure 3(B) using manual segmentation. (B) Vessel mask predicted using the Naïve Bayes classifier. (C) Overlap of Figure 3(B) with the manually segmented mask in (A). (D) Background reduced cross-sectional image obtained by multiplying Figure 3(B) with the manually segmented mask in (A). (E) Overlap of (A) and (B) indicating the True Positives, True Negatives, False Positives and False Negatives. (F) En face maximum projection view image of the sample after applying the Naïve Bayes mask on each B-frame. (G) Zoom image from (F). The area is the same as indicated by red box in Figure 2(A).
The process of manually segmenting a B-frame is time consuming and can be prone to errors based on the skills of the expert. However, the manually segmented frame was considered as the “gold standard” for this application. Four B-frames with four different background noise levels were manually segmented to create the training set. As a result, four Naïve Bayes algorithms were trained with each of those images. Similarly, eight frames from each noise level (total of 32 frames) were manually segmented for cross-validation purposes. Figure 4(A) is one of the cross-validation images. After training the Naïve Bayes classifier, the algorithm was used to predict the Bayes mask, and the outcome is observed in Figure 4(B). Figure 4(E) presents an overlap of Figure 4(A) and Figure 4(B). The blue pixels indicate the location of white pixels (vessels) in both the manual and Bayes mask, also known as true positives. The black pixels indicate the location of black pixels (non-vessels) in both the manual and Bayes mask, also known as true negatives. The red pixels indicate the location of black pixels in the manual mask and white pixels in the Bayes mask, also known as false positives. Finally, the green pixels indicate the location of white pixels in the manual mask and black pixels in the Bayes mask, also known as false negatives. Using this data we can estimate the sensitivity (Se), specificity (Sp), positive predictive value (PPV) and negative predictive value (NPV) of the algorithm.
For all the cross-validation images (eight for each background noise level) the sensitivity (Se), specificity (Sp), positive predictive value (PPV) and negative predictive value (NPV) were calculated and presented in Table 1. The expert manually segmented the images with the highest background noise a second time to determine the variation within the same expert, which is presented in Table 1.
Table 1.
Sensitivity (Se), Specificity(Sp), Positive Predictive Value (PPV) and Negative Predictive Value (NPV) obtained from the cross-validation images for each noise level, as well as the manual segmentation for the highest level of noise.
| Noise Level | Se | Sp | PPV | NPV |
|---|---|---|---|---|
| 1 (Lowest) | 94.05 | 97.91 | 68.6 | 99.71 |
| 2 | 93.8 | 98.9 | 67.76 | 99.91 |
| 3 | 86.16 | 98.75 | 70.03 | 99.2 |
| 4 (Highest) | 85.05 | 99.08 | 68.18 | 99.09 |
|
| ||||
| Manual (Highest) | 95.03 | 99.03 | 74.05 | 99.31 |
Figure 4(F), presents the maximum projection view of the sample image after each B-frame was filtered with the mask, and Figure 4(G) is a zoomed version. Two things can be noticed: (1) the background noise is highly reduced, and (2) the horizontal lines due to the motion artifact has been either eliminated or strongly suppressed when compared to Figure 2(A).
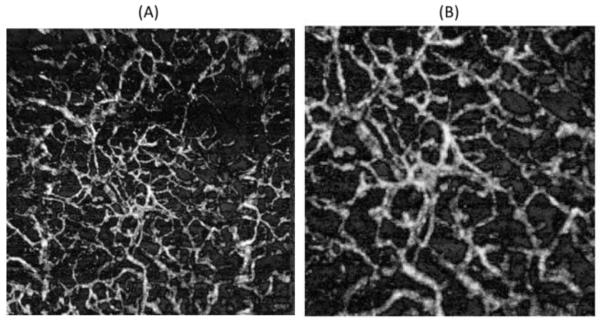
Figure 5(A) presents the en face projection view image obtained after applying the FRF on the original image in Figure 2(A), and Figure 5(B) is a zoomed version. If Figure 4(F) and Figure 5(A) are integrated in the x-direction and we calculate its Fourier transform, we obtain the green and red curves displayed in Figure 2(D), respectively. It can be observed that the heart rate peak and its harmonics have been significantly reduced, indicating that the bulk motion artifacts have been diminished.
Figure 5.
(A) En face projection view image obtained after applying the frequency rejection filter method. (B) Zoom image from (A). The area is the same as indicated by red box in Figure 2(A).
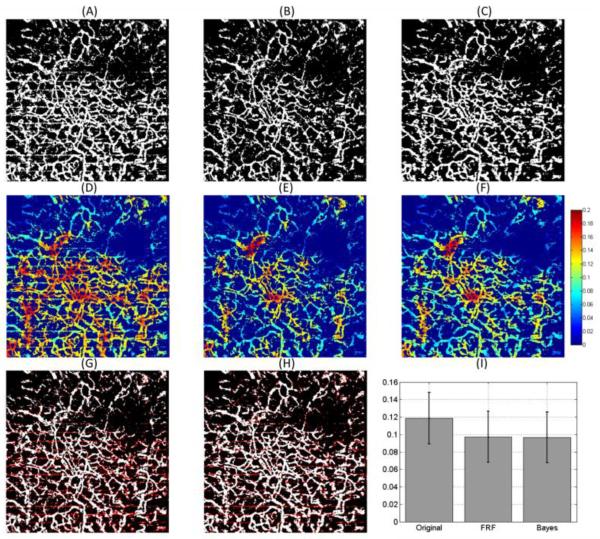
The objective of reducing the background noise on the projection view images is to be able to accurately quantify several parameters such as the vessel area density, vessel length fraction and fractal dimension [21]. The quantification of these images is usually done on its binary representation. Figure 6(A), Figure 6(B) and Figure 6(C) present the binary depiction of Figure 2(A) (original image), Figure 5(A) (FRF image) and Figure 4(F) (Bayes mask image), respectively. The binarization method has been previously described [21]. Figure 6(B) and (C) do not display the horizontal lines that are erroneously picked up as vessels in Figure 6(A). This can be better visualized in Figure 6(G) and (H) which depicts the overlap of Figure 6(A) and (B), and Figure 6(A) and (C), respectively. In these images the white pixels observed in both images appear in white, and the white pixels that only appear in Figure 6(A) appear in red.
Figure 6.
(A) Binary representation of Figure 2(A). (B) Binary representation of Figure 5(A). (C) Binary representation of Figure 4(F). (D) Vessel length fraction calculated from (A). (E) Vessel length fraction calculated from (B). (F) Vessel length fraction calculated from (C). (G) Overlap of (A) and (B). (H) Overlap of (A) and (C). The white pixels indicate the pixels that appear in both images and the red pixels are the white pixels that appear in (A) but not in (B) or (C). (I) Mean and standard deviation of the vessel length fraction calculated in (D), (E) and (F).
The binary image representation of the vessels is usually used for quantification purposes. In this work we quantified the vessel length fraction as previously described [21]. Figure 6(D), (E) and (F) present the map of the vessel length fraction from Figure 6(A), (B) and (C), respectively. Visually, it can be observed that the vessel length fraction from the FRF and Bayes mask images agree with each other; and disagree with the original image. This is explained by the fact that the binarization of the original image selects the stripe motion artifacts as vessels; while they are removed in the FRF and Bayes mask method. To further quantify these results; Figure 6(I) presents the mean and standard deviation of the vessel length fraction from Figure 6(D), (E) and (F). Quantitatively we validate that in average, the vessel length fraction of the FRF and Bayes mask are similar.
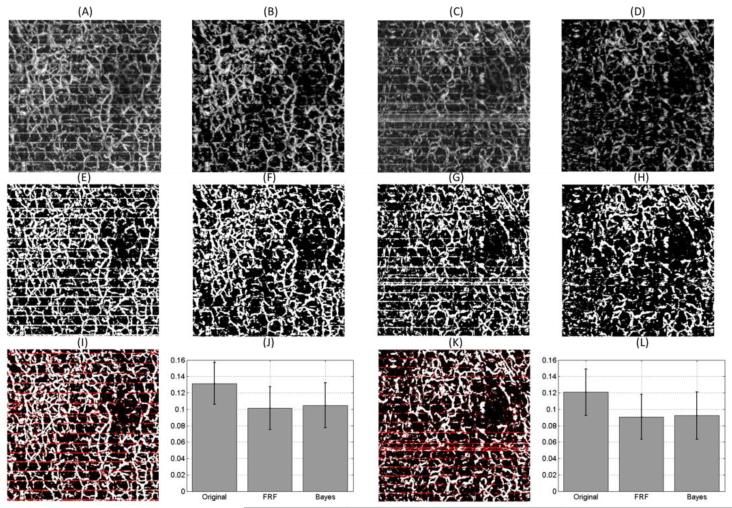
Finally, the same methodology was applied on two new images which present motion artifacts. New NB masks were created for each of the new image. The images are shown in Figure 7 (A) and (C), and after applying the NB method, we obtain the images in Figure 7 (B) and (D), respectively. Their binary representation is shown in Figure 7(E) through (H). Figure 7(I) and (K) shows the overlap of the original and NB masked method. It can be easily shown that the horizontal stripes are filtered out by the NB mask. Finally, we show the vessel length fraction calculation for the original, FRF (images are not shown) and NB method in Figure 7(J) and (L). The vessel length fractions between the NB and FRF methods have similar values, but differ from the original image.
Figure 7.
(A) and (C) are two new en face maximum projection view images which present clear motion artifacts. (B) and (D) are the results of (A) and (C), respectively after applying the Naïve Bayes mask. (E), (F), (G) and (H) are the binary representations of (A), (B), (C) and (D), respectively. (I) Overlap of (E) and (F). The white pixels indicate the pixels that appear in both images and the red pixels are the white pixels that appear in (E) but not in (F). (J) Mean and standard deviation of the vessel length fraction calculated for the original (A), FRF (image not shown) and Bayes image (B). (K) Overlap of (G) and (H). The white pixels indicate the pixels that appear in both images and the red pixels are the white pixels that appear in (G) but not in (H). (L) Mean and standard deviation of the vessel length fraction calculated for the original (C), FRF (image not shown) and Bayes image (D).
5. Discussion
The proposed method consists of training a NB classifier algorithm to predict the vessel locations on a cross-sectional OMAG frame. This prediction can be used as a mask to suppress some of the background noise present in OMAG images. This method requires training with a “gold standard” dataset. The training images are produced by an expert who manually segments a few B-frames. The requirement of a user to manually segment a few frames is a drawback of this method. However, once the training is done, the algorithm to predict the vessels is fast. The OMAG processing time was increased by ~1.5% with the addition of the NB prediction algorithm.
Future areas of exploration may involve testing other supervised learning algorithm that would improve the Se, Sp, PPV and NPV. Similarly, unsupervised learning methodologies could be beneficial since they would not require an expert to manually segment the data for training purposes. Also, an opportunity could arise where a methodology trained with one data set could be applicable on other data sets obtained from different image qualities, system resolutions, and samples. Finally, other features could be included in the algorithms to improve their performance.
It is important to notice that the manually created “gold standard” image is not perfect, given that the expert will not be completely consistent on determining which pixels are vessels as presented in Table 1. Also, the Se, Sp and NPV were high for all noise levels, as demonstrated in Figure 4(E) and Table 1, demonstrating that the algorithm produces similar results to the manual segmentation. The Se decreases as the background noise level increases. There are opportunities to improve the algorithm to increase the PPV. The method is valid given that after the mask is applied, a maximum projection view is used in the axial direction. As long as most of the noise has been eliminated, the outcome of the projection view is acceptable.
It is important to mention that this method is only valid on images where the signal can still be distinguished from the noise. In other words, even on the lowest SNR images, an expert should be capable of estimating the location of the vessels.
From Figure 2(D) we note that in this case the motion artifact is periodic. After applying the NB mask or FRF, we remove the heart rate peaks. A possible limitation of the FRF method is that it may not be applicable for removing non-periodic bulk motion artifacts. Therefore, the proposed Bayes method has the advantage of being applicable in images with periodic and non-periodic motion artifacts.
The calculation of the vessel length fraction is similar for both the Bayes and FRF method. However, these values are different from the ones calculated from the original image. This is because the Bayes and FRF method have removed the motion artifacts which are incorrectly assigned as vessels in the original image.
FRF is a method applied on the 2D projection view image; however, it is not helpful when there is interest in observing the 3D representation of the image. However, the NB method is applied on the B-frame; therefore, its effects are beneficial for the 2D and 3D representation of the image.
The method was also demonstrated to work on two new images as shown in Figure 7. The results indicate the same conclusions; therefore, further validating the methodology.
Finally, this method may be combined with other techniques (such as a non-averaged OMAG method) to reduce its total acquisition time [12].
6. Conclusions
In this work we present a method for reducing the background noise and motion artifacts from OMAG images. The method consists of producing a B-frame mask that is used to suppress the background signal. The mask is automatically produced by using a NB classifier algorithm which is trained with a manually segmented mask by using four features. The algorithm produces results that have a high sensitivity, specificity and negative predictive value compared to a manual segmentation standard. The maximum projection view image after applying the mask has significantly less background noise and motion artifacts compared to the original image. Finally the binarization of the image after using the mask has the advantage of not picking up non-vessels in the image, such as the periodic stripes in the horizontal direction observed on the original image; therefore, allowing for a more realistic quantification of the data. The results were compared to a frequency rejection filter method and the vessel length fraction calculated was similar.
Acknowledgements
This work was supported in part by research grants from the National Institutes of Health (Grant Nos. R01HL093140, R01EB009682, and R01DC010201). The content is solely the responsibility of the authors and does not necessarily represent the official views of grant-giving bodies.
Footnotes
OCIS codes: (170.4500) Optical coherence tomography; (100.4993) Pattern recognition, Bayesian processing. http://dx.doi/org/10.1364/AO.99.099999
References
- 1.Huang D, Swanson E, Lin C, Schuman J, Stinson W, Chang W, Hee M, Flotte T, Gregory K, Puliafito C. Optical coherence tomography. Science. 1991;254:1178–1181. doi: 10.1126/science.1957169. al. et. 80- [DOI] [PMC free article] [PubMed] [Google Scholar]
- 2.Wang RK, Jacques SL, Ma Z, Hurst S, Hanson SR, Gruber A. Three dimensional optical angiography. Opt. Express. 2007;15:4083. doi: 10.1364/oe.15.004083. [DOI] [PubMed] [Google Scholar]
- 3.Jung Y, Dziennis S, Zhi Z, Reif R, Zheng Y, Wang RK. Tracking Dynamic Microvascular Changes during Healing after Complete Biopsy Punch on the Mouse Pinna Using Optical Microangiography. PLoS One. 2013;8:e57976. doi: 10.1371/journal.pone.0057976. [DOI] [PMC free article] [PubMed] [Google Scholar]
- 4.Qin J, Reif R, Zhi Z, Dziennis S, Wang R. Hemodynamic and morphological vasculature response to a burn monitored using a combined dual-wavelength laser speckle and optical microangiography imaging system. Biomed. Opt. Express. 2012;3:455–66. doi: 10.1364/BOE.3.000455. [DOI] [PMC free article] [PubMed] [Google Scholar]
- 5.Li P, An L, Reif R, Shen TT, Johnstone M, Wang RK. In vivo microstructural and microvascular imaging of the human corneo-scleral limbus using optical coherence tomography. Biomed. Opt. Express. 2011;2:3109–18. doi: 10.1364/BOE.2.003109. [DOI] [PMC free article] [PubMed] [Google Scholar]
- 6.An L, Wang RK. In vivo volumetric imaging of vascular perfusion within human retina and choroids with optical micro-angiography. Opt. Express. 2008;16:11438. doi: 10.1364/oe.16.011438. [DOI] [PubMed] [Google Scholar]
- 7.Jia Y, Li P, Wang RK. Optical microangiography provides an ability to monitor responses of cerebral microcirculation to hypoxia and hyperoxia in mice. J. Biomed. Opt. 2011;16:096019. doi: 10.1117/1.3625238. [DOI] [PMC free article] [PubMed] [Google Scholar]
- 8.de Kinkelder R, Kalkman J, Faber DJ, Schraa O, Kok PHB, Verbraak FD, van Leeuwen TG. Heartbeat-induced axial motion artifacts in optical coherence tomography measurements of the retina. Invest. Ophthalmol. Vis. Sci. 2011;52:3908–13. doi: 10.1167/iovs.10-6738. [DOI] [PubMed] [Google Scholar]
- 9.Kang W, Wang H, Wang Z, Jenkins MW, Isenberg GA, Chak A, Rollins AM. Motion artifacts associated with in vivo endoscopic OCT images of the esophagus. Opt. Express. 2011;19:20722–35. doi: 10.1364/OE.19.020722. [DOI] [PMC free article] [PubMed] [Google Scholar]
- 10.Paukert M, Bergles DE. Reduction of motion artifacts during in vivo two-photon imaging of brain through heartbeat triggered scanning. J. Physiol. 2012;590:2955–63. doi: 10.1113/jphysiol.2012.228114. [DOI] [PMC free article] [PubMed] [Google Scholar]
- 11.Yousefi S, Qin J, Zhi Z, Wang RK. Uniform enhancement of optical micro-angiography images using Rayleigh contrast-limited adaptive histogram equalization. Quant. Imaging Med. Surg. 2013;3:5–17. doi: 10.3978/j.issn.2223-4292.2013.01.01. [DOI] [PMC free article] [PubMed] [Google Scholar]
- 12.Reif R, Yousefi S, Choi WJ, Wang RK. Analysis of cross-sectional image filters for evaluating nonaveraged optical microangiography images. Appl. Opt. 2014;53:806–815. doi: 10.1364/AO.53.000806. [DOI] [PMC free article] [PubMed] [Google Scholar]
- 13.Jia Y, Tan O, Tokayer J, Potsaid B, Wang Y, Liu JJ, Kraus MF, Subhash H, Fujimoto JG, Hornegger J, Huang D. Split-spectrum amplitude-decorrelation angiography with optical coherence tomography. Opt. Express. 2012;20:4710. doi: 10.1364/OE.20.004710. [DOI] [PMC free article] [PubMed] [Google Scholar]
- 14.Hendargo H, Estrada R, Chiu S, Tomasi C, Farsiu S, Izatt J. Image Registration for Motion Artifact Removal in Retinal Vascular Imaging Using Speckle Variance Fourier Domain Optical Coherence Tomography. ARVO Meet. Abstr. 2013;54:5528. [Google Scholar]
- 15.Watanabe Y, Takahashi Y, Numazawa H. Graphics processing unit accelerated intensity-based optical coherence tomography angiography using differential frames with real-time motion correction. J. Biomed. Opt. 2014;19:021105. doi: 10.1117/1.JBO.19.2.021105. [DOI] [PubMed] [Google Scholar]
- 16.Unterhuber A, Povazay B, Müller A, Jensen OB, Duelk M, Le T, Petersen PM, Velez C, Esmaeelpour M, Andersen PE, Drexler W. Simultaneous dual wavelength eye-tracked ultrahigh resolution retinal and choroidal optical coherence tomography. Opt. Lett. 2013;38:4312–5. doi: 10.1364/OL.38.004312. [DOI] [PubMed] [Google Scholar]
- 17.Liu G, Wang R. Stripe motion artifact suppression in phase-resolved OCT blood flow images of the human eyebased on the frequency rejection filter. Chin. Opt. Lett. 2013;11:031701. [Google Scholar]
- 18.Soares JVB, Leandro JJG, Cesar RM, Jelinek HF, Cree MJ. Retinal vessel segmentation using the 2-D Gabor wavelet and supervised classification. IEEE Trans. Med. Imaging. 2006;25:1214–1222. doi: 10.1109/tmi.2006.879967. [DOI] [PubMed] [Google Scholar]
- 19.Xu Y, Sonka M, McLennan G, Guo J, Hoffman EA. MDCT-based 3-D texture classification of emphysema and early smoking related lung pathologies. IEEE Trans. Med. Imaging. 2006;25:464–75. doi: 10.1109/TMI.2006.870889. [DOI] [PubMed] [Google Scholar]
- 20.Z F, Xie X. An Overview of Interactive Medical Image Segmentation. http://www.bmva.org/annals/2013/2013-0007.pdf.
- 21.Reif R, Qin J, An L, Zhi Z, Dziennis S, Wang RK. Quantifying optical microangiography images obtained from a spectral domain optical coherence tomography system. Int. J. Biomed. Imaging. 2012:509783. doi: 10.1155/2012/509783. [DOI] [PMC free article] [PubMed] [Google Scholar]
- 22.An L, Qin J, Wang RK. Ultrahigh sensitive optical microangiography for in vivo imaging of microcirculations within human skin tissue beds. Opt. Express. 2010;18:8220–8228. doi: 10.1364/OE.18.008220. [DOI] [PMC free article] [PubMed] [Google Scholar]
- 23.Wang RK, An L, Francis P, Wilson DJ. Depth-resolved imaging of capillary networks in retina and choroid using ultrahigh sensitive optical microangiography. Opt. Lett. 2010;35:1467. doi: 10.1364/OL.35.001467. [DOI] [PMC free article] [PubMed] [Google Scholar]
- 24.Reif R, Wang RK. Label-free imaging of blood vessel morphology with capillary resolution using optical microangiography. Quant. Imaging Med. Surg. 2012;2:207–212. doi: 10.3978/j.issn.2223-4292.2012.08.01. [DOI] [PMC free article] [PubMed] [Google Scholar]
- 25.Pilch M, Wenner Y, Strohmayr E, Preising M, Friedburg C, Meyer Zu Bexten E, Lorenz B, Stieger K. Automated segmentation of retinal blood vessels in spectral domain optical coherence tomography scans. Biomed. Opt. Express. 2012;3:1478–91. doi: 10.1364/BOE.3.001478. [DOI] [PMC free article] [PubMed] [Google Scholar]


