



Abstract
Objectives.
Sex hormones affect physical, mental, and social health, yet their role in mediating social effects on aging is understudied. To facilitate such analyses with the National Social Life, Health & Aging Project Wave 2, we summarize the conceptual background, collection protocols, laboratory assays, and data analysis strategies for biologically active (free) levels of testosterone, estradiol, progesterone, and dehydroepiandrosterone (DHEA).
Method.
Saliva from passive drool was collected from returning Wave 1 respondents and non-respondents as well as their partners during an in-home interview. Specimens were frozen and sent to Dresden LabService GmbH for duplicate assays of biologically active steroids using identical assay kits from National Social Life, Health, and Aging Project (NSHAP) Wave 1 (SaliCap, Catalog No. RE69995). Overall, 2,772 testosterone, 2,504 estradiol, 2,714 progesterone, and 2,800 DHEA measurements are publically available for Wave 2 analyses. Through a series of weighted linear regressions, all 4 steroids are compared by gender and age and to Wave 1 measurements.
Results.
Men had higher levels of both free testosterone and progesterone than women; women and men had the same levels of estradiol and DHEA. Both free testosterone and DHEA decreased with age. We also found significant wave effects for all 4 sex hormones.
Conclusion.
NSHAP Waves 1 and 2 are the first U.S. probability sample studies to measure these 4 salivary sex hormones simultaneously, providing individual profiles 5 years apart. Wave 2 data demonstrate differences by gender and trends by age that are similar to those found in other saliva-based and serum-based studies of free steroid levels. The differences between waves arising from the change in assay laboratory need to be adjusted in future longitudinal analyses using NSHAP Wave 1 and Wave 2 steroid data.
Key Words: DHEA, Estradiol, Progesterone, Saliva collection, Sex hormones, Testosterone.
The National Social Life, Health, and Aging Project (NSHAP) is a longitudinal, population-based study of the health, behavior, and social lives of older Americans. Two waves have been completed to date, Wave 1 in 2006 and Wave 2 in 2011 (O’Doherty et al., 2014). Although other large national studies have assessed aspects of physical health, psychological states, and social lives of older Americans, such as the Health & Retirement Study (HRS, 1992-2012) and the National Health and Nutrition Examination Study (Centers for Disease Control and Prevention [CDC], 2014), NSHAP combines uniquely detailed measures in all three domains. This article focuses on the steroid hormones associated with psychosocial measures, ranging from social networks to the emotional and sexual relationships of intimate partners as well as health at older ages, including frailty, cognition, and major causes of morbidity and mortality. NSHAP is the first nationally representative survey to measure simultaneously four reproductive steroids: testosterone, dehydroepiandrosterone (DHEA), estradiol, and progesterone. These hormones are also important for the study of sex differences in behavior and physiology during aging.
NSHAP obtains a saliva sample because it contains only the metabolically active form of steroids. Steroid hormones are carried in the blood bound to a protein (sex hormone-binding globulin [SHBG], albumin, and transcortin), rendering them metabolically inactive with only a small portion that is unbound and “free” to enter cells of diverse systems throughout the body. Only the free portion makes its way into saliva, making salivary steroid levels lower than total serum or plasma levels and a theoretically valid indicator of biologically active steroid levels (Dabbs, 1990; Dabbs & Mohammed, 1992; Gavrilova & Lindau, 2009). We will be discussing the conceptual background, collection, laboratory assays, and data analysis of all four steroid hormones.
To test both the internal and external validity of our findings, we compare our Wave 2 results to those already obtained in Wave 1 as well as other smaller-scale studies that have employed salivary enzyme immunoassays. Our goal is to provide a comprehensive report, building on Wave 1 (Gavrilova and Lindau, 2009) with the technical details and interpretation guidelines for Wave 2 and longitudinal analyses. We aim to provide a reference to be cited by multidisciplinary analysts using these steroid data to address a variety of questions about their role in the interplay among social life, psychological condition, and health during the aging process.
Testosterone
Testosterone is the principle male reproductive hormone, playing not only the primary role in physical masculine development but is also central for health, energetic, and overall well-being in men (Bassil, Alkaade, & Morley, 2009) and male behavior and personality (Zak et al., 2009). And although there is a natural decrease with age in testosterone and its precursors produced by the testes and adrenals, it can be accelerated by chronic illness, obesity, excessive drinking, and other conditions that affect overall physical health and quality of life (Feldman et al., 2002). And in turn, significant decreases in testosterone can exacerbate these conditions as well as lead to loss of libido and chronic depression (Kraemer et al., 1976; Roney, Mahler, & Maestripieri, 2003). Although testosterone levels in women also decrease with age due to an age-related decrease in secretion from the ovary and precursors from the adrenal, further research is needed to fully elucidate testosterone’s role, as it influences quality-of-life measures such as general well-being and mood as well as the restoration of sexual desire after menopause (Davis & Tran, 2001). Further, although androgen replacement therapy (ART) in later life is becoming increasingly common among men, it remains unclear at what age and stage it becomes most appropriate and carries with it the least amount of cardiovascular risk (American Society of Andrology, 2006).
Estradiol
Estradiol (E2) is the only biologically potent steroid of the three estrogens secreted by the ovary and is also produced by fat cells, particularly visceral fat (Nelson and Bulun, 2001; Yamatani, Takahashi, Yoshida, Takata, & Kurachi, 2013). It is responsible for the development of sex characteristics in women during growth and development and, with progesterone, plays a key role during the luteal phase of the menstrual cycle in preparing the endometrium for implantation (Hall & Anthony, 1993). In women (and with findings in men proving inconclusive), low estradiol in later life has been associated with mental and physical deterioration such as memory loss and decreases in cognition and osteoporosis (Yaffe et al., 2007). Low estradiol levels are also linked to decreases in sexual function, whereas high levels of estradiol have been linked to postmenopausal breast cancer (Key, Appleby, Barnes, & Reeves, 2002).
Although estradiol has been shown to remain relatively stable throughout the life course in men, there is a natural and substantial decrease in estradiol in women after menopause, with male and female levels approximately equal in later life (ZRT Laboratory, LLC, 2007). Hormone therapy of estradiol is not uncommon (in NSHAP Wave 1, approximately 4% of women were documented using estradiol in hormone therapy), but its overall beneficial effects have come into question in recent years, as the cardiovascular and malignancy risks of hormone therapy are believed to outweigh the benefits (Barnabei et al., 2005).
Progesterone
Commonly called the “hormone of pregnancy,” progesterone plays several key roles throughout the human gestation period, including uterine development, inhibition of lactation during pregnancy, increasing milk production after labor, and, possibly, facilitating the onset of labor (Schumacher et al., 2004). Peaking during pregnancy and in the luteal phase of the menstrual cycle, levels in women and men are otherwise approximately equal (Oettel & Mukhopadhyay, 2004). Depending on the specific tissue, progesterone can either counteract estrogen activity, such as thinning the vaginal wall, or act synergistically to regulate pain.
Although progesterone is produced by both men and women, its function and physiological importance in men is not entirely understood. Via research on progesterone and its possible relationship with cortisol, increased progesterone levels are likely to occur during periods of increased stress, suggesting an adrenal activation or a mechanism to counteract the effects of anxiety. Although this has been found in both sexes, the relationship with cortisol may be especially strong in men (Wirth, Meier, Fredrickson, & Schultheiss, 2007). Although further research is needed to understand the neuroendocrine mechanisms of natural progesterone in men, exogenous progesterone has been associated with the modulation or reduction of male sexual behavior in both human and animal research, thereby providing possible insights into future research on male sexual dysfunction (Andersen & Tufik, 2006).
Dehydroepiandrosterone
DHEA is a prohormone secreted by the adrenal glands and gonads in both sexes. It can be generally classified as a sex hormone because of its influence on sexual physiology in both men and women (Labrie et al., 2005) and also binds at a variety of receptors regulating diverse physiological systems potentially involved in the morbidity of aging (Webb, Geoghegan, Prough, & Miller, 2006). DHEA and its biologically inactive excretory product, DHEA-S, steadily decrease with age in both sexes, and low levels have been linked to numerous pathologies including cardiovascular disease, rheumatoid arthritis, depression, and sexual dysfunction (Savineau, Marthan, & Dumas de la Roque, 2013; Spark, 2002; Traish, Kang, Saad, & Guay, 2011). Although DHEA is made naturally by the adrenal glands, there have long been claims that DHEA replacement can work to reduce the risks of age-related diseases without the adverse events associated with other hormone replacement therapies. This remains controversial to date particularly because it is so easily converted to testosterone and estradiol, which can promote cancers (Labrie, 2010; Webb et al., 2006).
Despite decades of research on serum hormone levels, there is comparably very little data on levels of free steroids, the biologically active fraction, particularly on a nationwide scale, either cross-sectionally or longitudinally, and the standardization of measurements remains a work in progress (Stanczyk, Lee, & Santen, 2007). Moreover, high-quality studies on salivary hormone levels among the elderly people are especially rare, and nationally representative studies among the elderly people are all but non-existent. With NSHAP, we are filling in these gaps and we intend to show that this alternative method of collection is an accurate, practical, and informative way of studying the effects of declining sex hormone levels with age.
Method
Wave 1 of NSHAP was conducted between July 2005 and March 2006 with a total sample of 3,005 adults born between 1920 and 1947, ranging from 57 to 85 years of age. Wave 2 was subsequently conducted between August 2010 and May 2011 and included 2,261 of the surviving Wave 1 respondents and 907 of their spouses or cohabiting partners, plus 161 individuals who were selected into the Wave 1 sample but had declined to participate and 48 of their spouses or partners, yielding a total sample size of 3,377. Data are publicly available (NSHAP Wave 1: Waite, Linda J., Edward O. Laumann, Wendy Levinson, Stacy Tessler Lindau, and Colm A. O’Muircheartaigh. National Social Life, Health, and Aging Project (NSHAP): Wave 1. ICPSR20541-v6. Ann Arbor, MI: Inter-university Consortium for Political and Social Research [distributor], 2014-04-30. doi:10.3886/ICPSR20541.v6. NSHAP Wave 2: Waite, Linda J., Kathleen Cagney, William Dale, Elbert Huang, Edward O. Laumann, Martha K. McClintock, Colm A. O’Muircheartaigh, L. Phillip Schumm, and Benjamin Cornwell. National Social Life, Health, and Aging Project (NSHAP): Wave 2 and Partner Data Collection. ICPSR34921-v1. Ann Arbor, MI: Inter-university Consortium for Political and Social Research [distributor], 2014-04-29. doi:10.3886/ICPSR34921.v1.).
Saliva Collection
Of the total respondents, 3,230 (96%) agreed to submit a sample of their saliva via a passive drool technique. Details of the saliva collection protocol are available in the Supplementary Material (Saliva & Medication Log in NSHAP Wave 2) and described elsewhere for both Wave 1 (Mendoza, Curran, & Lindau, 2007a, 2007b, 2007c; Nallanathan, Mendoza, Curran, & Lindau, 2007) and Wave 2 (O’Doherty et al., 2014). In short, respondents were encouraged not to eat during the interview, and answered questions about their food consumption on that day, even though eating and dental care are reported to have no effect on the replicability of steroid levels in saliva (Gröschl, Wagner, Rauh, & Dörr, 2001). Approximately an hour and a half into the interview, respondents were asked to submit a sample of approximately 1ml of unstimulated saliva into a vial (SaliCap, Catalog No. RE69995; IBL International GMBH, Hamburg, Germany) via a small household plastic straw. The field interview gave them unpressured time by concurrently recording information from the containers of all of their prescribed and over the counter medications, some of which might affect their saliva production.
Of the 3,230 respondents, only 71 (2.2%) were unable to provide any saliva, and equipment problems hindered four of the collections (0.1%, Table 1). To minimize bacterial growth and sample degradation, the samples were transferred immediately after collection via cold packs to the field interviewers’ home freezers. Once a month, the specimens were shipped overnight on dry ice to the Central Survey Biomeasure Laboratory where they were stored at −80 °C before final shipment to Clemens Kirschbaum, PhD Director, Technisch Universität, Dresden LabService GmbH (Dresden, Germany) where they were subsequently analyzed for content. Five samples were lost during transit, yielding a total of 3,150 analyzable saliva specimens.
Table 1.
Valid and Missing Measurements of Salivary Sex Hormones, Unweighted NSHAP Wave 2
| Sex hormone | Testosterone | Estradiol | Progesterone | DHEA | ||||
|---|---|---|---|---|---|---|---|---|
| N | % | N | % | N | % | N | % | |
| Total interviews | 3,377 | 100 | 3,377 | 100 | 3,377 | 100 | 3,377 | 100 |
| Incomplete interviews | 1 | <1 | 1 | <1 | 1 | <1 | 1 | <1 |
| Special samplea | 4 | <1 | 4 | <1 | 4 | <1 | 4 | <1 |
| Refused | 142 | 4 | 142 | 4 | 142 | 4 | 142 | 4 |
| Agreed to provide sample | 3,230 | 96 | 3,230 | 96 | 3,230 | 96 | 3,230 | 96 |
| Tried, unable to do | 71 | 2 | 71 | 2 | 71 | 2 | 71 | 2 |
| Equipment problem | 4 | <1 | 4 | <1 | 4 | <1 | 4 | <1 |
| Adequate specimen | 3,155 | 93 | 3,155 | 93 | 3,155 | 93 | 3,155 | 93 |
| Lost in transit | 5 | <1 | 5 | <1 | 5 | <1 | 5 | <1 |
| Received by laboratoryb | 3,150 | 93 | 3,150 | 93 | 3,150 | 93 | 3,150 | 93 |
| Saliva volume too lowc | 106 | 3 | 299 | 9 | 108 | 3 | 118 | 3 |
| Low sample quality | 50 | 1 | 54 | 2 | 42 | 1 | 22 | 1 |
| <Lower limit of sensitivityd | 15 | <1 | 116 | 3 | 86 | 3 | 56 | 2 |
| >Upper limit of sensitivitye | 39 | 1 | 45 | 1 | 72 | 2 | 3 | <1 |
| Valid measurements | 2,943 | 87 | 2,636 | 78 | 2,842 | 84 | 2,951 | 87 |
| Out of age range | 171 | 5 | 132 | 4 | 128 | 4 | 151 | 4 |
| Used in analysis | 2,772 | 82 | 2,504 | 74 | 2,714 | 80 | 2,800 | 83 |
Notes. DHEA = dehydroepiandrosterone; NSHAP = National Social Life, Health, and Aging Project.
aRespondents with HIV infection were not asked to submit a sample.
bOriginal order of laboratory analysis: progesterone, testosterone, estradiol, and DHEA.
cOrder of laboratory analysis if insufficient sample: estradiol, testosterone, progesterone, and DHEA.
dLower limit of sensitivity: testosterone = 1.0 pg/mL, estradiol = 1.0 pg/mL, progesterone = 5.0 pg/mL, DHEA = 5.0 pg/mL.
eUpper limit of sensitivity: testosterone = 500 pg/mL, estradiol = 64 pg/mL, progesterone = 1,000 pg/mL, and DHEA = 3,000 pg/mL.
Assay Analysis and Quality Control
Although the Wave 2 specimens were analyzed using identical enzyme immunoassay kits provided by Salimetrics in Wave 1, the assays were conducted in different laboratories: at Salimetrics, LLC in Wave 1 and at Dresden LabService GmbH in Wave 2. On the day of assay, specimens were thawed completely, vortexed, and centrifuged at 3,000rpm for 15min, and clear samples were pipetted in duplicate into test wells using a 96-well plate format. Given sufficient sample volume, analyses were scheduled in the priority order of (a) progesterone, (b) testosterone, (c) estradiol, and (d) DHEA to minimize the effects of freeze/thaw cycles on results. In the case of insufficient sample volume, the order of priority was adjusted to (a) estradiol, (b) testosterone, (c) progesterone, and (d) DHEA. Assays were performed in duplicate and retested when the variation exceeded 15% between duplicates. All hormone values were measured in picograms per milliliter, and the average of the duplicates are used in all analyses with two exceptions: (a) a single value was used when the sample volume was inadequate to run duplicates or when assay results yielded only one valid measurement and (b) when a sample was retested, the two values with the smallest variation were averaged and used. The exact intra- and interassay coefficients of variation are given at the top of Table 2 and are similar to those reported by Gavrilova and Lindau (2009) in Wave 1.
Table 2.
Descriptive Statistics of Salivary Sex Hormones (pg/mL) in NSHAP Waves 2 and 1 Projected to the U.S. Population of Older Adults
| Descriptive statistics | Sex hormone | |||||||
|---|---|---|---|---|---|---|---|---|
| Testosterone | Estradiol | Progesterone | DHEA | |||||
| Women | Men | Women | Men | Women | Men | Women | Men | |
| Wave 2: ages 62–90 | ||||||||
| Intraassay CV | 8% | 14% | 12% | 11% | ||||
| Interassay CV | 9% | 15% | 18% | 17% | ||||
| Unweighted counts | 1,422 | 1,350 | 1,264 | 1,240 | 1,389 | 1,325 | 1,445 | 1,355 |
| Measurements (pg/mL) | ||||||||
| Minimum | 1.18 | 5.13 | 1.0 | 1.0 | 5.09 | 5.08 | 5.12 | 5.02 |
| Maximum | 460.49 | 484.63 | 33.69 | 30.67 | 941.17 | 527.11 | 626.73 | 624.62 |
| Mean | 44.57 | 81.12 | 4.10 | 4.22 | 40.05 | 47.25 | 74.98 | 70.93 |
| Mean ln(y)a | 3.58 | 4.24 | 1.16 | 1.19 | 3.39 | 3.53 | 3.94 | 3.91 |
| Standard error of mean | 0.81 | 1.21 | 0.11 | 0.11 | 1.22 | 1.40 | 1.89 | 1.89 |
| Median | 40.07 | 77.26 | 2.93 | 2.97 | 30.05 | 32.58 | 53.51 | 50.05 |
| Standard deviation | 30.48 | 44.44 | 4.03 | 4.01 | 45.43 | 50.99 | 71.79 | 69.44 |
| Wave 1: ages 57–85 | ||||||||
| Unweighted counts | 1,118 | 1,195 | 1,171 | 1,182 | 1,165 | 1,220 | 1,111 | 1,194 |
| Measurements (pg/mL) | ||||||||
| Minimum | 2.30 | 3.81 | 1.0 | 1.15 | 5.08 | 5.12 | 5.14 | 5.04 |
| Maximum | 217.42 | 393.42 | 64.0 | 64 | 851.65 | 764.72 | 449.74 | 1756.15 |
| Mean | 46.42 | 83.05 | 9.48 | 9.52 | 39.94 | 50.01 | 47.78 | 59.89 |
| Mean ln(y)a | 3.72 | 4.32 | 1.95 | 1.94 | 3.29 | 3.45 | 3.52 | 3.70 |
| Standard error of mean | 0.71 | 1.07 | 0.26 | 0.26 | 1.68 | 2.40 | 1.34 | 2.49 |
| Median | 42.93 | 77.5 | 6.98 | 6.66 | 25.49 | 30.50 | 34.82 | 40.62 |
| Standard deviation | 23.59 | 37.06 | 8.94 | 8.90 | 57.44 | 83.99 | 44.63 | 86.03 |
Notes. CV = coefficient of variation; DHEA = dehydroepiandrosterone; ln = natural log; NSHAP = National Social Life, Health, and Aging Project; pg/mL = picograms per milliliter.
aMean of the measurements after a natural log transformation.
For each hormone, measurements that fall outside the reportable range of the standard curve, that is, below the lower limit of sensitivity of the assay or are higher than the upper limit, are flagged for further scrutiny. The lower limits of sensitivity were determined by interpolating the mean minus two standard deviations of the optical densities at the 0 pg/mL standard (i.e., “zero standard”), using 10 sets of duplicates for testosterone, estradiol, and DHEA and 20 sets for progesterone. For measurements greater than those of the highest calibrator, samples were diluted to bring the optical density readings within accepted range and flagged as the likely products of interference. Measurements outside of the reportable ranges are excluded from our analyses in this article until further investigation into respondent medications and conditions can address these extreme values.
A comprehensive quality control analysis was performed to quantify inter-assay and intraassay variation as well as test for possible effects of field interviewers, shipping duration, and run effects throughout time within the lab environment, and findings were discussed with laboratory director Clemens Kirschbaum, PhD. Details of quality control protocols are described in full elsewhere (O’Doherty et al., 2014), and we provide detail on the types of missing values in our data and how to best account for them in future analyses.
Statistical Analyses
All analyses were conducted using Stata 13 software (StataCorp, 2013). Respondents were limited to those who were age-eligible in Wave 1, and all analyses are weighted to account for non-response rates based on age and urbanicity of residence, thereby representing the U.S. population born between 1920 and 1947 (age 62–91 at the time of 2010–2011 interview). Descriptive statistics of sex hormone levels are given for men and women in both NSHAP Waves 1 and 2 and the distributions of each measure are shown graphically for both waves using boxplots, split by gender.
To provide further insight into differences by age and gender in Wave 2 data, each of the hormone measures are regressed against (1) no demographic variables for a constant-only model; (2) gender, with men assigned “0” and women assigned “1”; (3) gender, age, and age2; and finally, (4) gender, age, age2, a gender by age interaction, and a gender by age2 interaction. Age is centered at its mean in Models 3 and 4, and each sex hormone measurement is transformed by the natural log to minimize the effects of extreme outliers.
Because the four models are nested, we use Wald tests with α = .05 to determine the most parsimonious model for each sex hormone. Finally, based on Model 4 (the full model), the predicted means of each sex hormone are plotted onto a two-dimensional margins plot by age and gender with pointwise 95% confidence intervals around the means.
To quantify the longitudinal effects of age and gender while controlling for the methodological change in laboratory, we conduct four repeated measures analysis of variance models for each hormone measure with the following covariates: (1) wave of survey with NSHAP Wave 1 assigned “0” and NSHAP Wave 2 assigned “1”; (2) wave of survey and gender; (3) wave of survey, gender, age, and age2; (4a) wave of survey, gender, age, age2 plus a wave by gender interaction; and (4b) wave of survey, gender, age, age2 plus a wave by age interaction and a wave by age2 interaction. Age is once again centered at its mean, hormone measurements are log transformed, and Wald tests conducted for nested models.
Under the assumption of no significant secular changes in the population between 2006 and 2011, the “wave of survey” factor should encompass the effect of laboratory. This assumption comes with a caveat, however, as recent studies have shown that there actually may be an age-independent, period-independent decrease in population-level male testosterone levels in both the United States and Europe (Andersson et al., 2007; Travison, Araujo, O’Donnell, Kupelian, & McKinlay, 2007). However, if this decline is indeed due to cohort effects rather than any unaccountable environmental factors, its effect on our findings should theoretically be null because the men added to the study in Wave 2 are, on average, from the same cohorts as the returning Wave 1 respondents (mean age for both groups ≈ 73 years).
Results
Gender Differences
Graphically, men appeared to have higher overall levels of testosterone and progesterone than women, whereas men and women had nearly identical distributions of estradiol and DHEA (Figure 1, boxplots for Wave 2). Indeed, the gender coefficients for women in the most parsimonious models were negative and significant for both testosterone (Table 3; Model 3: coef = −0.665, p < .001) and progesterone (Model 2: coef = −0.138, p < .001). No significant gender differences were seen in estradiol or DHEA levels.
Figure 1.
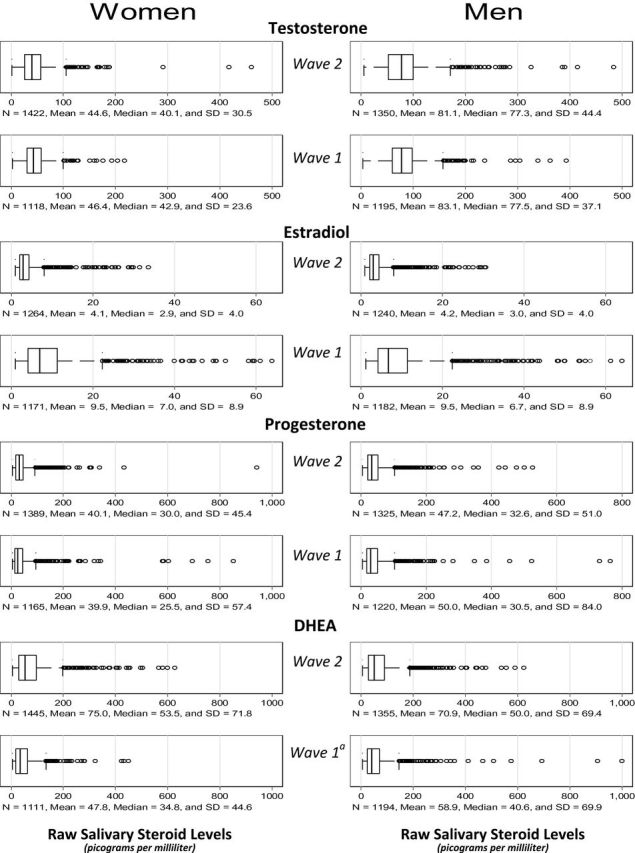
The distributions of salivary sex hormone measurements (pg/mL) for women and men (columns) in NSHAP Waves 1 and 2 (rows). Notes. DHEA = dehydroepiandrosterone; NSHAP = National Social Life, Health, and Aging Project. aFor simplicity and graph visibility, two Wave 1 male respondents with DHEA > 1,000 pg/mL excluded.
Table 3.
Linear Regressions of Levels of Salivary Sex Hormones, NSHAP Wave 2 (Log-Transformed and Weighted)
| Sex hormone | ||||||||
|---|---|---|---|---|---|---|---|---|
| Testosterone, N = 2,772 | Estradiol, N = 2,504 | |||||||
| Model 1 | Model 2 | Model 3a | Model 4b | Model 1a | Model 2 | Model 3 | Model 4 | |
| R 2 | — | 0.205 | 0.213 | 0.216 | — | 3.00e−4 | 0.002 | 0.002 |
| Wald p valuec | — | <.001 | <.001 | .003 | — | .488 | .254 | .826 |
| Constant | 3.906*** | 4.244*** | 4.254*** | 4.266*** | 1.175*** | 1.187*** | 1.206*** | 1.216*** |
| Womend | −0.668*** | −0.665*** | −0.688*** | −0.024 | −0.022 | −0.043 | ||
| Overall age p value | <.001 | <.001 | .254 | .378 | ||||
| Agee | −0.008*** | −0.013*** | −0.001 | 4.78e−4 | ||||
| Age2 | −2.08e−4 | −4.60e−4 | −3.79e−4 | −0.001 | ||||
| Overall interactions p value | .003 | .826 | ||||||
| Women × Age | 0.009 | −0.003 | ||||||
| Women × Age2 | 4.45e−4 | 3.80e−4 | ||||||
| Progesterone, N = 2,714 | DHEA, N = 2,800 | |||||||
| Model 1 | Model 2a | Model 3 | Model 4 | Model 1a | Model 2 | Model 3 | Model 4b | |
| R 2 | — | 0.008 | 0.008 | 0.008 | — | 4.00e−4 | 0.002 | 0.003 |
| Wald p valuec | — | <.001 | .882 | .856 | — | .407 | .115 | .457 |
| Constant | 3.457*** | 3.527*** | 3.521*** | 3.512*** | 3.925*** | 3.907*** | 3.914*** | 3.931*** |
| Womend | −0.138*** | −0.138*** | −0.120* | 0.035 | 0.037 | 0.004 | ||
| Overall age p value | .882 | .779 | .115 | .043 | ||||
| Agee | 0.001 | −2.92e−4 | −0.004 | −0.004** | ||||
| Age2 | 1.11e−4 | 2.79e−4 | −1.56e−4 | −4.76e−4 | ||||
| Overall interactions p value | .856 | .457 | ||||||
| Women × Age | 0.002 | 3.48e−4 | ||||||
| Women × Age2 | −3.33e−4 | 0.001 | ||||||
Notes. DHEA = dehydroepiandrosterone; NSHAP = National Social Life, Health, and Aging Project; W1 = Wave 1.
aMost parsimonious model (main effects only).
bMost parsimonious model (with significant effect modification).
cWald test p value comparing nested models.
dMen coded as “0”; women coded as “1.”
eAge is centered around its mean.
*p < .05. **p < .01. ***p < .001.
Age Differences
There was also a significant linear decrease by age in androgen levels and an absence of any observed curvilinearity (testosterone Model 3: coef = −0.008, p < .001; DHEA Model 4: coef = −0.004, p < .01). In contrast, neither estradiol nor progesterone manifested significant age effects. When interactions for gender and age were added to the models, however, we got a clearer picture of how age-related decreases in androgen levels function. For testosterone, the addition of the Gender × Age and Gender × Age2 effects were not significant by themselves, but when considered together give a p value for model inclusion of p = .003. Because both interactions were positive, this means that the reduction in testosterone levels with age was significantly larger in men. Similarly, for DHEA, age was actually not significant in the main effects model (Model 3), but when the interactions for gender and age were added in Model 4, the coefficient for linear age was negative and significant (coef = −0.004, p < .01). This also suggests that the significant decrease in DHEA with age was exclusive to men.
NSHAP Wave Differences
The most parsimonious main effects models for each hormone in Table 4 showed that testosterone and estradiol levels were significantly lower in Wave 2 than they were in Wave 1 (testosterone Model 3: coef = −0.107, p < .001; estradiol Model 1: coef = −0.754, p < .001), whereas progesterone and DHEA levels were significantly higher (progesterone Model 2: coef = 0.104, p < .001; DHEA Model 3: coef = 0.397, p < .001). The distributions in Figure 1 illustrate these wave differences clearly and most notably for estradiol in both men and women.
Table 4.
5-Year Within-Person Change in Levels of Salivary Sex Hormones NSHAP Wave 1 to NSHAP Wave 2 (ANCOVAs, Weighted, and Log-Transformed)
| Testosterone (N = 3,456) | Estradiol (N = 3,383) | |||||||||
|---|---|---|---|---|---|---|---|---|---|---|
| Model 1 | Model 2 | Model 3a | Model 4a | Model 4bb | Model 1a | Model 2 | Model 3 | Model 4a | Model 4b | |
| Wald p valuec | — | <.001 | <.001 | .060 | .014 | — | .514 | .148 | .682 | .836 |
| Constant | 4.041*** | 4.346*** | 4.36***5 | 4.348*** | 4.348*** | 1.937*** | 1.945*** | 1.956*** | 1.952*** | 1.949*** |
| Wave 2d | −0.140*** | −0.125*** | −0.107*** | −0.076*** | −0.096*** | −0.754*** | −0.754*** | −0.752*** | −0.743*** | −0.742*** |
| Womene | −0.629*** | −0.628*** | −0.594*** | −0.629*** | −0.015 | −0.014 | −0.005 | −0.014 | ||
| Overall age p value | <.001 | <.001 | .371 | .148 | .149 | .938 | ||||
| Agef | −0.004** | −0.004*** | −0.002 | −0.001 | −0.001 | −4.51e−4 | ||||
| Age2 | −4.30e−4** | −4.46e−4** | −5.77e−5 | −2.17e−4 | −2.15e−4 | −8.20e−5 | ||||
| Wave 2 × Women | −0.061 | −0.017 | ||||||||
| Overall age interactions p value | .014 | .836 | ||||||||
| Wave 2 × Age | −0.007* | −0.001 | ||||||||
| Wave 2 × Age2 | −1.04e−4 | −1.71e−4 | ||||||||
| Progesterone (N = 3,475) | DHEA (N = 3,476) | |||||||||
| Model 1 | Model 2a | Model 3 | Model 4a | Model 4b | Model 1 | Model 2 | Model 3a | Model 4ab | Model 4bb | |
| Wald p valuec | — | <.001 | .208 | .899 | .538 | — | .048 | <.001 | .001 | <.001 |
| Constant | 3.361*** | 3.427*** | 3.402*** | 3.404*** | 3.388*** | 3.610*** | 3.636*** | 3.538*** | 3.585*** | 3.553*** |
| Wave 2d | 0.102*** | 0.104*** | 0.112*** | 0.109** | 0.130*** | 0.303*** | 0.304*** | 0.397*** | 0.309*** | 0.412*** |
| Womene | −0.134*** | −0.134*** | −0.138*** | −0.135*** | −0.053* | −0.050 | −0.146*** | −0.047 | ||
| Overall age p value | .208 | .209 | .169 | <.001 | <.001 | <.001 | ||||
| Agef | −0.001 | −0.001 | −4.23e−4 | −0.019*** | −0.019*** | −0.026*** | ||||
| Age2 | 3.52e−4 | 3.51e−4 | 0.001 | 0.001*** | 0.001*** | 3.29e−4 | ||||
| Wave 2 × Women | 0.006 | 0.176** | ||||||||
| Overall age interactions p value | .538 | <.001 | ||||||||
| Wave 2 × Age | −0.002 | 0.023*** | ||||||||
| Wave 2 × Age2 | −3.09e−4 | −0.001 | ||||||||
Notes. DHEA = dehydroepiandrosterone.
aMost parsimonious model (main effects only).
bMost parsimonious model (with significant effect modification).
cWald test p value comparing current model with previous model; Models 4a and 4b are each compared with Model 3.
dWave 1 coded as “0”; Wave 2 coded as “1.”
eMen coded as “0”; women coded as “1.”
fAge is centered around its mean.
*p < .05. **p < .01. ***p < .001.
Although these wave effects for estradiol or progesterone did not vary by age or gender, they did for both androgens. For testosterone, there was a steeper decline across ages in NSHAP Wave 2 (Model 4b: coef = −0.007, p < .05), whereas for DHEA, the age effect was stronger in Wave 1 (Model 4b: coef = 0.023, p < .001). Further, gender differences in DHEA levels were significantly larger in Wave 2 from what they had been in Wave 1 (Model 4a: coef = 0.176, p < .01).
Discussion
Benefits and Costs of Salivary Measures
Although saliva has been used to scientifically measure biologically active sex steroids in humans for decades, concerns remain about its applicability and accuracy. These were addressed by careful attention to sample collection, storage, and shipping (O’Doherty et al., 2014) as discussed here. For adults, collecting saliva is virtually stress free and provides an accurate picture of the dynamics of a stress-labile hormone such as cortisol (Vining, McGinley, Maksvytis, & Ho, 1983). The NSHAP protocol ensured privacy and reduced time pressure during collection, which could be stressors.
The storage and shipping of saliva requires specimens to be frozen to decrease the likelihood of bacterial contamination and steroid metabolism (Whembolua, Granger, Singer, Kivlighan, & Marguin, 2006; Wood, 2009), and NSHAP protocols were tightly standardized to control for potential effects temperature and freeze–thaw cycles (Gröschl et al., 2001; O’Doherty et al., 2014).
Although the level of invasiveness of salivary testing is a considerable improvement over that of venipuncture, dried blood spot testing is also less invasive, does not require samples to be frozen for shipping, and does not suffer from the contamination risks of salivary testing (McDade, 2014). However, the small amount of material obtained per participant can make measurement accuracy challenging and leave little room for error due to sample requirements for retesting (McDade, Williams, & Snodgrass, 2007), and projections to serum levels have been shown to be more accurate in premenopausal women than men (Shirtcliff, Reavis, Overman, & Granger, 2001), thereby raising questions concerning its accuracy in samples of older adults. As is the case with salivary testing, the convenience factors and lower levels of invasiveness to participants come with the higher costs necessary in assay development and validation (McDade, 2014). Ultimately, NSHAP chose saliva over dried blood spots because the assays for free levels of steroids were well validated, and we wished to use the dried blood spots collected for other measures otherwise unobtainable, that is, HbA1c.
Missing Values
Our sample sizes for all four salivary sex hormones are large compared with that in many other studies (Table 1 and Figure 2). Nonetheless, we know that the NSHAP missing values are not Missing Completely At Random, and our data indicate that they may not be Missing At Random either. For example, participants who were unable to provide a saliva specimen or provided a sample of inadequate volume are more likely to be physically compromised and in the oldest age bracket—respondents age 80 and older comprise 24% (testosterone), 25% (estradiol), 27% (progesterone), and 25% (DHEA) of the total share of missing values in the sex hormone measurements compared with 19% in the overall sample. Thus, when conducting statistical analyses with reproductive hormones and other biological measures in NSHAP, analysts should keep in mind the possible biases due to excluding these cases and instead consider handing them through multiple imputation. In doing the latter, analysts should also consider including covariates related to medications that reduce salivary flow in the imputation model.
Figure 2.

Documented measures of mean salivary sex hormones ± SEM (pg/mL)a in older women and men sorted by increasing mean age of the sample and compared with NSHAP Wave 1 (*) and NSHAP Wave 2 (**). Notes. DHEA = dehydroepiandrosterone; M-D and A-H = Mirzaii-Dizgah and Agha-Hosseini; NSHAP = National Social Life, Health, and Aging Project; pg/mL = picograms per milliliter; SEM = standard error of mean. aWhen not specified in original source, means and standard errors are approximated from text, tables, or figures. bData in Wilcox, Granger, Szanton, and Clark (2014) are not presented separately for men and women.
Extreme Values
In any assay, measurements have greater error and variation at the lowest levels of detection (Lewis, 2006). We encounter similar issues in measurements that fall below the reportable range for each hormone, the most problematic being estradiol (N = 115). The difficulty in capturing low estradiol readings via immunoassays is well documented (Handelsman et al., 2014) and can result in attenuated measures of association, suggesting a weaker association with disease (or other outcome) than actually exists (Rosner, Hankinson, Sluss, Vesper, & Wierman, 2013). Because both low and high hormone levels in older ages can be indicative of deteriorating health, we again highly recommend handling the missing data at both ends of the spectrum through multiple imputation rather than exclusion.
Among respondents with valid measurements (Table 2 and Figure 1), there are some with salivary hormone readings that are more than twice the levels of the average person in their age range and even greater than those of their much younger counterparts (Mendoza, Curran, & Lindau, 2007a, 2007b, 2007c; Nallanathan, Mendoza, Curran, & Lindau, 2007). For the majority of these respondents, this is likely due to blood contamination of the saliva from oral injury or bleeding gums that had gone undetected through quality control protocols (Granger et al., 2007) or the use of prescription hormone replacement therapy (Gavrilova & Lindau, 2009). At the time of this writing, medication data for Wave 2 are currently being coded and linked to the Multum drug database, and the data will be available in future releases. For forthcoming analyses, it will be necessary to control for or remove individuals who are artificially increasing their hormone levels in order to get an accurate picture of how naturally decreasing hormonal levels are related to morbidity and mortality in old age.
Gender Differences
For external validity of our measurements, we turn to existing literature that has successfully measured sex hormones via saliva collection. Even in the absence of a gold standard for salivary hormone levels, we can use the literature to assess whether our measurements fall within typical ranges of other studies. Figure 2 shows salivary sex hormone measurements in external sources (including both NSHAP waves), ordered by increasing average age of the sample respondents. Although sample sizes for external sources are small and their measurements show few age-related patterns, statistical differences for salivary hormone levels between men and women in NSHAP Wave 2 (as shown in Table 3 and Figure 3) coincide with gender differences in these sources. ZRT Laboratory, LLC (2007) and IBL Immuno-Biological Laboratories (2005) both report salivary testosterone measures for older men and women, and all show higher levels for men. Analysts may also wish to consider the established gender differences in the association of testosterone levels between saliva and serum, due in part to gender differences in SHBG. Granger, Shirtcliff, Booth, Kivlighan, and Schwartz (2004) propose a method to control for this difference in statistical models.
Figure 3.

Sex differences in levels of salivary sex hormones by age in NSHAP Wave 2 (weighted to represent the U.S. population aged 62–90). Notes. CI = confidence interval; DHEA = dehydroepiandrosterone; NSHAP = National Social Life, Health, and Aging Project; pg/mL = picograms per milliliter.
We also found higher levels of progesterone in men in Wave 2, and ZRT Laboratory, LLC affirms this, showing higher levels in older men (44 pg/mL) compared with older women (36 pg/mL). Although there are usually no sex differences in levels of progesterone outside of the luteal phase in young adults (Oettel & Mukhopadhyay, 2004), some studies have shown a decrease in progesterone levels after menopause (Dennerstein, Alexander, & Kotz, 2003; Schindler et al., 2003). No significant gender differences were seen in average levels of estradiol, as has been documented in other sources (ZRT Laboratory, LLC, 2007).
Gender differences in DHEA levels are mixed, with no significant differences seen between men and women in Wave 2, but when gender by wave effects are examined (Model 4a in Table 4), the main effects for both gender and wave and the Wave × Gender interaction become significant, suggesting that the gender differences seen in Wave 1 were not present in Wave 2. Although seemingly contradictory, these findings are actually quite representative of findings from existing research, some of which find evidence of higher DHEA levels in men at older ages (Kraemer et al., 2001; Young, Skibinski, Mason, & James, 1999), whereas others show significantly higher levels in women (Šulcová, Hill, Hampl, & Stárka, 1997). In their detailed analysis of DHEA and DHEA-S levels throughout the life span, Šulcová and coworkers (1997) find that there may actually be a slight increase in DHEA levels around age 80. One of their explanations for this increase is the process of natural selection; in other words, people with higher levels of DHEA may tend to live longer lives. If this is indeed the case, it may provide further explanation for the elevated levels of DHEA in Wave 2 beyond the effects of laboratory.
Age Differences
Significant and negative linear age effects are seen for both testosterone and DHEA (Figure 3 and Model 3 in Table 3). Both of these hormones also show significant curvilinear effects throughout the life span with testosterone’s decline becoming more rapid with age and DHEA’s decline slowing down. All of these age trends are documented in existing literature and thereby strengthen the validity of our findings. During the aging process, testosterone declines in both sexes: steadily throughout adulthood in men and more gradually between the ages of 20 and 45 in women, likely due to the age-related decrease in adrenal secretion (Davis & Tran, 2001; Ellison et al., 2002; Feldman et al., 2002). Further, with advanced age comes greater risk of chronic illness and a more rapid deterioration of physical health, and in turn, the decrease in testosterone levels is likely to accelerate (Feldman et al., 2002). Johnson, Bebb, and Sirrs (2002) claim that DHEA falls steadily with age in both sexes due to the slowdown in the adrenals, eventually dropping to levels only 1%–20% of normal values among young people. Because adrenal secretions show the largest rates of decline before age 60 and gradually slow down after, declining rates of DHEA production tend to follow the same pattern (Labrie, Bélanger, Cusan, Gomez, & Candas, 1997).
NSHAP Wave Differences
Although all gender and age-related differences parallel the literature on salivary and serum sex hormone levels, the wave effects for DHEA and testosterone cannot be explained via external sources and require further scrutiny. The simplest explanation would be that combining data from the two waves allows us to detect smaller differences with increased precision, even if the differences are not clinically relevant. Given the sizes of the effects, however, we believe that the change in laboratory truly plays a significant role. Because probability of a compromised salivary flow increases with age, it is possible that one of the two chosen laboratories was able to more effectively capture accurate results even with higher rates of compromised salivary flow (Jones, Watkins, Hand, Warren, & Cowen, 2002). Further, salivary flow rates are affected by the sizes of the salivary glands, which are biologically larger in men (Inoue et al., 2006), thereby providing another plausible explanation for the significant gender by wave interaction for DHEA. Regardless of its true meaning, however, NSHAP wave and its interaction with gender and age throughout older ages need to be included as confounders in all statistical models that merge sex hormone data from Waves 1 and 2.
Conclusions
Next Steps
Future analyses that may help explain some of the differences between Wave 1 and Wave 2 measurements include the flagging or exclusion of respondents in either wave undergoing hormone replacement therapy. In Wave 1, 12.3% of women and 2.5% of men were using exogenous sex hormones, and ultimately, these hormones only had a strong effect on the mean levels of estradiol, as most of the women were using estrogen therapy (Gavrilova & Lindau, 2009). There exists strong evidence, however, that 5 years of additional medical research on the hot-button issue of hormone therapy and pharmaceutical promotion of ART may have increased those percentages substantially between 2005 and 2010. Using data from Clinformatics Datamart, one of the nation’s largest and most comprehensive health insurance populations, Baillargeon, Urban, Ottenbacher, Pierson, and Goodwin (2013) show that the percentage of older American men receiving prescriptions for ART has more than doubled since 2006—the year NSHAP Wave 1 was fielded—and has more than tripled since 2001. Moreover, Handelsman (2012) confirms that this huge increase of ART in such a short period of time is not a phenomenon unique to the United States but has occurred in parallel in Australia and perhaps in other highly developed nations worldwide.
Although this rapid increase in hormone therapy rates may explain some of the inconsistencies seen in NSHAP sex hormone data overall, it will also give rise to a wealth of future research endeavors examining its population-level effects on the health and well-being of older Americans. It has already been shown in multiple studies that the current rapidly increasing rates of ART in men have led to increased strength and mobility at older ages (Basaria et al., 2010), but such physical improvements have come with increased rates of adverse cardiovascular events (including myocardial infarctions, heart failure, and stroke), adverse respiratory events, and adverse dermatological events (Basaria et al., 2010; Bhasin et al., 2010; Finkle et al., 2014; Vigen et al., 2013). With the release of NSHAP Wave 2 medication data, we will not only be able to investigate all of the above findings with a nationally representative sample but we will also be able to understand how the availability of hormone therapy is affecting the life decisions of older men, whether they understand the risks they are taking by undergoing hormone therapy and how these risks may be affecting their relationships, both sexual and non-sexual.
Another goal of future research is to identify respondents displaying symptoms of hormone depletion, examine their corresponding measured hormone levels, and attempt to uncover a biologically accurate cause-and-effect relationship. For example, we can identify respondents who are overweight, fatigued, frail, depressed, or have a loss of libido and compare their mean levels of testosterone, estradiol, progesterone, and DHEA in hopes to pinpoint which of these hormone depletions may be most strongly contributing to the telltale “symptoms” of aging. The same can be done for respondents with severe hormone imbalances, such as men with high levels of estradiol compared with testosterone, which is a condition leading to higher risk of stroke (Abbott et al., 2007). Most studies that have linked certain conditions with hormone depletion and imbalances have relied on serum measurements of hormones (often measuring total and not just the biologically active levels). Therefore, if we are able to make the same ties with salivary measurements, it will further increase the validity of salivary hormone collection as a non-invasive and accurate tool for elucidating health during aging. Most importantly, measuring these hormones will reveal reciprocal links between the social environment, psychological states, and the aging process.
Key Points .
Older men have significantly higher levels of salivary testosterone and progesterone than women. No gender differences are seen in levels of estradiol or DHEA. Age-related linear and curvilinear decreases are seen in levels of testosterone and DHEA. No aging effects are seen in levels of estradiol or progesterone.
All Wave 2 findings are supported in other salivary hormonal studies and large-scale serum-based hormonal studies, thereby strengthening the validity of our results.
We see NSHAP wave effects for all four of the sex hormones even when controlling for gender and age differences. These survey effects can largely be attributed to the use of different laboratories to conduct the salivary enzyme immunoassays. Further, measurements of testosterone and DHEA in men and women show significant wave differences that cannot be attributed to aging and become more pronounced with advancing age.
Supplementary Material
Supplementary material can be found at: http://psychsocgerontology.oxfordjournals.org/
Funding
The National Social Life, Health, and Aging Project is supported by the National Institutes of Health, including the National Institute on Aging (R37AG030481; R01AG033903), the Office of Women’s Health Research, the Office of AIDS Research, and the Office of Behavioral and Social Sciences Research (R01AG021487), and by NORC which was responsible for the data collection. M. J. Kozloski was supported by a National Institute on Aging Postdoctoral Traineeship (T32 AG00243).
Supplementary Material
Acknowledgment
The content is solely the responsibility of the authors and does not necessarily represent the official views of the National Institutes of Health.
References
- Abbott R. D., Launer L. J., Rodriguez B. L., Ross G. W., Wilson P. W. F., Masaki K. H, … Petrovitch H. (2007). Serum estradiol and risk of stroke in elderly men. Neurology, 68, 563–568. 10.1212/01.wnl.0000254473.88647.ca [DOI] [PubMed] [Google Scholar]
- Al-Dujaili E. A. S., Sharp M. A. (2012). Female salivary testosterone: Measurement, challenges and applications. In Ostojic S. M. (Ed.), Steroids—From physiology to clinical medicine (pp. 129–167). New York, NY: InTech. [Google Scholar]
- American Society of Andrology. (2006). Testosterone replacement therapy for male aging: ASA position statement. Journal of Andrology, 27, 133–134. 10.1002/j.1939-4640.2006.tb01177.x [DOI] [PubMed] [Google Scholar]
- Andersen M. L., Tufik S. (2006). Does male sexual behavior require progesterone? Brain Research Reviews, 51, 136–143. 10.1016/j.brainresrev.2005.10.005 [DOI] [PubMed] [Google Scholar]
- Andersson A. M., Jensen T. K., Juul A., Petersen J. H., Jørgensen T., Skakkebaek N. E. (2007). Secular decline in male testosterone and sex hormone binding globulin serum levels in Danish population surveys. The Journal of Clinical Endocrinology and Metabolism, 92, 4696–4705. 10.1210/jc.2006-2633 [DOI] [PubMed] [Google Scholar]
- Baillargeon J., Urban R. J., Ottenbacher K. J., Pierson K. S., Goodwin J. S. (2013). Trends in androgen prescribing in the United States, 2001 to 2011. JAMA Internal Medicine, 173, 1465–1466. 10.1001/jamainternmed.2013.6895 [DOI] [PMC free article] [PubMed] [Google Scholar]
- Barnabei V. M., Cochrane B. B., Aragaki A. K., Nygaard I., Williams R. S., McGovern P. G, … Johnson S. R. (2005). Menopausal symptoms and treatment-related effects of estrogen and progestin in the Women’s Health Initiative. Obstetrics and Gynecology, 105, 1063–1073. 10.1097/01.AOG.0000158120.47542.18 [DOI] [PubMed] [Google Scholar]
- Basaria S., Coviello A. D., Travison T. G., Storer T. W., Farwell W. R., Jette A. M, … Bhasin S. (2010). Adverse events associated with testosterone administration. The New England Journal of Medicine, 363, 109–122. 10.1056/NEJMoa1000485 [DOI] [PMC free article] [PubMed] [Google Scholar]
- Bassil N., Alkaade S., Morley J. E. (2009). The benefits and risks of testosterone replacement therapy: A review. Therapeutics and Clinical Risk Management, 5, 427–448. 10.2147/TCRM.S3025 [DOI] [PMC free article] [PubMed] [Google Scholar]
- Bayer U., Hausmann M. (2010). Hormone therapy in postmenopausal women affects hemispheric asymmetries in fine motor coordination. Hormones and Behavior, 58, 450–456. 10.1016/j.yhbeh.2010.05.008 [DOI] [PubMed] [Google Scholar]
- Bhasin S., Cunningham G. R., Hayes F. J., Matsumoto A. M., Snyder P. J., Swerdloff R. S., Montori V. M. (2010). Testosterone therapy in men with androgen deficiency syndromes: An Endocrine Society clinical practice guideline. The Journal of Clinical Endocrinology and Metabolism, 95, 2536–2559. 10.1210/jc.2009-2354 [DOI] [PubMed] [Google Scholar]
- Cadore E., Lhullier F., Brentano M., Silva E., Ambrosini M., Spinelli R, … Kruel L. (2008). Correlations between serum and salivary hormonal concentrations in response to resistance exercise. Journal of Sports Sciences, 26, 1067–1072. 10.1080/02640410801919526 [DOI] [PubMed] [Google Scholar]
- Centers for Disease Control and Prevention (CDC). (2014). National Center for Health Statistics (NCHS). National Health and Nutrition Examination Survey Questionnaire. Hyattsville, MD: U.S. Department of Health and Human Services, Centers for Disease Control and Prevention; Retrieved from http://www.cdc.gov/nchs/nhanes/nhanes2013-2014/questionnaires13_14.htm [Google Scholar]
- Dabbs J. M., Jr (1990). Salivary testosterone measurements: Reliability across hours, days, and weeks. Physiology & Behavior, 48, 83–86. 10.1016/0031-9384(90)90265-6 [DOI] [PubMed] [Google Scholar]
- Dabbs J. M., Jr., Mohammed S. (1992). Male and female salivary testosterone concentrations before and after sexual activity. Physiology & Behavior, 52, 195–197. 10.1016/0031-9384(92)90453-9 [DOI] [PubMed] [Google Scholar]
- Davis S., Tran J. (2001). What are “normal” testosterone levels for women? The Journal of Clinical Endocrinology and Metabolism, 86, 1842–1844. 10.1210/jcem.86.4.7436-10 [DOI] [PubMed] [Google Scholar]
- Dennerstein L., Alexander J. L., Kotz K. (2003). The menopause and sexual functioning: A review of the population-based studies. Annual Review of Sex Research, 14, 64–82. 10.1080/10532528.2003.10559811 [PubMed] [Google Scholar]
- Dias Fernandes C. S., Salum F. G., Bandeira D., Pawlowski J., Luz C., Cherubini K. (2009). Salivary dehydroepiandrosterone (DHEA) levels in patients with the complaint of burning mouth: A case-control study. Oral Surgery, Oral Medicine, Oral Pathology, Oral Radiology, and Endodontics, 108, 537–543. 10.1016/j.tripleo.2009.06.022 [DOI] [PubMed] [Google Scholar]
- Ellison P. T., Bribiescas R. G., Bentley G. R., Campbell B. C., Lipson S. F., Panter-Brick C., Hill K. (2002). Population variation in age-related decline in male salivary testosterone. Human Reproduction (Oxford, England), 17, 3251–3253. 10.1093/humrep/17.12.3251 [DOI] [PubMed] [Google Scholar]
- Feldman H. A., Longcope C., Derby C. A., Johannes C. B., Araujo A. B., Coviello A. D, … McKinlay J. B. (2002). Age trends in the level of serum testosterone and other hormones in middle-aged men: Longitudinal results from the Massachusetts male aging study. The Journal of Clinical Endocrinology and Metabolism, 87, 589–598. 10.1210/jcem.87.2.8201 [DOI] [PubMed] [Google Scholar]
- Finkle W. D., Greenland S., Ridgeway G. K., Adams J. L., Frasco M. A., Cook M. B, … Hoover R. N. (2014). Increased risk of non-fatal myocardial infarction following testosterone therapy prescription in men. PLoS One, 9, e85805. 10.1371/journal.pone.0085805 [DOI] [PMC free article] [PubMed] [Google Scholar]
- Gavrilova N., Lindau S. T. (2009). Salivary sex hormone measurement in a national, population-based study of older adults. The Journals of Gerontology, Series B: Psychological Sciences and Social Sciences, 64(Suppl. 1), 94–105. 10.1093/geronb/gbn028 [DOI] [PMC free article] [PubMed] [Google Scholar]
- Granger D. A., Cicchetti D., Rogosch F. A., Hibel L. C., Teisl M., Flores E. (2007). Blood contamination in children’s saliva: Prevalence, stability, and impact on the measurement of salivary cortisol, testosterone, and dehydroepiandrosterone. Psychoneuroendocrinology, 32, 724–733. 10.1016/j.psyneuen.2007.05.003 [DOI] [PubMed] [Google Scholar]
- Granger D. A., Shirtcliff E. A., Booth A., Kivlighan K. T., Schwartz E. B. (2004). The “trouble” with salivary testosterone. Psychoneuroendocrinology, 29, 1229–1240. 10.1016/j.psyneuen.2004.02.005 [DOI] [PubMed] [Google Scholar]
- Gröschl M., Wagner R., Rauh M., Dörr H. G. (2001). Stability of salivary steroids: The influences of storage, food and dental care. Steroids, 66, 737–741. 10.1373/clinchem.2008.108910 [DOI] [PubMed] [Google Scholar]
- Hall J. A., Anthony R. V. (1993). Influence of ovarian steroids on relaxin-induced distensibility and compositional changes in the porcine cervix. Biology of Reproduction, 48, 1348–1353. 10.1095/biolreprod48.6.1348 [DOI] [PubMed] [Google Scholar]
- Handelsman D. J. (2012). Pharmacoepidemiology of testosterone prescribing in Australia, 1992-2010. The Medical Journal of Australia, 196, 642–645. 10.5694/mja11.11277 [DOI] [PubMed] [Google Scholar]
- Handelsman D. J., Newman J. D., Jimenez M., McLachlan R., Sartorius G., Jones G. R. (2014). Performance of direct estradiol immunoassays with human male serum samples. Clinical Chemistry, 60, 510–517. 10.1373/clinchem.2013.213363 [DOI] [PubMed] [Google Scholar]
- Health & Retirement Study (HRS). (1992–2012). Core, Exit & Post Exit Data 1992–2012 [public use datasets & codebooks]. University of Michigan [producers & distributors] with funding from the National Institute on Aging (grant number NIA U01AG009740).
- IBL Immuno-Biological Laboratories. (2005). Saliva diagnostics Retrieved from http://www.saliva-diagnostics.com/products/
- Inoue H., Ono K., Masuda W., Morimoto Y., Tanaka T., Yokota M., Inenaga K. (2006). Gender difference in unstimulated whole saliva flow rate and salivary gland sizes. Archives of Oral Biology, 51, 1055–1060. 10.1016/j.archoralbio.2006.06.010 [DOI] [PubMed] [Google Scholar]
- Johnson M. D., Bebb R. A., Sirrs S. M. (2002). Uses of DHEA in aging and other disease states. Ageing Research Reviews, 1, 29–41. 10.1016/S0047-6374(01)00369-4 [DOI] [PubMed] [Google Scholar]
- Jones J. M., Watkins C. A., Hand J. S., Warren J. J., Cowen H. J. (2002). Comparison of three salivary flow rate assessment methods in an elderly population. Community Dentistry and Oral Epidemiology, 28, 177–184. 10.1034/j.1600-0528.2000.280303.x [DOI] [PubMed] [Google Scholar]
- Key T., Appleby P., Barnes I., Reeves G. (2002). Endogenous sex hormones and breast cancer in postmenopausal women: Reanalysis of nine prospective studies. Journal of the National Cancer Institute, 94, 606–616. 10.1093/jnci/94.8.606 [DOI] [PubMed] [Google Scholar]
- Kim H. I., Kim Y. Y., Chang J. Y., Ko J. Y., Kho H. S. (2012). Salivary cortisol, 17β-estradiol, progesterone, dehydroepiandrosterone, and α-amylase in patients with burning mouth syndrome. Oral Diseases, 18, 613–620. 10.1111/j.1601-0825.2012.01937.x [DOI] [PubMed] [Google Scholar]
- Kraemer H. C., Becker H. B., Brodie H. K., Doering C. H., Moos R. H., Hamburg D. A. (1976). Orgasmic frequency and plasma testosterone levels in normal human males. Archives of Sexual Behavior, 5, 125–132. 10.1007/BF01541869 [DOI] [PubMed] [Google Scholar]
- Kraemer R. R., Synovitz L. B., Gimpel T., Kraemer G. R., Johnson L. G., Castracane V. D. (2001). Effect of estrogen on serum DHEA in younger and older women and the relationship of DHEA to adiposity and gender. Metabolism, 50, 488–493. 10.1053/meta.2001.21036 [DOI] [PubMed] [Google Scholar]
- Krause W., Mueller U., Mazur A. (2002). Measurement of steroid levels in saliva in a population-based survey of lifestyle, medical conditions, marriage, sex life and hormone status in aging men: A feasibility study. The Aging Male, 5, 203–215. 10.1080/tam.5.4.203.215 [PubMed] [Google Scholar]
- Kumari V., Aasen I., Papadopoulos A., Bojang F., Poon L., Halari R., Cleare A. J. (2008). A comparison of prepulse inhibition in pre- and postmenopausal women and age-matched men. Neuropsychopharmacology, 33, 2610–2618. 10.1038/sj.npp.1301670 [DOI] [PubMed] [Google Scholar]
- Labrie F. (2010). DHEA, important source of sex steroids in men and even more in women. Progress in Brain Research, 182, 97–148. 10.1016/S0079-6123(10)82004-7 [DOI] [PubMed] [Google Scholar]
- Labrie F., Bélanger A., Cusan L., Gomez J. L., Candas B. (1997). Marked decline in serum concentrations of adrenal C19 sex steroid precursors and conjugated androgen metabolites during aging. The Journal of Clinical Endocrinology and Metabolism, 82, 2396–2402. 10.1210/jcem.82.8.4160 [DOI] [PubMed] [Google Scholar]
- Labrie F., Luu-The V., Bélanger A., Lin S. X., Simard J., Pelletier G., Labrie C. (2005). Is dehydroepiandrosterone a hormone? The Journal of Endocrinology, 187, 169–196. 10.1677/joe.1.06264 [DOI] [PubMed] [Google Scholar]
- Lewis J. G. (2006). Steroid analysis in saliva: An overview. The Clinical Biochemist Reviews, 27, 139–146. [PMC free article] [PubMed] [Google Scholar]
- McDade T. W. (2014). Development and validation of assay protocols for use with dried blood spot samples. American Journal of Human Biology, 26, 1–9. 10.1002/ajhb.22463 [DOI] [PubMed] [Google Scholar]
- McDade T. W., Williams S., Snodgrass J. J. (2007). What a drop can do: Dried blood spots as a minimally invasive method for integrating biomarkers into population-based research. Demography, 44, 899–925. 10.1353/dem.2007.0038 [DOI] [PubMed] [Google Scholar]
- Mendoza K., Curran M. J., Lindau S. T. (2007a). Salivary DHEA measurement in Wave 1 of the National Social Life, Health & Aging Project (NSHAP). Chicago, IL: NORC at the University of Chicago. [Google Scholar]
- Mendoza K., Curran M. J., Lindau S. T. (2007b). Salivary estradiol measurement in Wave 1 of the National Social Life, Health & Aging Project (NSHAP). Chicago, IL: NORC at the University of Chicago. [Google Scholar]
- Mendoza K., Curran M. J., Lindau S. T. (2007c). Salivary testosterone measurement in Wave 1 of the National Social Life, Health & Aging Project (NSHAP). Chicago, IL: NORC at the University of Chicago. [Google Scholar]
- Mirzaii-Dizgah I., Agha-Hosseini F. (2011). Stimulated and unstimulated saliva progesterone in menopausal women with oral dryness feeling. Clinical Oral Investigations, 15, 859–862. 10.1007/s00784-010-0449-z [DOI] [PubMed] [Google Scholar]
- Morley J. E., Perry H. M., III, Patrick P., Dollbaum C. M., Kells J. M. (2006). Validation of salivary testosterone as a screening test for male hypogonadism. The Aging Male, 9, 165–169. 10.1080/13685530600907993 [DOI] [PubMed] [Google Scholar]
- Nallanathan B., Mendoza K., Curran M. J., Lindau S. T. (2007). Salivary progesterone measurement in Wave 1 of the National Social Life, Health & Aging Project (NSHAP). Chicago, IL: NORC at the University of Chicago. [Google Scholar]
- Nelson L. R., Bulun S. E. (2001). Estrogen production and action. Journal of the American Academy of Dermatology, 45, S116–S124. 10.1067/mjd.2001.117432 [DOI] [PubMed] [Google Scholar]
- O’Doherty K., Jaszczak A., Hoffman J. N., You H., Kern D., McPhillips J, … McClintock M. K. (2014). Continuity and expansion of NSHAP Wave 2 biomeasure collection. Journals of Gerontology, Social Sciences. [DOI] [PMC free article] [PubMed] [Google Scholar]
- Oettel M., Mukhopadhyay A. K. (2004). Progesterone: The forgotten hormone in men? The Aging Male, 7, 236–257. 10.1080/ 13685530400004199 [DOI] [PubMed] [Google Scholar]
- O’Leary P., Feddema P., Chan K., Taranto M., Smith M., Evans S. (2000). Salivary, but not serum or urinary levels of progesterone are elevated after topical application of progesterone cream to pre-and postmenopausal women. Clinical Endocrinology, 53, 615–620. 10.1046/j.1365-2265.2000.01130.x [DOI] [PubMed] [Google Scholar]
- Roney J. R., Mahler S. V., Maestripieri D. (2003). Behavioral and hormonal responses of men to brief interactions with women. Evolution and Human Behavior, 24, 365–375. 10.1016/S1090-5138(03)00053-9 [Google Scholar]
- Rosner W., Hankinson S. E., Sluss P. M., Vesper H. W., Wierman M. E. (2013). Challenges to the measurement of estradiol: An endocrine society position statement. Journal of Clinical Endocrinology and Metabolism, 98, 1376–1387. 10.1210/jc.2012-3780 [DOI] [PMC free article] [PubMed] [Google Scholar]
- Salimetrics. (2010). Salivary progesterone EIA kit insert Retrieved from http://www.salimetrics.com/documents/Progesterone_Kit_Insert.pdf
- Savineau J. P., Marthan R., Dumas de la Roque E. (2013). Role of DHEA in cardiovascular diseases. Biochemical Pharmacology, 85, 718–726. 10.1016/j.bcp.2012.12.004 [DOI] [PubMed] [Google Scholar]
- Schindler A. E., Campagnoli C., Druckmann R., Huber J., Pasqualini J. R., Schweppe K. W., Thijssen J. H. (2003). Classification and pharmacology of progestins. Maturitas, 46, S7–S16. 10.1016/j.maturitas.2003.09.014 [DOI] [PubMed] [Google Scholar]
- Schumacher M., Guennoun R., Robert F., Carelli C., Gago N., Ghoumari A, … De Nicola A. F. (2004). Local synthesis and dual actions of progesterone in the nervous system: Neuroprotection and myelination. Growth Hormone & IGF Research, 14, S18–S33. 10.1016/j.ghir.2004.03.007 [DOI] [PubMed] [Google Scholar]
- Shirtcliff E. A., Reavis R., Overman W. H., Granger D. A. (2001). Measurement of gonadal hormones in dried blood spots versus serum: Verification of menstrual cycle phase. Hormones and Behavior, 39, 258–266. 10.1006/hbeh.2001.1657 [DOI] [PubMed] [Google Scholar]
- Spark R. F. (2002). Dehydroepiandrosterone: A springboard hormone for female sexuality. Fertility and Sterility, 77, S19–S25. 10.1016/S0015-0282(02)02987-4 [DOI] [PubMed] [Google Scholar]
- Stanczyk F. Z., Lee J. S., Santen R. J. (2007). Standardization of steroid hormone assays: Why, how, and when? Cancer Epidemiology, Biomarkers & Prevention, 16, 1713–1719. 10.1158/1055-9965.EPI-06-0765 [DOI] [PubMed] [Google Scholar]
- StataCorp. (2013). Stata statistical software: Release 13. College Station, TX: Author. [Google Scholar]
- Šulcová J., Hill M., Hampl R., Stárka L. (1997). Age and sex related differences in serum levels of unconjugated dehydroepiandrosterone and its sulphate in normal subjects. The Journal of Endocrinology, 154, 57–62. 10.1677/joe.0.1540057 [DOI] [PubMed] [Google Scholar]
- Tivis L. J., Richardson M. D., Peddi E., Arjmandi B. (2005). Saliva versus serum estradiol: Implications for research studies using postmenopausal women. Progress in Neuro-Psychopharmacology & Biological Psychiatry, 29, 727–732. 10.1016/j.pnpbp.2005.04.029 [DOI] [PubMed] [Google Scholar]
- Traish A. M., Kang H. P., Saad F., Guay A. T. (2011). Dehydroepiandrosterone (DHEA)—A precursor steroid or an active hormone in human physiology. The Journal of Sexual Medicine, 8, 2960–2982. 10.1111/j.1743-6109.2011.02523.x [DOI] [PubMed] [Google Scholar]
- Travison T. G., Araujo A. B., O’Donnell A. B., Kupelian V., McKinlay J. B. (2007). A population-level decline in serum testosterone levels in American men. The Journal of Clinical Endocrinology and Metabolism, 92, 196–202. 10.1210/jc.2006-1375 [DOI] [PubMed] [Google Scholar]
- van Niekerk J. K., Huppert F. A., Herbert J. (2001). Salivary cortisol and DHEA: Association with measures of cognition and well-being in normal older men, and effects of three months of DHEA supplementation. Psychoneuroendocrinology, 26, 591–612. 10.1016/S0306-4530(01)00014-2 [DOI] [PubMed] [Google Scholar]
- Vigen R., O’Donnell C. I., Barón A. E., Grunwald G. K., Maddox T. M., Bradley S. M, … Ho P. M. (2013). Association of testosterone therapy with mortality, myocardial infarction, and stroke in men with low testosterone levels. The Journal of the American Medical Association, 310, 1829–1836. 10.1001/jama.2013.280386 [DOI] [PubMed] [Google Scholar]
- Vining R. F., McGinley R. A., Maksvytis J. J., Ho K. Y. (1983). Salivary cortisol: A better measure of adrenal cortical function than serum cortisol. Annals of Clinical Biochemistry, 20, 329–335. 10.1177/000456328302000601 [DOI] [PubMed] [Google Scholar]
- Webb S. J., Geoghegan T. E., Prough R. A., Miller K. K. M. (2006). The biological actions of dehydroepiandrosterone involves multiple receptors. Drug Metabolism Reviews, 38, 89–116. 10.1080/03602530600569877 [DOI] [PMC free article] [PubMed] [Google Scholar]
- Whembolua G. L., Granger D. A., Singer S., Kivlighan K. T., Marguin J. A. (2006). Bacteria in the oral mucosa and its effects on the measurement of cortisol, dehydroepiandrosterone, and testosterone in saliva. Hormones and Behavior, 49, 478–483. 10.1016/j.yhbeh.2005.10.005 [DOI] [PubMed] [Google Scholar]
- Wilcox R. R., Granger D. A., Szanton S., Clark F. (2014). Diurnal patterns and associations among salivary cortisol, DHEA and alpha-amylase in older adults. Physiology & Behavior, 129, 11–16. 10.1016/j.physbeh.2014.02.012 [DOI] [PMC free article] [PubMed] [Google Scholar]
- Wirth M. M., Meier E. A., Fredrickson B. L., Schultheiss O. C. (2007). Relationship between salivary cortisol and progesterone levels in humans. Biological Psychology, 74, 104–107. 10.1016/j.biopsycho.2006.06.007 [DOI] [PubMed] [Google Scholar]
- Wood P. (2009). Salivary steroid assays—research or routine? Annals of Clinical Biochemistry, 46, 183–196. 10.1258/acb.2008.008208 [DOI] [PubMed] [Google Scholar]
- Yaffe K., Barnes D., Lindquist K., Cauley J., Simonsick E. M., Penninx B, … Cummings S. R. (2007). Endogenous sex hormone levels and risk of cognitive decline in an older biracial cohort. Neurobiology of Aging, 28, 171–178. 10.1016/j.neurobiolaging.2006.10.004 [DOI] [PubMed] [Google Scholar]
- Yamatani H., Takahashi K., Yoshida T., Takata K., Kurachi H. (2013). Association of estrogen with glucocorticoid levels in visceral fat in postmenopausal women. Menopause, 20, 437–442. 10.1097/gme.0b013e318271a640 [DOI] [PubMed] [Google Scholar]
- Young D. G., Skibinski G., Mason J. I., James K. (1999). The influence of age and gender on serum dehydroepiandrosterone sulphate (DHEA-S), IL-6, IL-6 soluble receptor (IL-6 sR) and transforming growth factor beta 1 (TGF-beta1) levels in normal healthy blood donors. Clinical and Experimental Immunology, 117, 476–481. 10.1046/j.1365-2249.1999.01003.x [DOI] [PMC free article] [PubMed] [Google Scholar]
- Zak P. J., Kurzban R., Ahmadi S., Swerdloff R. S., Park J., Efremidze L, … Matzner W. (2009). Testosterone administration decreases generosity in the ultimatum game. PLoS One, 4, e8330. 10.1371/journal.pone.0008330 [DOI] [PMC free article] [PubMed] [Google Scholar]
- ZRT Laboratory, LLC. (2007). ZRT reference range determination Retrieved from http://www.zrtlab.com/resources-and-data/saliva-reference-ranges
Associated Data
This section collects any data citations, data availability statements, or supplementary materials included in this article.