

Abstract
Cell type-specific GFP expression in the retina has been achieved in an expanding repertoire of transgenic mouse lines, which are valuable tools for dissecting the retinal circuitry. However, measuring light responses from GFP-labeled cells is challenging because single-photon excitation of GFP easily bleaches the photoreceptors. To circumvent this problem, we used two-photon excitation at 920 nm to target GFP-expressing cells, followed by electrophysiological recording of light responses using conventional infrared optics. This protocol offers fast and sensitive detection of GFP while preserving the light sensitivity of the retina, and can be used to obtain the light responses as well as the detailed morphology of a GFP-expressing cell. Targeting of a GFP-expressing neuron takes less than 3 minutes, and the retina preparation remains light sensitive and suitable for recording for at least 8 hours. This protocol can also be applied to study retinal neurons labeled with other two-photon-excitable fluorophores.
INTRODUCTION
Here we describe a detailed protocol to record light response from GFP-expressing retinal neurons using two-photon targeted electrophysiological recordings and reconstruction of fluorescently labeled cells in live tissue. This protocol includes the following steps. First, acute, light-sensitive retina samples are prepared under dim red and infrared light illumination. Then the retina samples are transferred to a modified Olympus two-photon microscope (custom-modified Fluoview 300) with electrophysiology and light stimulation capabilities. The GFP-expressing neurons are first detected by two-photon imaging at 920 nm, and then located under infrared optics for targeted electrophysiological recording. Next, visual stimuli are presented to the retina through the objective lens, which are synchronized with recording. If the solution in the electrode contains a red dye, after the light response of the GFP-expressing cell is recorded, the morphology of the recorded cell can be obtained. Finally, a thorough analysis is performed on the GFP-expressing cell based on its light response pattern, morphology and genetic labeling. This method has been used recently to characterize the light response from populations of retinal neurons that express fluorescent protein in a unique population of cells 1–3.
Traditionally, study of a particular retinal neuron type involves first targeting the cell type of interest based on the shape, size and location of the cell body using infrared optics and a CCD camera, followed by the presentation of light stimuli to the target cell during electrophysiological recording. The primary limitation with this approach is often the initial targeting process. Although a few cell types in mice have distinguishable cell bodies under the infrared optics 4,5, most other types are difficult to target with a high success rate.
Recent advances in genetically engineered mice offer unprecedented opportunities for studying retinal circuits by selectively labeling specific neuron types 1–3,6–11. Specificity is achieved by expression of fluorescent proteins such as GFP under cell-specific promoters, and the labeled neurons are readily identified with a fluorescence microscope for subsequent morphological and electrophysiological studies. However, the ability to measure light responses in GFP-labeled cells is limited since the epifluorescence lamp rapidly bleaches the photoreceptors, causing the loss of robust light responses after GFP excitation. To avoid this problem, a blue LED at a very dim excitation intensity and long exposure has been used to obtain fluorescent images for GFP-positive neurons in several transgenic mouse lines 6–8 However, this approach could be problematic for transgenic lines with very low GFP levels, in which case even the highest amount of excitation without bleaching is not sufficient for GFP detection.
Targeting GFP-expressing neurons using two-photon confocal microscopy utilizes Ti-sapphire based femtosecond lasers that have broad tuning spectrum out to the infra-red wavelengths. The two-photon cross-section for GFP is large at 920–930 nm 12, a wavelength range that causes weaker absorption by mouse photoreceptors than single photon excitation around 488 nm 2,9,13. Two-photon imaging using this wavelength has previously been used to excite other fluorophores such as the red fluorescent dye Sulforhodamine 101 and the calcium indicator Oregon Green 488 BAPTA-1 for recording calcium transients during light stimulation in starburst amacrine cells from rabbit retina 13,14.
A second advantage of two-photon targeted recording is that it leads to high quality images of live cell morphology that can be obtained immediately following the recording. Traditionally, recorded cells are filled with biochemical tracers, and then fixed and immunostained, and their morphology is subsequently analyzed based on fluorescent microscopy. Though this is an extremely fruitful approach, obtaining high-resolution images for each recorded cell allows for analysis of structure-function relationships on a cell-by-cell basis.
Two-photon targeted recordings have broad applicability for studies of all classes of retinal neurons since the number of transgenic mice 1–3,6–11 and zebrafish e.g. 15,16 expressing a fluorescent protein in an identified retinal cell types continues to grow rapidly. In addition, live cell two-photon confocal reconstructions could be used in recordings in any kind of tissue slice to allow for analysis of structure-function relationships of many neuronal cell types. Two-photon targeted recording can also be used to record light responses from cells expressing other two-photon excitable fluorophores such as dsRed or Td-tomato in transgenic mice or mice labeled by acute methods, such as gene gun 17 as well as genetically-encoded fluorescent proteins or indicators. Combining light response measurements with powerful genetic labeling techniques brings new opportunities to explore and manipulate retinal circuitry.
Experimental Design
Conducting two-photon targeted patch recording requires an experimental configuration that combines two-photon confocal microscopy and electrophysiological recordings 18. This is challenging in that many electrophysiological recordings are based on a fixed-stage format such that the micromanipulator for the whole cell recording are on the same surface as the preparation, to maximize stability for the recordings. In this configuration, the microscope itself moves relative to the preparation. Though there are some custom-designed two photon microscopes that allow for translation of the scan-head and detection arm, it is simper to design a translatable microscope stage that is large enough to accommodate micromanipulators and the preparation. This latter approach is the one used in our studies. Therefore, the prerequisites of this protocol include an existing Olympus-based two-photon microscope (Fluoview 300), amplifiers and data acquisition board for whole cells recordings and micromanipulators that are mounted on a translatable microscope stage.
This protocol was successful at targeting GFP for light response measurements from transgenic mice expressing very low levels of GFP. Such low GFP expression was barely detectable with standard CCD cameras and full illumination from xenon-arc lamps. Therefore we expect this protocol to suit the majority of the transgenic GFP lines including those derived from the pigmented (e.g. C57/BL6) and the albino (Swiss-Webster) strains. However, when the retinal orientation is important, e.g. in direction-selective circuit studies or in transgenic lines with non-uniform GFP expression patterns across the retina 10, we recommend using transgenic mice bred into a pigmented background strain such as C57/BL6 because the landmarks in the choroid are less distinguishable in the albino strains. We also recommend Ames’ medium as the extracellular recording solution since our retina preparations remained light sensitive for more than 8 hours in oxygenated Ames’ at room temperature (~ 25° C). Lastly, this protocol is most appropriate for light stimulation experiments at mesopic/photopic light levels, due to possible bleaching of rod photoreceptors by the laser 13.
MATERIALS
REAGENTS
Transgenic mice expressing GFP in the retinal neurons !CAUTION All experiments are to be performed in accordance with the ethical and safety guidelines at the relevant institutions and authorities.
Ames’ medium, pH 7.36 (Sigma A1420-10X1L)
Intracellular recording solution according to the requirements of the respective experiment
Alexa Fluor® 594 hydrazide, sodium (Invitrogen A-10438)
EQUIPMENT
Black nitrocellulose membrane filter paper, 0.45 μm (Millipore HABG01300)
White filter papers (e.g. Whatman 1001 090)
Razor blade (Feather Safety Razor Co. GRF-2976#11)
Pyrex Petri Dishes, 100 mm diameter × 15 mm Height (Fisher Scientific 08-747C)
Infrared light source (e.g. BE Meyers and Co, Cat. # 423MDI) and Infrared converters for the dissection microscope (e.g. BE Meyers and Co, Cat. # 4300-21)
A red LED headlamp for ambient room illumination during the dissection (e.g. Energizer model # HD33AIEN).
CCD camera (Hamamatsu C2400-77)
Video monitor (Sony PVM-137)
White, monochromatic organic light-emitting display (OLED) (Emagin Corporation model #100100-01 with glass faceplate)
The “Design Reference Kit” for connecting the OLED to a VGA port (Emagin Corporation)
Custom-made OLED holder for use with Thor’s 30 mm cage systems 19 (schematics available upon request).
50/50 beam splitter (Chroma Technology Cat # 21000 )
dichroic with a 695 nm split (D1 in fig 1a) (Chroma Technology Cat # 695dcxxr)
dichroic with a 585 nm split (D2 in fig 1a) (Chroma Technology Cat # 585dcxr)
550–550 nm band pass filter (B1 in fig 1a) (Chroma Technology Cat # ET525/50m-2p)
600–660 nm band pass filter (B2 in fig 1a) (Chroma Technology Cat # HQ630/60m-2p)
Cage plate (Thorlabs Cat # CP02)
XY Translating Lens Mount (Thorlabs Cat # HPT1)
BK7 Uncoated Plano-Convex Lens, DIA = 25.4 mm, f = 50.0 mm (Thorlabs Cat # LA1131)
Cage assembly rods 8″ (Thorlabs Cat ER8)
Olympus FluoView FV300/BX61 microscope
Mode-locked Ti-sapphire laser (100 femtosecond pulse width, Coherent)
Water-immersion objectives (e.g. Olympus LUMPlanFl/IR 60x/0.90W and UMPlanFI 20x/0.50W)
Perfusion system
Amplifier (e.g. Axon Instruments Multiclamp 700A)
Analog-to-digital converter (e.g. Axon Instruments Digidata 1440A)
Manipulator (e.g. Sutter Instruments MPC-200)
Headstage (Molecular Devices 1-CV-7B)
Borosilicate glass capillaries (1.5 mm outer and 1.10 mm inner diameter, 7.5 cm length, Sutter Instruments #BF150-110-7.5)
Glass microelectrode puller (e.g. Tritech Research PP-830)
Computers for two-photon imaging, electrophysiological recordings, and light stimulation (e.g. Dell)
A dual-port high performance video card for running the OLED (e.g. Nvidia GeForce 9500 GT 512MB)
A CRT display for running in parallel with the OLED
DVI to VGA adapters (often included with the video card)
Breakout Board for a parallel port cable (e.g. Winford Engineering BRK25F-R-FT)
Figure 1. Setup for two-photon targeted recording of light response from GFP+ retinal ganglion cells.

a. (Left) Schematic of the two-photon microscope in the configuration for targeted recording. A mode-locked Ti-sapphire is used to excite the fluorophores at 920 nm (106 mW power into the back of the microscope and 11 mW at the sample). Once a GFP-labeled cell body is identified, transmitted infrared light detected with a CCD camera is used to obtain electrophysiological recordings. INSET: A glass microelectrodes containing Alexa 594 (20 μM in Ames’ medium) was visualized together with the GFP signal from the recorded cell to confirm correct targeting and the integrity of the plasma membrane. GFP+ membrane is visible within the recording electrode during cell-attached recording. Scale bar: 25 μm (Right) Schematic of the two-photon microscope in the light stimulation configuration. Once the desired recording configuration has been obtained, visual stimuli from an OLED are presented to the retina through a plano-convex lens, a 50/50 beam splitter, and the objective. D1 = dichroic 1 (695 nm split, Chroma part # 695dcxxr); D2 = dichroic 2 (585 nm split, Chroma part # 585dcxr); BP1 = band pass 1 (500–550 nm, Chroma part # ET525/50m-2p); BP2 = band pass 2 (600–660 nm, Chroma part # HQ630/60m-2p). Modified from 2.
b. An example photo of the components and layout of the Olympus Fluoview 300 system.
c. The layout of the visual stimulation arm. The OLED, a lever-activated threaded iris (optional), and the plano-convex lens are mounted in a 30 mm cage system via a side epifluorescence port of the microscope.
EQUIPMENT SETUP
The setup for two-photon microscope for targeted recording and light stimulation is illustrated in Figure 1.
Visual stimulation
A white, monochromatic OLED is secured in a custom-made plastic holder that fits into a 30 mm cage mount 19. An uncoated plano-convex lens is attached to an x-y translating mount. The OLED and the plano-convex lens are mounted to the side port of the Olympus Fluoview-based two-photon microscope by four cage assembly rods. Images in the OLED are focused by the plano-convex lens and projected to the retina through the objective. In our setup, for an Olympus 60x water-immersion objective (LUMPlanFl/IR, NA = 0.9), the area of retina that receives light stimuli is 225 um in diameter, with a gray screen stimulus intensity of ~1.2 × 10¹³ 514 nm equivalent photons/s/cm2; for an Olympus 20x water-immersion objective, the area of light stimulation is 960 um in diameter. For the 60x objective, the 15μm diameter pixels of the OLED are 0.9 μm/pixel on the retina. The OLED is driven by an Intel core duo computer with a Windows XP operating system. Custom visual stimuli are generated using Matlab and the Psychophysics Toolbox 20,21:
http://psychtoolbox.org/wikka.php?wakka=HomePage
The OLED and a CRT display are connected to the PC via the dual port video card and displayed in “clone mode” (800×600 pixel resolution, 85 Hz refresh) for optimal timing performance (see Psychophysics Toolbox website below). The CRT monitor (as opposed to an LCD monitor) was required for obtaining the appropriate refresh rate and resolution in “clone mode.”
Synchronized visual stimulation and electrophysiological recording
TTL pulses are generated by the visual stimulation computer at the onset of light stimulation, and sent via the parallel port and a break-out card (model BRK25F-R-FT, Winford Engineering) to the Analog-to-Digital converter on the digitizer (via a modified BNC cable) to trigger electrophysiological recording. Details for generating TTL pulses can be found on the Matlab Psychophysics Toolbox website:
Alignment of the OLED to the image-forming center of the objective
Place a small piece of thick “test paper” into the water-filled recording chamber. First, focus the objective on the surface of the paper using transmitted light. Then, turn off the light, turn on the OLED and project a centered bright spot through the objective. Without moving the objective in the Z-axis, move the plano-convex lens and the OLED along the cage assembly rods until the bright spot appears focused from the eyepiece, which should correspond to the focal distance of the plano-convex lens. Now the light stimuli from the OLED are focused in the same z position as the “test paper” image (as well as retina samples). Finally, adjust the x–y translating mount of the plano-convex lens so that the center of the bright spot coincides with the cross hair of the eyepiece.
Alignment of the laser-scanned field of view with the objective-side CCD camera
Fill a glass micropipette with Alexa 488, and position it in the water-filled recording chamber. Illuminate the micropipette with transmitted light. Focus the objective on the tip of the micropipette with the eyepiece. Move the micropipette in x and y axis so that the tip coincides with the cross hair of the eyepiece. Switch to the objective-side CCD camera and the video monitor. Mark the position of the pipette tip on the TV monitor with an erasable marker or removable tape. Now turn off the transmitted light source. Acquire a fluorescent image of the micropipette tip with the infrared laser at 920 nm and the associated imaging software (e.g. Fluoview). Mark the position of the tip on the imaging computer monitor. Now, a reference point is created in both the video monitor and the imaging monitor that represents the image-forming center of the objective. ! CRITICAL Precise alignment of the video and the imaging monitors at the reference point is required for accurate and fast targeting of GFP-expressing cells.
Preparing patch electrodes from glass capillaries
Borosilicate glass capillaries can be pulled by a single stage glass microelectrode puller to produce patch electrodes for loose-patch, whole-cell patch, or cell-attached recordings. For loose-patch recordings, the resistance of the electrode is 2–4 MΩ filled with Ames’ medium. For cell-attached or whole-cell patch recordings, the resistance of the electrode is 3–5 MΩ filled with Ames’ medium or intracellular recording solutions. More detailed discussion on producing patch pipettes can be found in 22.
PROCEDURE
Preparation of acute retina samples (TIMING 15 min)
-
1
Cut the filter papers into appropriate-size pieces so that they fit into the recording chamber. Mark the filter paper with a sharp razor blade so that the dorsal-ventral and nasal-temporal orientations can be determined. Cut a hole of 1~1.5 mm2 in the center of the filter paper.
-
2
Anesthetize mice with isoflurane after they are dark adapted for 1 hour. Decapitate mice and enucleate the eyes immediately under dim red light. Note the left and right eyes. CRITICAL STEP Live mice must be handled according to institute/national regulations.
-
3
Under dim red illumination, place the eyeball on a piece of white Whatman filter paper and pierce through the cornea with the tip of a sharp razor blade.
-
4
Transfer the eyeball to a glass petri dish filled with oxygenated Ames’ medium. Remove the cornea, the lens and the vitreous from the eye under a dissection microscope under infrared illumination.
-
5
Mark the dorsal orientation of the eye cup by a small cut at the peripheral retina with a razor blade according to the landmarks in the choroid (Figure 2).
-
6
Isolate the retinas carefully from the retinal pigment epithelium (RPE) by peeling away the RPE using forceps, and cut each retina into dorsal and ventral halves along the nasal-temporal axis.
-
7
Mount retinas with the ganglion cell layer facing up onto the pre-cut filter paper in step 1, matching orientations, with the hole in the center of the retina piece.
CRITICAL STEP 2–7 To preserve the light sensitivity and health of the retina, complete steps 2–7 within 10 min and minimize light exposure throughout the dissection. We use IR illumination on the dissecting microscope and dim red ambient room light provided by a red LED headlamp (625nm, 1.28 × 10¹¹ photons/sec/cm2). If the above procedure takes longer than 10 min, transfer the tissue to a petri dish with fresh oxygenated Ames’ medium every 10 min.
-
8
Keep the mounted retinas in the oxygenated incubation chamber with Ames’ medium in darkness at room temperature.
PAUSE POINT retinas in this condition can remain healthy and light-sensitive for at least 8 hours.
Figure 2.
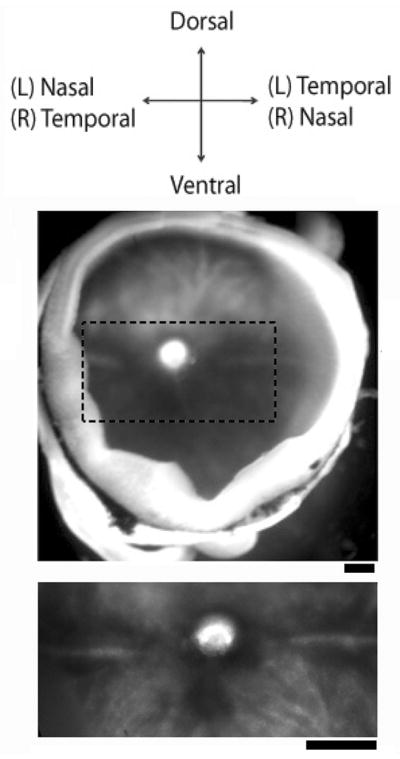
The landmarks in the choroid for marking the orientation of the retina. Under a dissection microscope, an eye cup with the retinal pigment epithelium attached is positioned with the ganglion cell layer facing up and dorsal side facing upward (Top and middle). The nasal/temporal axis is aligned with a horizontal stripe running beneath the optic nerve, with a dark-appearing patch in the ventral side (Lower image). The nasal/temporal side is opposite for left and right eyes. Scale bars: 250 μm
Two-photon targeted recording of GFP-expressing neurons (TIMING 10 min)
-
9
Place a mounted retina into the microscope chamber superfused with oxygenated Ames’ medium heated to 32–35 ° C. !CRITICAL Lower temperature may cause altered or reduced light responses.
-
10
Focus on the ganglion cell layer within the filter paper hole with IR optics and a CCD camera.
-
11
Use the two-photon microscope with laser tuned to 920 nm to identify a GFP+ cell. Adjust the x–y position of the retina so that the GFP+ cell lies precisely at the reference point in the imaging monitor. !CRITICAL This step ensures accurate targeting and centered light stimulation of the GFP-expressing cell.
-
12
Switch back to IR optics and the CCD camera to visualize the target cell body at the reference point in the TV screen. Use an empty patch electrode to carefully dissect the inner limiting membrane to expose the target cell.
-
13
Fill a new electrode with internal solution, and perform loose-patch 23,24, cell-attached24 or whole-cell recordings23 from the target cell. (Optional) Alexa 594 can be added to the pipette solution so that the correct targeting can be verified at the end of the experiment with two-photon confocal image of cell using both red and green detection channels. !CRITICAL This step is critical until the experimenter develops confidence in their targeting technique.
?TROUBLESHOOTING
Recording Light responses from the GFP-expressing neuron (TIMING 10 min. to 8 hours)
-
14
(Optional) If the objective for delivering light stimuli is different from the one for recording, carefully switch to the objectives for light stimulation. CAUTION Ensure that there are no image offsets when objectives are switched.
-
15
Focus the objective onto the photoreceptor layer.
-
16
Switch to the correct filter position for light stimulation, and turn off all light sources except for the OLED screen. Allow the retina to adapt to a background light intensity before presenting visual stimuli.
-
17
Present light stimuli to the retina and record the cell’s light response.
? TROUBLESHOOTING
-
18
(Optional) At the end of the recording, image the morphology of the dye-filled cell with the two-photon microscope in the whole-cell patch configuration.
TIMING
Steps 1–8, 15 min.; Steps 9–13, 10 min.; Steps 14–18, 10 min. to 8 hours
TROUBLESHOOTING
| Step | Problem | Possible reason | Solution |
|---|---|---|---|
| 13 | Cannot find the targeted cell body at the reference point in the video monitor after removing the inner-limiting membrane | Retina moved during dissection of the innerlimiting membrane | Re-target the GFP cell after dissection by repeating step 10 – 12. |
| 13 | Mistargeting of non-GFP neurons | Retina moved during dissection of the innerlimiting membrane | Repeat step 10 – 12. |
| 13 | Mistargeting of non-GFP neurons | Inaccurate alignment of reference point | Re-align the imaging and video monitors |
| 17 | Cells not light responsive | Some inbred transgenic lines have thin, degenerated retinas with few photoreceptors. | Compare retinal physiology to C57/Bl6 retinas, outcross to C57/Bl6 mice. |
| 17 | Cells not light responsive | Photoreceptor outer segments may have torn during dissection. | Use a carefully dissected retina with healthy photoreceptors |
| 17 | Cells not light responsive | Excessive light exposure during dissection | Minimize light exposure by using infrared light source and shortening the dissection time. |
ANTICIPATED RESULTS
We have used this protocol to obtain the photopic light responses and the dendritic morphologies of GFP-expressing retinal neurons in mice aged P14 to adult (a successful and an unsuccessful example are shown in Figure 3). The acute retina preparation remains light responsive for at least 8 hours in the oxygenated chamber with Ames’ medium at room temperature. Multiple cells can be recorded from the imaged region without loss of light responses. Standard electrophysiological techniques such as loose-patch, cell-attached and whole-cell recordings in combination with pharmacology can be used to study a wide range of light-induced activities in the target neuron.
Figure 3. Examples of successful and unsuccessful experiments of two-photon targeted recording from GFP-expressing cells.

a–c An example experiment using a Drd4-GFP transgenic mouse, which expressed GFP in nasal-preferring On-OFF direction selective cells. Light-evoked spike responses were obtained from the GFP-positive cell using cell-attached recordings. Alexa 594 was added to the internal solution for labeling the dendritic morphology by two-photon imaging after the recording.
a. Light responses to stationary spots. Top trace, cell-attached recordings showing the On and Off spike responses to a 100 μm white spot centered on the soma. Lower graph, spike density histograms of corresponding on & off spike responses (10 repetitions, 50 ms bins). Grey bar represents the time of the spot stimuli.
b. Light responses to drifting gratings. Top trace, cell-attached recordings showing the On and Off spike responses to drifting gratings in the preferred direction. Lower graph, direction tuning curves (spike counts during 3s of gratings, 12 directions, 4 repetitions) show nasal preference to drifting gratings. The black arrow indicates the vector sum of spike responses.
c. Maximal intensity projections of Z-stack images of the same cell filled with Alexa 594 through a whole cell electrode showing the dendritic arbors in the On and Off sublaminae. Scale bar: 50 μm.
d. A cell-attached recording from a GFP-labeled cell from a Drd4-GFP mouse that was exposed to bright light from the halogen bulb through the condenser. The cell exhibited tonic firing, with no light-evoked responses to a 100 μm white spot centered on the soma, presumably due to photobleaching.
Acknowledgments
We thank Rob Eifert at Cold Spring Harbor for the OLED holder schematics, and Jeffrey LeDue at UC Berkeley for optical assistance. Support contributed by NIH grant RO1EY013528 and RO1EY019498.
Footnotes
COMPETING INTEREST STATEMENT: The authors declare that they have no competing financial interests.
AUTHOR CONTRIBUTIONS: W.W. was involved in conducting the experiments and preparing the manuscript; J.E. assisted in conducting the experiments, wrote the visual stimulation and analysis code, constructed figure 1A, and assisted in writing the manuscript. M.B.F. was involved in the experimental design and assisted in the preparation of the manuscript.
References
- 1.Münch T, et al. Approach sensitivity in the retina processed by a multifunctional neural circuit. Nat Neurosci. 2009 doi: 10.1038/nn.2389. [DOI] [PubMed] [Google Scholar]
- 2.Huberman AD, et al. Genetic identification of an On-Off direction-selective retinal ganglion cell subtype reveals a layer-specific subcortical map of posterior motion. Neuron. 2009;62:327–334. doi: 10.1016/j.neuron.2009.04.014. [DOI] [PMC free article] [PubMed] [Google Scholar]
- 3.Dedek K, et al. A novel type of interplexiform amacrine cell in the mouse retina. Eur J Neurosci. 2009;30:217–228. doi: 10.1111/j.1460-9568.2009.06808.x. [DOI] [PubMed] [Google Scholar]
- 4.Chen M, Weng S, Deng Q, Xu Z, He S. Physiological properties of direction-selective ganglion cells in early postnatal and adult mouse retina. J Physiol (Lond) 2009;587:819–828. doi: 10.1113/jphysiol.2008.161240. [DOI] [PMC free article] [PubMed] [Google Scholar]
- 5.Van Wyk M, Wässle H, Taylor WR. Receptive field properties of ON- and OFF-ganglion cells in the mouse retina. Vis Neurosci. 2009:1–12. doi: 10.1017/S0952523809990137. [DOI] [PMC free article] [PubMed] [Google Scholar]
- 6.Huberman AD, et al. Architecture and activity-mediated refinement of axonal projections from a mosaic of genetically identified retinal ganglion cells. Neuron. 2008;59:425–438. doi: 10.1016/j.neuron.2008.07.018. [DOI] [PMC free article] [PubMed] [Google Scholar]
- 7.Kim I-J, Zhang Y, Meister M, Sanes JR. Laminar restriction of retinal ganglion cell dendrites and axons: subtype-specific developmental patterns revealed with transgenic markers. J Neurosci. 2010;30:1452–1462. doi: 10.1523/JNEUROSCI.4779-09.2010. [DOI] [PMC free article] [PubMed] [Google Scholar]
- 8.Kim I-J, Zhang Y, Yamagata M, Meister M, Sanes JR. Molecular identification of a retinal cell type that responds to upward motion. Nature. 2008;452:478–482. doi: 10.1038/nature06739. [DOI] [PubMed] [Google Scholar]
- 9.Siegert S, et al. Genetic address book for retinal cell types. Nat Neurosci. 2009;12:1197–1204. doi: 10.1038/nn.2370. [DOI] [PubMed] [Google Scholar]
- 10.Yonehara K, et al. Expression of SPIG1 Reveals Development of a Retinal Ganglion Cell Subtype Projecting to the Medial Terminal Nucleus in the Mouse. PLoS ONE. 2008;3:e1533. doi: 10.1371/journal.pone.0001533. [DOI] [PMC free article] [PubMed] [Google Scholar]
- 11.Dhingra A, et al. Probing neurochemical structure and function of retinal ON bipolar cells with a transgenic mouse. J Comp Neurol. 2008;510:484–496. doi: 10.1002/cne.21807. [DOI] [PMC free article] [PubMed] [Google Scholar]
- 12.Xu C, Zipfel W, Shear JB, Williams RM, Webb WW. Multiphoton fluorescence excitation: new spectral windows for biological nonlinear microscopy. Proc Natl Acad Sci USA. 1996;93:10763–10768. doi: 10.1073/pnas.93.20.10763. [DOI] [PMC free article] [PubMed] [Google Scholar]
- 13.Euler T, et al. Eyecup scope--optical recordings of light stimulus-evoked fluorescence signals in the retina. Pflugers Arch - Eur J Physiol. 2009;457:1393–1414. doi: 10.1007/s00424-008-0603-5. [DOI] [PMC free article] [PubMed] [Google Scholar]
- 14.Euler T, Detwiler PB, Denk W. Directionally selective calcium signals in dendrites of starburst amacrine cells. Nature. 2002;418:845–852. doi: 10.1038/nature00931. [DOI] [PubMed] [Google Scholar]
- 15.Mumm JS, et al. In vivo imaging reveals dendritic targeting of laminated afferents by zebrafish retinal ganglion cells. Neuron. 2006;52:609–621. doi: 10.1016/j.neuron.2006.10.004. [DOI] [PMC free article] [PubMed] [Google Scholar]
- 16.Schroeter EH, Wong ROL, Gregg RG. In vivo development of retinal ON-bipolar cell axonal terminals visualized in nyx::MYFP transgenic zebrafish. Vis Neurosci. 2006;23:833–843. doi: 10.1017/S0952523806230219. [DOI] [PubMed] [Google Scholar]
- 17.Morgan J, Huckfeldt RM, Wong RO-L. Imaging techniques in retinal research. Exp Eye Res. 2005;80:297–306. doi: 10.1016/j.exer.2004.12.010. [DOI] [PubMed] [Google Scholar]
- 18.Majewska A, Yiu G, Yuste R. A custom-made two-photon microscope and deconvolution system. Pflugers Arch. 2000;441:398–408. doi: 10.1007/s004240000435. [DOI] [PubMed] [Google Scholar]
- 19.Kerschensteiner D, et al. Genetic control of circuit function: Vsx1 and Irx5 transcription factors regulate contrast adaptation in the mouse retina. J Neurosci. 2008;28:2342–2352. doi: 10.1523/JNEUROSCI.4784-07.2008. [DOI] [PMC free article] [PubMed] [Google Scholar]
- 20.Pelli DG. The VideoToolbox software for visual psychophysics: transforming numbers into movies. Spatial vision. 1997;10:437–442. [PubMed] [Google Scholar]
- 21.Brainard DH. The Psychophysics Toolbox. Spatial vision. 1997;10:433–436. [PubMed] [Google Scholar]
- 22.Sakmann B, Neher E. Geometric parameters of pipettes and membrane patches. Plenum Press; 1983. [Google Scholar]
- 23.The Axon Guide: A Guide to Electrophysiology & Biophysics Laboratory Techniques. 3. MDS Analytical Technologies; 2008. [Google Scholar]
- 24.Perkins KL. Cell-attached voltage-clamp and current-clamp recording and stimulation techniques in brain slices. J Neurosci Methods. 2006;154:1–18. doi: 10.1016/j.jneumeth.2006.02.010. [DOI] [PMC free article] [PubMed] [Google Scholar]