Abstract
Introduction
One of the proposed second hit mechanisms in the pathophysiology of non-alcoholic steatohepatitis (NASH) is hepatic oxidative stress triggered by elevated levels of endotoxin. We investigated one possible mechanism for the endotoxaemia – disruption of intestinal barrier integrity.
Methods
We enrolled 16 subjects with fatty liver (10 NASH; 6 steatosis) and 12 healthy subjects. Steatosis and NASH were diagnosed by liver biopsy using the Brunt criteria. Gastrointestinal permeability was measured using urinary excretion of 5-h lactulose/mannitol (L/M) ratio and 24-h sucralose. Permeability testing was repeated after aspirin challenge.
Results
Groups had similar baseline urinary 0–5 h L/M ratio (small bowel permeability) and 0–24 h sucralose (whole-gut permeability). Aspirin increased 0–5 h urinary L/M in most subjects. In contrast, aspirin significantly increased whole-gut permeability only in NASH subjects. In fact, the major increase in the urinary sucralose occurred in the 6–24 h samples, which points towards the colon as the major site responsible for aspirin-induced leakiness in NASH patients. Serum endotoxin levels were significantly higher in NASH subjects.
Discussion
Our findings suggest that aspirin acts on the colon to unmask a susceptibility to gut leakiness in patients with NASH. This effect may be the underlying mechanism for increased serum endotoxin, which is the second hit (after altered lipid metabolism) that is required to initiate a necroinflammatory cascade in hepatocytes which are already primed with obesity-induced abnormal lipid homoeostasis.
Keywords: aspirin-induced gut leakiness, endotoxin, gut leakiness, leaky gut, NASH, non-alcoholic steatohepatitis, steatohepatitis, steatosis, susceptibility to gut leakiness
The term non-alcoholic fatty liver disease (NAFLD) has been coined to represent the spectrum of histological changes, from pure non-alcoholic fatty liver (steatosis) to non-alcoholic steatohepatitis (NASH), fibrosis and finally cirrhosis (1, 2) Recent epidemiological data suggest a prevalence of 3–6% for NAFLD in the general population, making NAFLD the most common liver disease in the USA (3, 4). The single most important predictor in the natural history of progression from benign simple steatosis to life-threatening cirrhosis is the presence of inflammation and fibrosis (5). Associated factors such as age and diabetes play a significant but secondary role in NAFLD. Steatosis, the most common form of NAFLD, appears to be a benign process resulting from abnormal lipid metabolism. In contrast, NASH is far less common than steatosis and does not appear to be benign in most patients; not infrequently, it progresses to cirrhosis and liver failure (5). Because only 15–25% of patients with steatosis progress to NASH (6), it is highly likely that a cofactor is required to cause inflammation and liver cell necrosis in a setting of abnormal hepatic lipid homoeostasis and steatosis. This so-called two-hit hypothesis postulates that simple steatosis is the liver’s manifestation of the metabolic syndrome, but it requires a second hit (insult) for progression to NASH (7).
One proposed second-hit mechanism is gut-derived endotoxin (8). This is based on two sets of findings. (1) Gut-derived endotoxin is likely a prerequisite cofactor in the development of alcoholic steatohepatitis and cirrhosis in alcoholics (9, 10), fatty liver being extremely common in alcoholics, but steatohepatitis and cirrhosis occur in only 15–25% of alcoholics. This pattern is similar to the pattern for NAFLD. (2) More direct evidence for the role of gut-derived endotoxin in the pathogenesis of NASH comes from animal studies. Animal studies have shown that systemic endotoxaemia leads to steatohepatitis in genetically obese rats, via release of tumour necrosis factor-α (11). In addition, Brun et al. (12) showed that genetically obese mice display enhanced intestinal permeability leading to increased portal endotoxaemia, which makes hepatic stellate cells more sensitive to bacterial endotoxin.
Possible mechanisms for endotoxaemia in patients with NASH include (a) bacterial overgrowth and (b) disrupted intestinal barrier integrity (leaky gut) that results in increased absorption of endotoxin (12–14). Indeed, we recently demonstrated increased intestinal permeability (leaky gut) in alcoholics with liver disease (15), a disorder with pathophysiological and histological features similar to NAFLD and NASH. It remains to be determined, however, whether leaky gut is also present in patients with NASH.
Accordingly, we hypothesized that patients with NASH have either frank gut leakiness or easily triggered susceptibility to gut leakiness (intermittent gut leakiness), either of which results in increased passage of gut-derived bacterial products such as endotoxin into the portal circulation, where it initiates hepatic necroinflammatory cascades and results in liver cell injury. The aim of our study was to determine whether patients with NASH have leaky guts or susceptibility to gut leakiness.
Methods
Subjects
Study patients were recruited from the bariatric surgery centre and the outpatient Gastroenterology (GI) and Hepatology clinics at Rush University Medical Center. Patients who were recruited from the surgical clinic were those who were planning to undergo gastric bypass surgery. They were all morbidly obese [body mass index (BMI) > 40 or BMI > 35 with medical complications of obesity]. After obtaining informed consent, eligible subjects completed a 24-h urine collection for test of intestinal permeability before surgery. Patients who were recruited from out-patient GI clinics similarly had biopsy-proven steatosis or steatohepatitis and obesity (BMI > 30).
Exclusion criteria
The exclusion criteria included: (i) excess average alcohol intake. This could be: (a) daily alcohol intake > 40 g for males and > 20 g for females, (b) binge drinking (drinks more than four drinks in a drinking session) or (c) a history of alcoholism; (ii) evidence of other forms of liver disease (these conditions were excluded based on liver histology, viral serology, serum iron-binding capacity, ceruloplasmin, antinuclear antibodies, antimitochondrial antibodies and smooth muscle antibodies); (iii) clinically detectable ascites or severe oedema; (iv) organic gastrointestinal diseases other than haemorrhoids, hiatal hernia or diverticulosis; (v) renal disorder (creatinine > 2); (vi) evidence of ongoing infection or recent use of antibiotics in the last month; (vii) use of non-steroidal anti-inflammatory drugs (NSAIDs) or aspirin within 2 weeks of urine collection; (viii) major depression or anxiety requiring therapy; (ix) clinically significant lung or heart disease; (x) use of anticoagulation or antiplatelet therapy; (xi) bleeding diathesis or abnormal coagulation parameters (prothrombin time/partial thromboplastin time, platelets <100); and (xii) age > 75. Control patients were non-obese (BMI <25) healthy individuals who did not fulfil any of the exclusion criteria and were willing to participate in this study.
This study was carried out after obtaining written, informed consent from study subjects. This study was reviewed and approved by the Rush University Medical Center IRB.
Histological diagnosis of liver disease
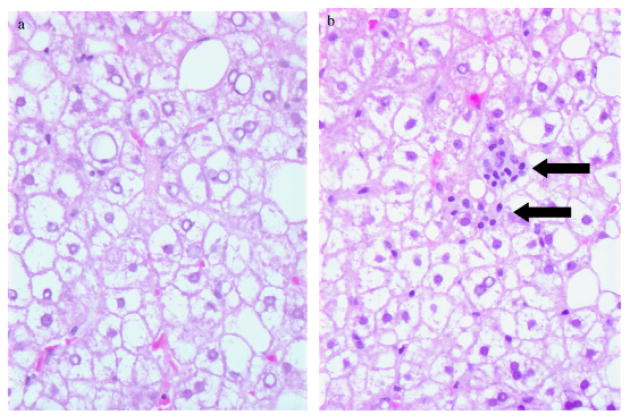
The diagnosis of NASH or steatosis was based on liver histology obtained through routine intra-operative liver biopsy at the time of laparoscopic Rouxen-Y gastric bypass to determine the baseline extent of liver damage before bariatric surgery for weight loss. The diagnosis was based on liver biopsy findings using the Necroinflammatory Grade and Fibrosis score as described by Brunt et al. (16). A representative liver histology of steatosis and NASH subject is shown in Figure 1a and b.
Fig. 1.
Histological characteristic of representative samples of steatosis (a) and non-alcoholic steatohepatitis (NASH) (b). There is clear cytoplasmic fat accumulation in the liver cells in both conditions. However, lobular lymphocytic aggregates (arrows) are only seen in NASH subjects.
Biochemical markers of liver injury
All subjects had blood drawn (at the time of urine collection) to assess biochemical markers of liver injury, including serum aspartate amino transferase (AST), amino alanine transferase (ALT), alkaline phosphatase (AP) and total bilirubin (TB).
Measurement of intestinal permeability
After an overnight fast (8 h), patients underwent a 24 h urine collection following the oral ingestion of a sugar mixture. The initial urine collection (0–5 h) was placed in a container that was separate from the second urine collection (6–24 h). The sugar mixture contained 1 g of sucralose, 7.5 g of lactulose, 40 g sucrose and 2 g of mannitol. Urine containers were pretreated with a sodium fluoride preservative.
One complicating factor in measuring gut leakiness is the possibility that gut leakiness is intermittent and will not be detected by a single baseline measurement. Intermittent barrier dysfunction can exist and can range from severe dysfunction (manifesting at all times) to mild and intermittent dysfunction (manifesting only when the intestine is challenged). This susceptibility to barrier dysfunction can be detected using a ‘challenge’ test, as established by Hilsden et al. (17) using aspirin. Accordingly, we challenged all subjects with 1300 mg of aspirin (four 325 mg tablets) the night before and again on the morning of ingestion of the sugar mixture.
The sugars in the sugar mixture are used to assess the permeability of different regions of the GI tract. Lactulose (L) is a marker for small bowel permeability and is absorbed via paracellular pathways. Mannitol (M) is absorbed via transcellular pathways. Thus, the L/M ratio in a 5 h urinary collection is an index of small bowel permeability. Sucralose, unlike lactulose, is not metabolized by colon bacteria and is thus available throughout the gut, and measurement of sucralose in a 24 h urinary collection is a marker of total gut permeability.
Materials and equipment
The materials and chemicals used were described previously (18, 19) and were obtained from Sigma (St Louis, MO, USA). Gas chromatography was performed using a Hewlett Packard instrument (HP6890N; Palo Alto, CA, USA) equipped with a flame ionization detector (FID). We used a DB-225 capillary column (J&W, Folsom, CA, USA), which was a 30 m × 250 μm ID column, with a 0.25 μm film thickness.
Chromatography
Chromatographical conditions were different from those in our previous report (19). The detector temperature was 300 °C and the injector temperature was 250 °C. The initial column temperature of 170 °C was held for 8 min and then increased at a rate of 3 °C/min to 230 °C, which was maintained for 5 min. The total run time was 33 min. The FID hydrogen flow was 30 ml/min and the air flow was 400 ml/min. Hydrogen and air were used for flame ionization detection. The carrier and make-up gas were hydrogen at flow rates of 1.5 and 25 ml/min respectively.
Sample preparation for gas chromatography
Aliquots of urine samples from the 0–5 and 0–24 h collections were thawed and each was mixed using a vortex. For each urine sample, two test tubes, each containing 200 μl of the urine sample, were prepared. Forty microlitres of internal standard containing 20 mg/ml of phenyl β-D-glucoside and 20 mg/ml of myo-inositol were added to both tubes while a known amount of four sugar mixture was added to only one of the tubes. The mixture was evaporated to dryness at 70 °C under a stream of nitrogen. The dried residues were taken up in 200 μl of anhydrous pyridine containing 25 mg/ml of hydroxylamine, mixed, heated at 70 °C for 1 h and centrifuged at 2250 r.p.m. (1000g) for 5 min. An aliquot (100 μl) of the supernatant was transferred to a small conical tube and the sugar oximes were silylated with 100 μl of N-trimethylsilylimidazole for 30 min at 70 °C. An aliquot (100 μl) of the silylated derivatives was sealed in an autosampler vial for testing.
Calculations
We calculated sugar concentrations in patients’ urine samples based on the slope and intercept of the line created by each pair of spiked and non-spiked urine samples. We used this method to decrease the variability we observed in different urine samples when they were spiked with the same amount of sugar. In this method, the sugar concentration in each sample was equal to the intercept/coefficient ratio. The total amounts of each sugar in the 0–5 and 0–24 h urine samples were expressed as percentages of the amounts of sugar that were ingested in the oral dose. The 6–24 h data were obtained from subtraction of 0–5 from 0–24 h values.
Plasma endotoxin
Blood was collected in endotoxin-free vials (Sigma) and plasma was collected and stored at −80 °C. After thawing on ice, samples were incubated at 37 °C for 10 min with Limulus amoebocyte lysate (Kinetic-QLC; Whittaker Bioproducts, Norwalk, CT, USA). Substrate solution was then added and the incubation was continued for 20 min. The reaction was stopped with 100 μl of 25% glacial acetic acid, and absorption was read spectrophotometrically at 410 nm. The assay was only carried out for a subgroup of subjects (seven healthy controls and five NASH subjects).
Statistical analysis
All values for 0–5 h urine excretions of mannitol, lactulose and the L/M ratio, and values for 0–24 and 6–24 h sucralose were obtained before and after aspirin challenge test in controls, steatosis and NASH subjects. Values of the three groups were compared using a Kruskal–Wallis test and where possible, values were compared using a post hoc test for pairwise group comparisons. Comparisons were also performed using a Mann–Whitney U test (with a Bonferroni correction for multiple comparisons). Within groups, differences pre- vs. post-aspirin were compared using a Wilcoxon Signed Ranks test. A P < 0.05 was considered to be significant. All analyses were carried out using SPSS v. 11.5 (SPSS Inc., Chicago, IL, USA).
Results
A total of 10 patients with NASH and six patients with steatosis were compared with 12 healthy controls. The subjects’ characteristics are shown in Table 1. The meanAST, ALT and TB were significantly higher in subjects with NASH and steatosis compared with controls. Although the values were higher in NASH subjects, ALT and AST levels could not differentiate NASH from steatosis. The proportion of patients with diabetes mellitus and the proportion with elevated cholesterol were similar for the steatosis and NASH groups.
Table 1.
Demographical and biochemical variables of subjects
| Healthy control (n = 12) | Steatosis (n = 6) | NASH (n = 10) | |
|---|---|---|---|
| Mean age | 47.0 ± 11.7 | 40.0 ± 11.7 | 47.3 ± 8.1 |
| Gender (M/F) | 4/8 | 3/3 | 6/4 |
| Mean BMI | 26.6 ± 6.35 | 37.3 ± 5.68 | 44.4 ± 20.8 |
| Mean AST | 27.1 ± 8.4 | 45.2 ± 15.9 | 56.8 ± 20.9 |
| Mean ALT | 29.0 ± 14.4 | 55.0 ± 12.6 | 98.8 ± 75.0 |
| Mean AP | 65.7 ± 18.5 | 84.4 ± 37 | 75.2 ± 11.7 |
| Mean TB | 0.56 ± 0.26 | 0.66 ± 0.40 | 0.76 ± 0.28 |
| Diabetes, n (%) | 0 (0) | 2 (33.3) | 1 (10) |
| Elevated cholesterol, n (%) | 1 (8.3) | 2 (33.3) | 2 (20) |
P < 0.05 vs. controls.
ALT, alanine amino transferase; AP, alkaline phosphatase; AST, aspartate amino transferase; BMI, body mass index; F, female; M, male; NASH, non-alcoholic steatohepatitis; TB, total bilirubin.
Intestinal permeability
The mean, standard deviation and median of the values for sugar excretion, pre- and post-aspirin are summarized in Table 2.
Table 2.
The mean ±SD (and median) of percent excretion of different sugar probes in baseline urine permeability test and aspirin challenge permeability test in healthy controls, steatosis and non-alcoholic steatohepatitis in 5 and 24 h urine collection
| Healthy control (n = 12)
|
Steatosis (n = 6)
|
NASH (n = 10)
|
||||
|---|---|---|---|---|---|---|
| Baseline | Aspirin challenge | Baseline | Aspirin challenge | Baseline | Aspirin challenge | |
| Lactulose (5-h urine) | 0.07 ± 0.05 (0.05) | 0.06 ± 0.028 (0.07) | 0.23 ± 0.15 (0.18) | 0.17 ± 0.08 (0.19) | 0.14 ± 0.12 (0.10) | 0.62 ± 0.82 (0.39) |
| Mannitol (5-h urine) | 10.7 ± 9.1 (9.8) | 6.8 ± 2.9 (6.6) | 15.0 ± 4.9 (14.0) | 12.7 ± 8.0 (12.1) | 18.5 ± 12.1 (19.0) | 20.0 ± 12.9 (14.8) |
| L/M ratio (5-h urine) | 0.007 ± 0.003 (0.006) | 0.01 ± 0.005* (0.009) | 0.015 ± 0.008 (0.013) | 0.015 ± 0.001 (0.015) | 0.020 ± 0.035 (0.008) | 0.033 ± 0.034* (0.03) |
| Sucralose (24-h urine) | 2.49 ± 1.34 (2.08) | 2.62 ± 1.68 (2.49) | 3.07 ± 0.87 (3.23) | 4.11 ± 1.60 (4.05) | 2.79 ± 1.55 (2.90) | 7.70 ± 4.48 *#θ (6.3) |
P < 0.05 vs. healthy control at baseline.
P < 0.05 vs. NASH at baseline.
P < 0.05 vs. steatosis post-aspirin.
L/M, lactulose/mannitol; NASH, non-alcoholic steatohepatitis; SD, standard deviation.
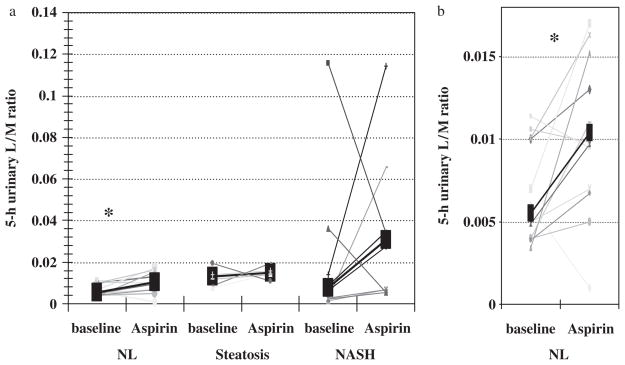
The L/M ratio, a marker of small bowel permeability, was not different among the three study groups, both before and after aspirin challenge. Small bowel permeability was significantly increased after aspirin challenge in healthy controls (P = 0.034; Fig. 2). As shown in Figure 2, not every subject in the control group developed an increased L/M after aspirin challenge. The average percentage was similar across groups. We observed increased small intestinal permeability in 75% of the control subjects, 83% of the steatosis subjects and 83% of the NASH subjects after aspirin. The extent of the increase in L/M was greater in NASH subjects. On average, we observed 82% increases in small bowel permeability in controls, 36% in steatosis subjects and 244% in NASH subjects. However, a statistically significant difference was observed only for healthy controls. The reason for this discrepancy could be attributed to a wider distribution of the baseline data and smaller sample size in the NASH group. Thus, it is reasonable to consider a type-II error to explain the lack of a statistically significant increase in L/M in subjects with NASH or steatosis.
Fig. 2.
Aspirin increased the 5-h urinary lactulose mannitol (L/M) ratio in most subjects (a). However, aspirin-induced increase in the L/M ratio was only statistically significant in healthy controls (*P = 0.03). (b) represents a magnified portion of (a) that shows healthy control subjects. NASH, non-alcoholic steatohepatitis; NL, healthy control.
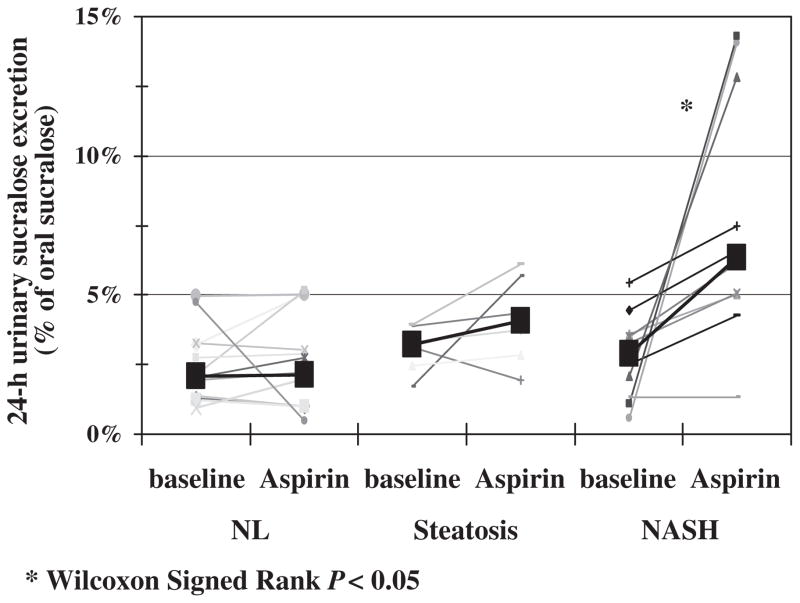
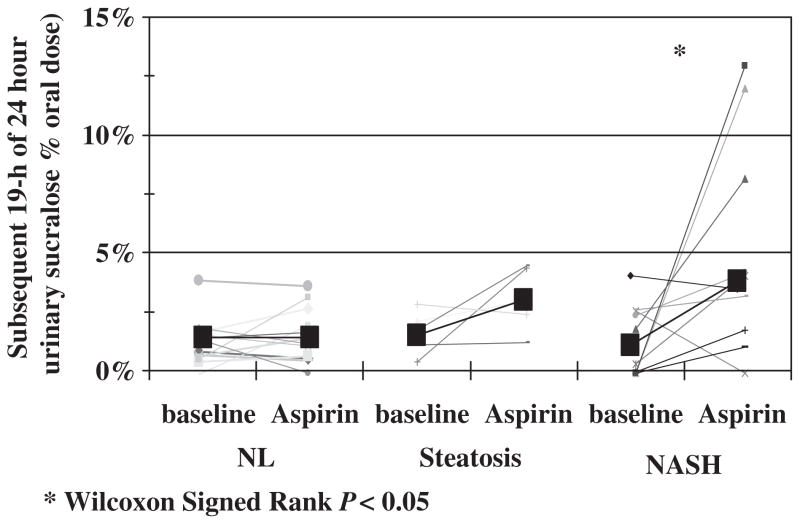
Baseline urinary 0–24 h sucralose excretion, a marker of whole-gut permeability, was not significantly different among the three groups. However, after aspirin challenge, whole-gut permeability was significantly higher in subjects with NASH (Kruskal–Wallis test, P = 0.002). Post hoc analysis showed that there was significantly higher urinary 0–24 h sucralose excretion after aspirin in subjects with NASH compared with controls (Mann–Whitney U test, P = 0.001). Only NASH subjects experienced an increase in 0–24 h sucralose excretion after the aspirin test (Fig. 3, Wilcoxon Signed Ranks test, P = 0.007). When we measured urinary sucralose excretion in the 0–5 and 6–24 h urine collections, we found that the increase in 24-h urinary sucralose excretion after aspirin challenge was primarily as a result of an increase in the 6–24 h collection (Fig. 4). As shown in Figure 4, the significant increase in urinary excretion of 6–24 h sucralose after aspirin challenge was found only in patients with NASH. There was no significant increase in the exertion of sucralose in the 0–5 h urine collection after aspirin challenge in patients with NASH.
Fig. 3.
Aspirin challenge significantly increased the whole-gut permeability (24 h urinary sucralose excretion) only in the subjects with NASH (*, P < 0.05). NASH, non-alcoholic steatohepatitis; NL, healthy control.
Fig. 4.
6–24 h urinary sucralose excretion as a marker of distal gut (colon) permeability was significantly increased by aspirin challenge only in patients with NASH (*, P < 0.05). NASH, non-alcoholic steatohepatitis; NL, healthy control.
Plasma endotoxin
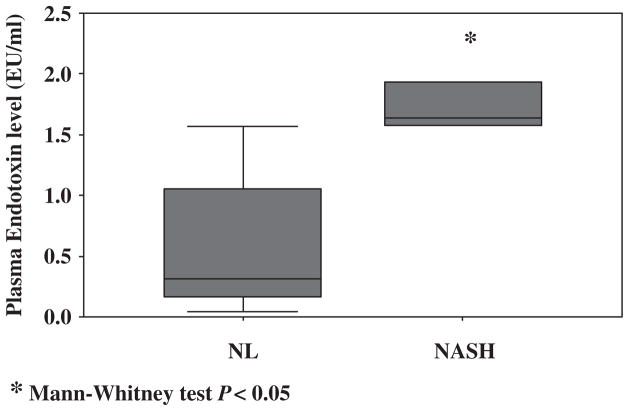
Subjects with NASH had a significantly higher level of plasma endotoxin compared with healthy controls [median 1.64 (1.06–2.39) vs. 0.31 (0.14–1.57) (P < 0.05)] (Fig. 5).
Fig. 5.
The plasma endotoxin level was significantly higher in subjects with NASH compared with healthy controls. (*, P < 0.05) NASH, non-alcoholic steatohepatitis; NL, healthy control.
Discussion
It is now well accepted that NAFLD is a result of abnormal lipid homoeostasis, insulin resistance and metabolic syndrome (1). It is also known that different forms of NAFLD have a different clinical course and prognosis (5). Specifically, only NASH is capable of progressing to fibrosis, cirrhosis and, eventually, liver failure. Thus, abnormal lipid homoeostasis is required but not sufficient for development of more serious forms of NAFLD. It is now believed that vulnerable fatty hepatocytes are injured by reactive oxygen species (ROS), which results in NASH and progressive liver disease (11, 20). ROS are generated in the liver by pro-oxidant inflammatory pathways that are initiated by gut-derived endotoxin (11, 13). Excess endotoxin can reach the liver through the portal circulation as a result of a higher concentration of endotoxin in the gut (in turn because of bacterial overgrowth) or through increased absorption of endotoxin from the gut, i.e. gut leakiness.
Wigg et al. (14) compared a group of 22 healthy controls with a group of 23 patients with biopsy-proven NAFLD for the prevalence of small intestinal bacterial overgrowth, increased intestinal permeability and serum endotoxin levels. They found a higher prevalence of small intestinal bacterial overgrowth (assessed by C14-D-xylose breath test) in patients with NAFLD, but found no difference in intestinal permeability (as measured by a lactulose–rhamnose sugar test) or endotoxaemia. Their finding of normal serum endotoxin in the systemic circulation does not exclude endotoxaemia in the portal circulation. They concluded that patients with NAFLD do not have a leaky gut, but bacterial overgrowth may contribute to an endotoxin-initiated hepatic necroinflammatory cascade. However, they did not distinguish between simple steatosis and steatohepatitis. Furthermore, they only studied small bowel permeability. Indeed, loss of colonic barrier integrity in patients with NASH could have a more deleterious effect than loss of permeability of the small bowel, which has relatively low levels of luminal bacteria. Finally, gut leakiness could still be an important pathogenic factor in patients with NASH and ‘normal’ intestinal permeability because these patients may have increased susceptibility to gut leakiness when gut barrier integrity is challenged and results in the intermittent gut leakiness and endotoxaemia necessary to initiate a hepatic necroinflammatory cascade and liver cell injury.
In the present study, we confirmed the results of an earlier study (17) that aspirin is a gut permeability stressor and causes increased small bowel permeability in healthy subjects. Also, similar to Wigg et al. (14), we found that baseline small intestinal permeability (L/M) in subjects with steatosis or NASH was not different from controls. However, we separately analysed the results for NASH and steatosis and found that patients with NASH have significant susceptibility to gut leakiness. The majority of control subjects and NASH patients developed increased small intestinal permeability after aspirin challenge. However, not all controls or NASH subjects developed aspirin-induced small intestinal hyperpermeability. The reason for this discrepancy is not known, but this may be related to the dynamic nature of the test for intestinal permeability and/or to unknown variables that can potentially modify the test for intestinal permeability such as type and time of food intake, stress level or degree of physical activity throughout the urine collection. Figures 2–4 depict data points before and after aspirin to show the variability of the response to aspirin in our study groups.
We found that aspirin increases the 0–24 h urinary excretion of sucralose (a marker of whole-gut permeability) only in patients with NASH. Our study showed that patients with NASH had more susceptibility to gut leakiness when their gut was challenged with permeability stressors such as aspirin. Our data also suggest that the site of susceptibility to leakiness in patients with NASH is the colon because 0–5 h urinary L/M ratios and sucralose excretion rates were not affected by aspirin challenge, and the major increase in aspirin-induced urinary sucralose was in the 6–24 h urine collection samples. Although the measurement of urinary sucralose excretion in the 6–24 h urine is not a standard test for assessment of colonic permeability, it is reasonable to assume that most of the oral load of ingested sucralose had already travelled through the small bowel during the 0–5 h urine collection period and the 6–24 h collection coincided with the colonic passage of an oral sucralose load. This notion is consistent with the use of 0–5 h urinary L/M ratio as a standard measure of small intestinal permeability.
An abnormal (hyperpermeable) colonic barrier could explain the endotoxaemia that was observed in our subjects with NASH and may be the second hit that is required for endotoxin-initiated oxidative liver injury in NASH subjects. Based on this model, patients with NASH do not have abnormal intestinal permeability all the time. In fact, they could easily develop gut leakiness when they are exposed to intestinal barrier stressors such as aspirin, NSAIDs (17, 21), psychological or physical stress (22) and other injurious factors. This may well explain why only a subgroup of patients with NAFLD progress to NASH, cirrhosis and liver failure. Further longitudinal studies are needed to confirm this conjecture.
There are several potential limitations to our study, including the small sample size and selecting extremely obese subjects (surgical candidates). We also did not use ultrasound to detect ascites as part of the exclusion criteria, which could have affected tests for intestinal permeability.
In summary, our study shows that there is a susceptibility to gut leakiness, rather than overt gut leakiness, in obese subjects with NASH. This susceptibility to leakiness may be the cause of the endotoxaemia that we observed in subjects with NASH and may explain why only a subgroup of patients with NAFLD progresses to steatohepatitis and advanced fibrosis. This finding may also help us to find the contributing factors in the pathogenesis of NASH that act by jeopardizing colonic barrier integrity, factors such as NSAIDs, which in turn can lead to endotoxaemia and provide the ‘second hit’ for development of NASH. Based on our results, it is reasonable to recommend to those patients with altered fatty acid metabolism and metabolic syndrome (obesity, diabetes, insulin resistance) and who are more susceptible to oxidative stress to avoid agents that increase permeability such as NSAIDs and alcohol. Larger, interventional or longitudinal prospective studies are needed to assess directly the contribution of susceptibility to gut leakiness in the course of NAFLD.
References
- 1.Angulo P. Nonalcoholic fatty liver disease. N Engl J Med. 2002;346:1221–31. doi: 10.1056/NEJMra011775. [DOI] [PubMed] [Google Scholar]
- 2.Bacon BR, Farahvash MJ, Janney CG, Neuschwander-Tetri BA. Nonalcoholic steatohepatitis: an expanded clinical entity. Gastroenterology. 1994;107:1103–9. doi: 10.1016/0016-5085(94)90235-6. [DOI] [PubMed] [Google Scholar]
- 3.Clark JM, Brancati FL, Diehl AM. The prevalence and etiology of elevated aminotransferase levels in the United States. Am J Gastroenterol. 2003;98:960–7. doi: 10.1111/j.1572-0241.2003.07486.x. [DOI] [PubMed] [Google Scholar]
- 4.Ruhl CE, Everhart JE. Determinants of the association of overweight with elevated serum alanine aminotransferase activity in the United States. Gastroenterology. 2003;124:71–9. doi: 10.1053/gast.2003.50004. [DOI] [PubMed] [Google Scholar]
- 5.Matteoni CA, Younossi ZM, Gramlich T, Boparai N, Liu YC, McCullough AJ. Nonalcoholic fatty liver disease: a spectrum of clinical and pathological severity. Gastroenterology. 1999;116:1413–9. doi: 10.1016/s0016-5085(99)70506-8. [DOI] [PubMed] [Google Scholar]
- 6.Wanless IR, Lentz JS. Fatty liver hepatitis (steatohepatitis) and obesity: an autopsy study with analysis of risk factors. Hepatology. 1990;12:1106–10. doi: 10.1002/hep.1840120505. [DOI] [PubMed] [Google Scholar]
- 7.Dixon JB, Bhathal PS, O’Brien PE. Nonalcoholic fatty liver disease: predictors of nonalcoholic steatohepatitis and liver fibrosis in the severely obese. Gastroenterology. 2001;121:91–100. doi: 10.1053/gast.2001.25540. [DOI] [PubMed] [Google Scholar]
- 8.Day CP, James OF. Steatohepatitis: a tale of two “hits”? Gastroenterology. 1998;114:842–5. doi: 10.1016/s0016-5085(98)70599-2. [DOI] [PubMed] [Google Scholar]
- 9.Bhagwandeen BS, et al. Endotoxin induced hepatic necrosis in rats on an alcohol diet. J Pathol. 1987;152:47–53. doi: 10.1002/path.1711520107. [DOI] [PubMed] [Google Scholar]
- 10.Nanji AA, Khettry U, Sadrzadeh SM, Yamanaka T. Severity of liver injury in experimental alcoholic liver disease. Correlation with plasma endotoxin, prostaglandin E2, leukotriene B4, and thromboxane B2. Am J Pathol. 1993;142:367–73. [PMC free article] [PubMed] [Google Scholar]
- 11.Yang SQ, Lin HZ, Lane MD, Clemens M, Diehl AM. Obesity increases sensitivity to endotoxin liver injury: implications for the pathogenesis of steatohepatitis. Proc Natl Acad Sci USA. 1997;94:2557–62. doi: 10.1073/pnas.94.6.2557. [DOI] [PMC free article] [PubMed] [Google Scholar]
- 12.Brun P, Castagliuolo I, Di Leo V, Buda A, Pinzani M, Palù G. Increased intestinal permeability in obese mice: new evidence in the pathogenesis of nonalcoholic steatohepatitis. Am J Physiol Gastrointest Liver Physiol. 2007;292:G518–25. doi: 10.1152/ajpgi.00024.2006. [DOI] [PubMed] [Google Scholar]
- 13.Romics L, Jr, Kodys K, Dolganiuc A, Graham L, Velayudham A, Mandrekar P. Diverse regulation of NF-kappaB and peroxisome proliferator-activated receptors in murine non-alcoholic fatty liver. Hepatology. 2004;40:376–85. doi: 10.1002/hep.20304. [DOI] [PubMed] [Google Scholar]
- 14.Wigg AJ, Roberts-Thomson IC, Dymock RB, McCarthy PJ, Grose RH, Cummins AG. The role of small intestinal bacterial overgrowth, intestinal permeability, endotoxaemia, and tumour necrosis factor alpha in the pathogenesis of non-alcoholic steatohepatitis. Gut. 2001;48:206–11. doi: 10.1136/gut.48.2.206. [DOI] [PMC free article] [PubMed] [Google Scholar]
- 15.Keshavarzian A, Holmes EW, Patel M, Iber F, Fields JZ, Pethkar S. Leaky gut in alcoholic cirrhosis: a possible mechanism for alcohol-induced liver damage. Am J Gastroenterol. 1999;94:200–7. doi: 10.1111/j.1572-0241.1999.00797.x. [DOI] [PubMed] [Google Scholar]
- 16.Brunt EM, Janney CG, Di Bisceglie AM, Neuschwander-Tetri BA, Bacon BR. Nonalcoholic steatohepatitis: a proposal for grading and staging the histological lesions. Am J Gastroenterol. 1999;94:2467–74. doi: 10.1111/j.1572-0241.1999.01377.x. [DOI] [PubMed] [Google Scholar]
- 17.Hilsden RJ, Meddings JB, Sutherland LR. Intestinal permeability changes in response to acetylsalicylic acid in relatives of patients with Crohn’s disease. Gastroenterology. 1996;110:1395–403. doi: 10.1053/gast.1996.v110.pm8613043. [DOI] [PubMed] [Google Scholar]
- 18.Farhadi A, Keshavarzian A, Fields JZ, Sheikh M, Banan A. Resolution of common dietary sugars from probe sugars for test of intestinal permeability using capillary column gas chromatography. J Chromatogr B Analyt Technol Biomed Life Sci. 2006;836:63–8. doi: 10.1016/j.jchromb.2006.03.046. [DOI] [PubMed] [Google Scholar]
- 19.Farhadi A, Keshavarzian A, Holmes EW, Fields J, Zhang L, Banan A. Gas chromatographic method for detection of urinary sucralose: application to the assessment of intestinal permeability. J Chromatogr B Analyt Technol Biomed Life Sci. 2003;784:145–54. doi: 10.1016/s1570-0232(02)00787-0. [DOI] [PubMed] [Google Scholar]
- 20.Chitturi S, Farrell GC. Etiopathogenesis of nonalcoholic steatohepatitis. Semin Liver Dis. 2001;21:27–41. doi: 10.1055/s-2001-12927. [DOI] [PubMed] [Google Scholar]
- 21.Hollander D. Intestinal permeability, leaky gut, and intestinal disorders. Curr Gastroenterol Rep. 1999;1:410–6. doi: 10.1007/s11894-999-0023-5. [DOI] [PubMed] [Google Scholar]
- 22.Santos J, Yang PC, Söderholm JD, Benjamin M, Perdue MH. Role of mast cells in chronic stress induced colonic epithelial barrier dysfunction in the rat. Gut. 2001;48:630–6. doi: 10.1136/gut.48.5.630. [DOI] [PMC free article] [PubMed] [Google Scholar]


