

Abstract
The mechanisms by which skeletal muscles lengthen and shorten are potentially complex. When the relaxed human gastrocnemius muscle is at its shortest in vivo lengths it falls slack (i.e. it does not exert any passive tension). It has been hypothesised that when the muscle is passively lengthened, slack is progressively taken up, first in some muscle fascicles then in others. Two-dimensional imaging methods suggest that, once the slack is taken up, changes in muscle length are mediated primarily by changes in the lengths of the tendinous components of the muscle. The aims of this study were to test the hypothesis that there is progressive engagement of relaxed muscle fascicles, and to quantify changes in the length and three-dimensional orientation of muscle fascicles and tendinous structures during passive changes in muscle length. Ultrasound imaging was used to determine the location, in an ultrasound image plane, of the proximal and distal ends of muscle fascicles at 14 sites in the human gastrocnemius muscle as the ankle was rotated passively through its full range. A three-dimensional motion analysis system recorded the location and orientation of the ultrasound image plane and the leg. These data were used to generate dynamic three-dimensional reconstructions of the architecture of the muscle fascicles and aponeuroses. There was considerable variability in the measured muscle lengths at which the slack was taken up in individual muscle fascicles. However, that variability was not much greater than the error associated with the measurement procedure. An analysis of these data which took into account the possible correlations between errors showed that, contrary to our earlier hypothesis, muscle fascicles are not progressively engaged during passive lengthening of the human gastrocnemius. Instead, the slack is taken up nearly simultaneously in all muscle fascicles. Once the muscle is lengthened sufficiently to take up the slack, about half of the subsequent increase in muscle length is due to elongation of the tendinous structures and half is due to elongation of muscle fascicles, at least over the range of muscle–tendon lengths that was investigated (up to ∼60 or 70% of the range of in vivo lengths). Changes in the alignment of muscle fascicles and flattening of aponeuroses contribute little to the total change in muscle length.
Key points.
The human gastrocnemius muscle is slack at its shortest lengths in vivo. We hypothesised that when the muscle is lengthened slack is taken up progressively, first in some muscle fascicles, then in others.
A new, quasi-three-dimensional ultrasound imaging method was used to test this hypothesis directly. Contrary to our prediction, the slack was taken up nearly simultaneously in muscle fascicles located throughout the gastrocnemius muscle.
Dynamic three-dimensional reconstructions indicated that, over the range of lengths that was investigated, passive changes in the length of gastrocnemius muscle–tendon units are due to changes in the length of both muscle fascicles and tendinous structures, in approximately equal measure. Changes in the alignment of muscle fascicles and the curvature of aponeuroses have a negligible contribution to change in muscle length.
These findings give insights into how skeletal muscles change their lengths in vivo.
Introduction
When people move, their joints rotate. Joint rotation changes the lengths of skeletal muscle–tendon units that cross the joints. Usually the changes in muscle–tendon length are relatively small. For example, during walking the gastrocnemius muscle–tendon unit in an adult human lengthens and shortens by about 4.5 cm (Lichtwark et al. 2007; Rana & Wakeling, 2011; Rana et al. 2013), less than 15% of the shortest in vivo muscle–tendon length. While physiological changes in muscle length are often small they are, nonetheless, essential for normal motor task performance.
Changes in muscle–tendon length could be achieved by changes in the length or orientation of the muscle fascicles, tendinous aponeuroses or extramuscular tendon. These mechanisms are not completely independent: muscle fascicles terminate on aponeuroses so changes in the length and orientation of muscle fascicles must be coupled to changes in the length or orientation of aponeuroses. Muscle and tendon are nearly incompressible so changes in their lengths must be coupled to changes in their transverse dimensions (Baskin & Paolini, 1964; van Bavel et al. 1996; Azizi & Roberts, 2009; Vergari et al. 2011).
Studies of mammalian skeletal muscles have quantified the changes in length and orientation of muscle fascicles and tendons that accompany changes in muscle–tendon length under a range of conditions (e.g. Morgan et al. 1978; Rack & Westbury, 1984; Elek et al. 1990; Fukunaga et al. 1997; Maganaris et al. 1998; Finni et al. 2003; Gillis et al. 2005; Hodgson et al. 2006; Lichtwark et al. 2007; Loram et al. 2007; Shin et al. 2009). These studies show that the contribution of changes in muscle fascicle length and pennation angle to changes in muscle–tendon length depends on the amplitude of the movement (Loram et al. 2007) and the degree of muscle contraction (e.g. Rack & Westbury, 1984; Herbert & Gandevia, 1995). Technical limitations have so far precluded a complete three-dimensional description of dynamic changes in length and orientation of both the muscle fascicles and tendinous components of skeletal muscle–tendon units in vivo.
The present study investigated the mechanisms by which passive skeletal muscle undergoes large changes in length. These mechanisms are of interest because they constrain the amount of movement available at joints, and because they mediate changes in joint mobility such as the transient increase in joint mobility seen immediately after muscle stretching (Duong et al. 2001) and the chronic reduction in joint mobility conferred by muscle contractures (Farmer & James, 2001).
At the shortest in vivo lengths, relaxed muscles can fall slack (i.e. they do not generate passive tension; e.g. Wei et al. 1986; Jahnke et al. 1989; Herbert & Gandevia, 1995; Narici et al. 1996; Scott et al. 1996; Herbert et al. 2002; Muraoka et al. 2005). When the muscle is lengthened, the slack is taken up. We recently used ultrasound imaging to measure the muscle–tendon length at which the slack was taken up in human gastrocnemius muscle fascicles during passive lengthening in vivo (Herbert et al. 2011). Measurements were obtained from three fascicles in one image plane from the left gastrocnemius muscles of 22 people. There was considerable between-fascicle variability in the muscle–tendon lengths at which the muscle fascicles fall slack. On the basis of this observation we hypothesised that when the gastrocnemius muscle–tendon unit is passively lengthened there is a progressive taking up of slack, first in some muscle fascicles then in others; i.e. there is progressive ‘engagement’ of muscle fascicles. (In the earlier paper we referred to this as progressive ‘recruitment’ of muscle fascicles but we now use the less ambiguous term ‘engagement’.)
Our observations of variability in the muscle–tendon lengths at which muscle fascicles fall slack do not constitute definitive evidence of the progressive engagement of relaxed muscle fascicles, for three reasons. First, measurements were obtained from three fascicles in one plane of each muscle, not from a representative sample of fascicles from the whole muscle. Second, it was not possible to determine how much of the variability was due to measurement error. It was shown that the variability was not due to error in measuring slack lengths from ultrasound images, but it was not possible to determine if the variability could have been due to other sources of error such as the error associated with positioning of the ultrasound transducer. Lastly, as only three fascicles were observed from each muscle, it was not clear whether the between-fascicle variability was due to variation within or between muscles.
The primary aim of the present study was to directly test the hypothesis that there is progressive engagement of relaxed muscle fascicles during passive lengthening of human gastrocnemius muscle–tendon units in vivo. To test that hypothesis, ultrasound images of the muscle were obtained while the muscle–tendon unit was passively lengthened, just as in our earlier study (Herbert et al. 2011). In contrast to the earlier study, muscle fascicles were sampled from many sites in the muscle to enable better estimation of within-muscle variability. In some muscles, duplicate measurements of fascicle slack lengths were obtained. The duplicate measurements were used to estimate measurement errors and, using that information, to estimate the true variability in the muscle lengths at which muscle fascicles fall slack.
We expected to find evidence of progressive engagement of relaxed muscle fascicles so we also designed the study to determine the topography (spatial pattern) of the muscle fascicle engagement. A three-dimensional motion analysis system was used to locate the ultrasound images of muscle fascicles in a leg-based frame of reference. The data were used to reconstruct changes in the length and orientation of muscle fascicles and aponeuroses as the muscle–tendon unit was passively lengthened. The data provide a rich description – perhaps the most complete description to date – of the mechanisms by which a skeletal muscle undergoes changes in length in vivo.
Methods
The procedures were approved by the South Eastern Sydney Local Health District Human Research Ethics Committee and the study was conducted according to the Declaration of Helsinki (2008).
Participants were 10 healthy young adults (mean age 29 years, range 18–46 years; mean mass 66 kg, range 52–82 kg; mean height 173 cm, range 163–186 cm; mean leg length 39.4 cm, range 37.0–46.5 cm). None had any known musculoskeletal pathology on the tested leg. All gave written, informed consent.
With the subject standing, the margins of the medial and lateral gastrocnemius muscle bellies of the left leg were palpated. Within those margins, 14 target sites were marked on the skin: 8 over the medial gastrocnemius muscle belly and 6 on the lateral gastrocnemius muscle belly (Fig.1A).
Figure 1.

Image locations and markers
A, locations of sites on the skin overlying the medial gastrocnemius (sites 1–8) and lateral gastrocnemius (sites 9–14). B, the triad of markers (small spheres) attached to the leg and used to define the leg frame of reference. C, the triad of markers attached to a plate fixed to the ultrasound transducers and used to determine the ultrasound image plane.
Subjects were then seated with the left knee flexed between 72 and 90 deg (the knee was not fully flexed because that prevented placement of the ultrasound transducers on the back of the leg) and the left foot was placed on the footplate of an isokinetic dynamometer (Cybex Norm with Humac, CSMi, Stoughton, MA, USA). The axis of the dynamometer was aligned with the axis of the ankle by minimising translations of the leg and foot that otherwise occurred when the foot was rotated. Surface electromyography (EMG) electrodes (diameter 30 mm, centre–centre spacing ∼35 mm) were placed over the bellies of the soleus and tibialis anterior muscles to provide measures of leg muscle activity.
For each trial, the dynamometer rotated the ankle from a fully plantarflexed position to a fully dorsiflexed position at 5 deg s–1. The ankle was subjected to at least three conditioning cycles before data were collected. An encoder in the dynamometer generated an analogue angle signal (the angle the sole of the foot made with the horizontal) which was sampled at 50 Hz. The angle the leg made with the horizontal, which was constant throughout each trial, was measured by placing a digital inclinometer on the anterior surface of the leg. Ankle angle was calculated as the difference between the leg angle and the foot angle. Ankle angles were less than 90 deg when the ankle was plantarflexed and greater than 90 deg when the ankle was dorsiflexed (i.e. increasing ankle angles corresponded to increasing muscle length). The EMG signal was amplified, band-pass filtered (10–500 Hz, 2nd order Butterworth), sampled at 2000 Hz, and displayed to the subject on a monitor. The subject was asked to remain completely relaxed throughout all trials. Data obtained from periods in which there was detectable EMG were excluded from all subsequent analyses.
Two ultrasound transducers (Esaote MyLab25 with LA522E 46 mm linear array, 7.5–12 MHz operating at 12 MHz; Esaote, Genoa, Italy) were used to generate images of the gastrocnemius muscle. The transducers were held together in a custom-built mould (Fig.1C). The use of two ultrasound transducers provided a wider field of view than would otherwise be possible (Herbert et al. 2011). During each trial the ultrasound transducers were manually positioned so that the middle of the proximal transducer was located over one of the 14 target sites. The order in which sites were tested was randomised. In five subjects, measurements at all 14 sites were repeated after the first 14 measurements had been made. In each trial the transducers were orientated to obtain the clearest possible image of a fascicle which terminated proximally under the middle of the proximal transducer. It was assumed that the plane in which the clearest image was obtained approximated the plane in which the muscle fascicle lay (Kwah et al. 2013 and references therein). In some trials the muscle moved underneath the transducer so it was necessary for the operator to rotate the transducer, usually by only a few degrees, to maintain a high-quality image; the conditioning trials were used to rehearse the rotation, if any was necessary. If it was not possible to obtain a good quality image when the transducer was positioned at the target site the transducer was moved to a nearby location where a better image could be obtained. Images from the two transducers were captured synchronously with a dual-channel video capture card at 10 Hz.
The location, in a laboratory-based frame of reference, of triads of reflective markers (diameter 11 mm) fixed to the leg and the ultrasound transducers (Fig.1B and C) were tracked at 100 Hz using nine infra-red cameras (Optitrack V100:R2, Natural Point, Corvallis, OR, USA). Marker coordinates were low-pass filtered with a 1 Hz, dual-pass, 4th-order Butterworth filter. These data were later used to locate the ultrasound images in a leg frame of reference. Spike2 software (CED, Cambridge, UK, with the S2video plug-in) was used to synchronise the acquisition of angle and EMG signals with ultrasound and camera data.
Analysis
The two ultrasound video sequences from each trial (one from each transducer) were stitched together to form a video sequence of composite images with a 111 mm field of view. There was an 18 mm gap in the middle of the image because the ultrasound images did not extend to the edge of the transducers (Herbert et al. 2011). In the first frame of the video sequence the proximal and distal ends of the target fascicle were identified. The two-dimensional image coordinates of those two points were tracked through the video sequence using a cross-correlation method (Herbert et al. 2011). Many fascicles could be tracked through only some of the whole movement, either because the ends of the fascicles moved outside the field of view or because sufficient image quality was not maintained for the whole movement. The image coordinates were then transformed into a three-dimensional transducer frame of reference defined by the triad of markers on the transducers. Then, using data on the location and orientation of both the transducers and leg in the laboratory frame of reference, the locations of the end of the muscle fascicles were transformed into a leg frame of reference defined by the triad of markers on the leg. One of the orthogonal axes of the leg frame of reference was parallel to the anterior margin of the tibia and therefore was also approximately parallel to the long axis of the gastrocnemius muscle. The other axes were orientated anteriorly and medio-laterally. The process of transforming the locations of the ends of muscle fascicles into a leg frame of reference was repeated for all frames from all 14 trials (n = 5 subjects), or all 28 trials (n = 5 subjects) from each muscle. For each subject, the data were then subsampled at common 0.5 deg ankle angles. In this way we were able to locate, for each muscle, the position of the proximal and distal ends of the 14 or 28 fascicles at each 0.5 deg increment in ankle angle.
The distance between the proximal and distal ends of each fascicle provided a measure of that fascicle's length. (Note that, therefore, ‘muscle fascicle length’ as defined here differs from the length of the path along the fascicle, which may have been curved. Here we use the term ‘muscle fascicle length’ differently to our earlier publications, where it referred to the length of the fascicle projected onto the long axis of the muscle.) Muscle–tendon length was estimated from knee angle and ankle angle using the equation derived by Grieve and colleagues from cadaver legs (Grieve et al. 1978). The relationship between fascicle length measured with ultrasonography (lf) and muscle–tendon length (Fig.2) estimated with Grieve's equation (lg) was fitted with a piecewise regression of the form:
where the subscript (FSL) means ‘at which the fascicle falls slack’ and the four Ci are regression coefficients. The values of lf(FSL), lg(FSL) and Ci were estimated using the user-written ‘slm’ function in MATLAB (D'Errico, 2012), which minimised the squared residuals subject to the constraint that the first derivative was positive at lg(FSL). This provided an excellent fit to the data (median r2 for every subject ≥0.99). The fitting procedure generates, for every muscle fascicle, two slack lengths: lf(FSL), the fascicle slack length, and lg(FSL), the muscle–tendon length at which the fascicle falls slack (Fig.2).
Figure 2.

Change in muscle fascicle length with passive change in muscle–tendon length
Muscle fascicle length measured with ultrasound, as a function of muscle–tendon length calculated from ankle and knee angles, for seven fascicles from a single subject whose ankle was rotated from 66 to 100 deg with the knee flexed 80 deg. The diamonds indicate slack lengths. The muscle–tendon length (horizontal coordinate) of each diamond is the muscle–tendon length at which a fascicle falls slack (lg(FSL)), and the muscle fascicle length (vertical coordinate) of each diamond is the fascicle slack length (lf(FSL)).
An analysis was conducted to determine whether there were differences between fascicles within an individual muscle. This analysis was applied to the following variables: the muscle–tendon lengths at which fascicles fall slack, fascicle lengths, and the two-dimensional measure of pennation (described below). For each of these two variables we obtained a pooled estimate of the within-muscle variance by calculating the weighted average of the variance of the fascicles in each muscle. The within-muscle variance consists of both true between-fascicle heterogeneity and measurement error. An estimate of the error variance was obtained from the five subjects for whom each target site was tested twice. This analysis was conducted on pairs of trials nominally conducted at the same target site. If the location of the proximal end of the fascicle in the first frame of each of the two trials differed by <10 mm, that pair was included in the analysis of error. Each pair provided an estimate of the error variance, and these estimates were averaged to provide a pooled estimate of the error variance (Appendix). Non-parametric bootstrapping (Efron & Tibshirani, 1993) was used to generate confidence intervals for the variance estimates. The null hypotheses of no difference between subjects, muscles (medial or lateral) and sites (1–14) was tested with a three-way (subject by muscle by site) analysis of variance with repeated measures on the muscle and site factors.
The coordinates of the ends of the muscle fascicles were used to define the surfaces of the superficial (proximal) and deep (distal) aponeuroses in each video frame. The surfaces were fitted with a function that was a quadratic polynomial in both the longitudinal and medio-lateral directions (defined with respect to the leg frame of reference):
where z, x and y are the antero-posterior, medio-lateral and proximo-distal coordinates, respectively, and a, b, c, d, e and f are constants determined by least squares optimisation. The interaction term (x.y) permits the transverse orientation of the aponeuroses to change along the longitudinal axis. This function was found to provide a suitable compromise between simplicity and goodness of fit. The transverse curvature of the aponeurosis is the second partial derivative with respect to x (= 2c) and the longitudinal curvature of the aponeurosis is the second partial derivative with respect to y (= 2e).
The translations of the superficial and deep aponeuroses were determined by calculating the longitudinal (distal) displacements of their centroids in the leg frame of reference. Muscle thickness was defined as the mean of the antero-posterior components of the muscle fascicles.
A two-dimensional measure of the pennation of each fascicle was obtained from the ultrasound images. This involved fitting a line between the ends of the fascicle, fitting a cubic spline to the aponeuroses, and then taking the mean of the included angles between the fascicle and the tangent of the aponeurosis at the two ends of the fascicle. Measures were also obtained of the acute angle, in three dimensions, between each fascicle and the long axis of the muscle (‘fascicle alignment’). We attempted to obtain a three-dimensional measure of pennation by fitting a line between the ends of the fascicle, determining the tangent plane of the aponeuroses at the point where the fascicle intersected the aponeurosis, and then taking the mean of the included angles between the line of the fascicle and tangent plane of the aponeurosis at the two ends of the fascicle (similar to the approach used by Lee et al. 2014). However, three-dimensional measures of muscle pennation were noisy, perhaps because the aponeurosis data were fairly sparse. Consequently only two-dimensional measures of pennation are reported.
Strains in fascicles and aponeuroses were calculated as follows. ‘True’ (large deformation) fascicle strains (εf) were calculated as ln(lf/lf(FSL) − 1). To calculate the true longitudinal strains of the superficial aponeurosis, the location of the proximal ends of the fascicles were identified. The longitudinal displacement between each pair of fascicle endings on the superficial aponeurosis was divided by the longitudinal displacement between the same pair of points at fascicle slack length. Subtracting 1 from this ratio and taking the natural logarithm gave the longitudinal strain between that pair of points. A single estimate of longitudinal strain of the superficial aponeurosis was calculated by taking a weighted average of the strains of all pairs of points, where the weight was the square of the initial longitudinal distance between that pair. The weighting reduces the noise introduced by pairs with very small initial displacements. The same approach was used to calculate strains in the deep aponeurosis. Aponeurosis strains were calculated only for the five subjects tested at 28 sites (not for the other five subjects tested at only 14 sites).
It would be interesting to quantify transverse strains in the aponeuroses but this proved difficult because it is possible that the medial and lateral parts of the gastrocnemius muscle move together or move apart during passive lengthening. Consequently interpretable measures of transverse strains would have required separate quantification of the transverse strains in the aponeuroses of the medial and lateral muscles. There were too few data points to do this reliably, so transverse strains have not been reported.
Results
Muscle lengths at which fascicles fall slack
Video S1 in the online Supporting information shows an example of a video sequence of ultrasound images obtained as the muscle was lengthened passively. Tracked coordinates from the videos were used to determine how fascicle lengths changed with muscle length.
When the gastrocnemius muscle–tendon unit was passively lengthened by dorsiflexing the ankle, muscle fascicle lengths initially did not change (Fig.2). This confirms that the fascicles were slack at short muscle–tendon lengths (see Discussion). In all subjects, fascicles began to lengthen (i.e. the slack was taken up) between 18 and 52% of the individual's in vivo range of muscle–tendon lengths (mean of 142 fascicles, excluding repeat measures = 33%; Fig.3A and Table1). The convention used here is that 0% of the in vivo range of muscle–tendon lengths was attained when the knee was fully flexed (135 deg) and the ankle was fully plantarflexed. One hundred per cent of range was attained when the knee was fully extended (0 deg) and the ankle was as dorsiflexed as much as it could be with the knee extended. The mean muscle–tendon length at which fascicles fell slack varied across subjects from 25 to 40% of the in vivo range. The pooled estimate of the within-muscle variance of the muscle–tendon lengths at which fascicles fell slack was 42% for the medial gastrocnemius and 38% for the lateral gastrocnemius (Table2).
Figure 3.

Variation in the measured muscle–tendon lengths at which fascicles fall slack (A and D), fascicle slack lengths (B and E) and a two-dimensional measure of pennation (C and F)
A–C are histograms of data from muscle fascicles in 10 subjects (142 fascicles for A and B, and 159 fascicles for C). Measurements that were repeated at each site have not been included in A–C. D–F show pairs of repeated measurements made on 22 fascicles (D and E) or 23 fascicles (F) from 5 subjects. Shading differentiates the 5 subjects’ data (S1, S2, … S5). Vertical lines connect the pair of measurements made at a single site in one subject.
Table 1.
Distributions of slack lengths and pennations of muscle fascicles from the medial and lateral gastrocnemius muscles
| Both medial and lateral gastrocnemius |
Medial gastrocnemius |
Lateral gastrocnemius |
|||||||
|---|---|---|---|---|---|---|---|---|---|
| Mean | SD | n | mean | SD | n | Mean | SD | n | |
| lg(FSL) (%)a | 33 | 7 | 142 | 33 | 7 | 85 | 33 | 7 | 57 |
| lf(FSL) (mm)b | 40 | 8 | 142 | 39 | 8 | 85 | 43 | 8 | 57 |
| 2-D pennation (deg)c | 17 | 6 | 159 | 19 | 6 | 93 | 14 | 3 | 66 |
Data are from 10 subjects.
Muscle–tendon length at which fascicles fall slack, expressed as a percentage of the in vivo range of lengths.
Fascicle slack length, in mm.
Two-dimensional pennation. It was not always possible to detect slack lengths so there are fewer observations for slack lengths than for pennation.
Table 2.
Variation in slack lengths and pennations of muscle fascicles from the medial and lateral gastrocnemius muscles
| Within-muscle variance |
P |
|||||
|---|---|---|---|---|---|---|
| Medial gastrocnemius | Lateral gastrocnemius | Error variancea | Subject | Muscle | Site | |
| lgs (%)b | 42 (31–52) | 38 (22–55) | 29 (13–44) | <0.001 | 0.85 | 0.58 |
| lfs (mm2)c | 44 (28–60) | 49 (33–65) | 34 (7–61) | <0.001 | 0.26 | 0.61 |
| 2-D pennation (deg)d | 24 (17–30) | 10 (7–14) | 8 (4–12) | <0.001 | <0.001 | <0.001 |
Data are variances and P values obtained from data from 10 subjects.
Calculated using eqn in the Appendix, assuming that the errors on repeated scans are independent (i.e. assuming  ).
).
Muscle–tendon length at which fascicles fall slack, expressed as a percentage of the in vivo range of lengths.
Fascicle slack length, in mm.
Two-dimensional pennation. Values in parentheses are 95% confidence limits. P values are from a three-way ANOVA (10 subjects × 2 muscles (medial or lateral gastrocnemius) × 14 sites) with repeated measures on the muscle and site factors.
There were 22 pairs (repeats) of measurements of the muscle–tendon length at which fascicles fell slack (Fig.3D). The pooled estimate of the variance of the pairs of measurements (i.e. the error variance) was 29%. This is over two-thirds of the within-muscle variance, suggesting that most of the variability in the muscle–tendon lengths at which fascicles fell slack can be attributed to measurement error (see Discussion). A three-way ANOVA (10 subjects × 2 muscles (medial or lateral gastrocnemius) × 14 sites) with repeated measures on the muscle and site factors showed that there were significant between-subject differences in the mean muscle–tendon length at which fascicles fell slack. Importantly, the effects of muscle and site were not statistically significant (Table2). Thus there was no evidence that fascicles at any particular site consistently fell slack at different muscle–tendon lengths to fascicles at other sites.
Fascicle slack lengths
Fascicle slack lengths varied from 24 to 65 mm (mean 40 mm; Fig.3B) and individual subject's mean fascicle slack lengths varied from 31 to 45 mm. The pooled estimate of the within-muscle variance of fascicle slack lengths was 44 mm2 for the medial gastrocnemius and 49 mm2 for the lateral gastrocnemius, and the pooled estimate of the error variance was 34 mm2 (Fig.3D and Table2). Again there were significant between-subject differences in fascicle slack lengths but the effects of muscle and site were not statistically significant. There was no correlation between fascicle slack lengths and the length of the muscle at which the fascicles fell slack (r2 = 0.001).
Pennation at slack lengths
Two-dimensional pennation angles at slack lengths varied from 6 to 31 deg (mean 17 deg; Fig.3C) and individual subject's mean pennation at slack lengths varied from 14 to 22 deg. The medial gastrocnemius fascicles were more pennate (mean 19 deg) than the lateral gastrocnemius fascicles (mean 14 deg). The pooled estimate of the within-muscle variance of pennation at slack lengths was 24 deg2 for the medial gastrocnemius and 10 deg2 for the lateral gastrocnemius, and the error variance was 8 deg2 (Fig.3F and Table2). There were significant effects of subject, muscle and site on 2-D measures of muscle pennation (Table2).
Changes in fascicle length and pennation above slack length
Video S2 in the online Supporting information shows an animation of the muscle fascicles during passive lengthening. The fascicles have been colour-coded to indicate muscle fascicle strains. While some differences between fascicles are apparent in individual subjects, no consistent pattern of regional differences was seen across muscles. This is corroborated by Fig.4A which shows that, averaged across muscles, the relationship between change in fascicle length and change in muscle–tendon length was nearly identical for the 14 sites. Averaged across fascicles and subjects, mean fascicle strain was 22% at 60% of the in vivo range of muscle–tendon lengths (the most stretched muscle–tendon length at which data were obtained for most fascicles; Fig.4B). Both two-dimensional pennation (Fig.4C) and fascicle alignment with respect to the long axis of the muscle (Fig.4D) decreased at all sites, on average by 3 deg for pennation and 4 deg for fascicle alignment, as muscle–tendon lengths increased from 20% to 60% of the in vivo range of lengths. Decreases in pennation and fascicle alignment were small and similar across sites.
Figure 4.

Regional differences in muscle fascicles
A, change in fascicle length. B, true fascicle strain (100 × ln [lf/lf(FSL) − 1]). C, pennation. D, fascicle alignment (the angle fascicles make with the long axis of the muscle). In each panel there are 14 curves, each of which is the average, across all subjects, from one site in the muscle (Fig.1) as a function of muscle–tendon length (repeated measurements were not included). Muscle–tendon length has been expressed as a percentage of the in vivo range of lengths. In C and D, continuous lines are sites in the medial gastrocnemius and dashed lines are sites in the lateral gastrocnemius.
Behaviour of aponeuroses
Video S3 in the online Supporting information shows changes in the size, shape and orientation of the central parts of the superficial (proximal) and deep (distal) aponeuroses as a muscle–tendon unit was passively lengthened from ∼20 to 70% of its in vivo range of lengths. The quadratic surface provided a good fit to the aponeuroses: there was no apparent pattern in the residuals of the surface fits to the aponeuroses, and the mean of the root mean square errors of the fits to the superficial and deep aponeuroses of all muscles at all muscle–tendon lengths was 5.1 mm.
The aponeuroses were concave anteriorly. Most of the concavity was in the transverse dimension (mean transverse curvature of the superficial and deep aponeuroses of all muscles at all muscle–tendon lengths = 0.035) − they were nearly flat in the longitudinal dimension (mean longitudinal curvature = 0.008). There was little systematic change in either the longitudinal or transverse curvature with increases in muscle length.
Initially, as the muscle–tendon unit lengthened from very short lengths, the centroids of both the superficial and deep aponeuroses remained stationary in the leg frame of reference (that is, the initial part of the curves in Fig.5A and B are flat). This suggests that the initial lengthening of the muscle–tendon unit that occurs before the slack is taken up is caused by elongation of the slack tendon. Then, at lengths close to the mean of the muscle–tendon lengths at which all fascicles fell slack, both the superficial and deep aponeuroses began to move distally in the leg frame of reference (Fig.5A and B). The superficial aponeurosis translated less than the deep aponeurosis (Fig.5C). The difference in translation of the centroids of the superficial and deep aponeuroses provides a measure of the mean longitudinal elongation of muscle fascicles. The ratio of the change in the longitudinal elongation of muscle fascicles and the change in muscle–tendon length above slack length provides a measure of the contribution of changes in length and alignment of muscle fascicles to the total change in muscle–tendon length above slack length. The mean contribution of muscle fascicles to the total change in muscle–tendon length was 52% (SD 19%) at 60% of the in vivo range (Fig.6).
Figure 5.
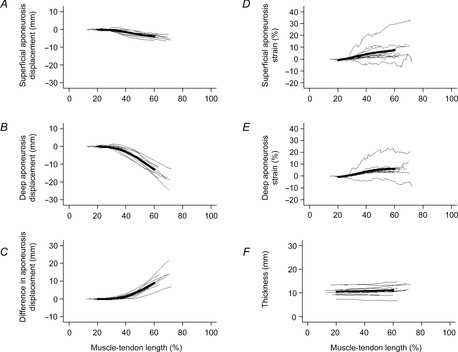
Displacement of and strains in aponeuroses during passive lengthening
A, distal displacement of the centroid of the superficial aponeurosis. B, distal displacement of the centroid of the deep aponeurosis. C, difference in the distal displacements of the centroids of the superficial and deep aponeuroses. D, longitudinal strain of the superficial aponeurosis. E, longitudinal strain of the deep aponeurosis. F, muscle thickness. Each of the thin lines in each panel represents data from a single muscle. The heavy line is a lowess smoothed curve fitted through all data between 20% and 60% of the in vivo range of muscle lengths.
Figure 6.

Contributions of change in muscle fascicle length and pennation to change in muscle–tendon length
Each of the thin lines in each panel is composed of data from a single muscle. The heavy line is a lowess smoothed curve fitted through all data between the shortest muscle–tendon length at which any of the muscles fell slack and 60% of the in vivo range of muscle–tendon lengths. The contribution is calculated as the ratio of the changes, above mean slack length, of the difference in the longitudinal displacement of the centroids of the superficial and deep aponeuroses and the change in muscle–tendon length.
As the aponeuroses translated distally they also elongated (Fig.5D and E). Above the mean muscle–tendon length at which fascicles were slack, the superficial and deep aponeuroses experienced longitudinal strains that increased approximately linearly with muscle–tendon length to mean values of 6.1% and 4.0%, respectively, at 60% of maximal in vivo muscle–tendon lengths.
Muscle thickness remained remarkably constant during passive lengthening (Fig.5F). Averaged across all muscles, thickness increased from 10 mm to 11 mm as the muscle–tendon unit was lengthened from 20% to 60% of the in vivo range of muscle–tendon lengths.
Discussion
This study used a novel, quasi-three-dimensional ultrasound imaging method to test the hypothesis that there is progressive engagement (i.e. recruitment) of relaxed muscle fascicles during passive lengthening of a relaxed human skeletal muscle. There was little evidence of progressive engagement of muscle fascicles in relaxed human gastrocnemius muscle in vivo – the slack is taken up nearly simultaneously in all muscle fascicles. Using dynamic three-dimensional reconstructions of the muscle and aponeuroses we found that, above slack length, increases in the length of the relaxed muscle–tendon unit are due to elongation of both the aponeuroses and extramuscular tendons in approximately equal measure.
Slack in muscles
Over about the shortest one-third of the full range of in vivo muscle–tendon lengths, changes in muscle–tendon length were not accompanied by changes in fascicle length. There would appear to be only two possible explanations:1 the fascicles are orders of magnitude stiffer than the tendons over one-third of the physiological range of muscle–tendon lengths, and 2 there is negligible tension in the fascicles (i.e. the fascicles are slack). These explanations are not mutually exclusive. Loram et al. (2007) reported that when very small passive stretches (0.15 deg) were applied to the relaxed human ankles with the knees extended and the ankles close to a plantargrade position (that is, at ∼80% of the in vivo range of muscle–tendon lengths) the muscle fascicles were approximately 12 times stiffer than the tendinous structures (extramuscular tendons plus aponeuroses). With stretches greater than 0.4 deg the muscle fascicles demonstrated yielding (i.e. became less stiff), and with stretches of 7 deg the muscle fascicles demonstrated similar stiffness to the tendinous structures. These findings are consistent with findings from studies on isolated muscle in vitro which show that muscle fibres are very stiff when subject to small amplitude stretches but become more compliant when stretched more than ∼1% of optimal length or 1% of isometric twitch tension (e.g. Hill, 1968; Haugen & Sten-Knudsen, 1981). In our experiments muscle fascicle length did not change until the ankle had been rotated on average 14 deg (the largest mean for a subject was 21 deg), which is more than 30% of the shortest in vivo fascicle length (see, for example, Fig.5). Given that muscle fibres exert a short-range elastic stiffness over only a very small range of fibre lengths and tensions, it would appear unlikely that the muscle fascicles could maintain a high stiffness over a 14 deg range of ankle angles unless they and their tendons remained slack. We therefore assume that changes in muscle–tendon length which were not accompanied by changes in fascicle length were indicative of slack in both muscle fascicles and tendinous structures.
Why, if both the muscle fascicles and the tendinous structures are slack, do fascicle lengths remain constant? Or, stated another way, why does all of the increase in length in slack muscle–tendon units occur in tendinous structures? The explanation probably lies in the short-range elastic behaviour of muscle fascicles. When the muscle is slack, the muscle–tendon unit can be elongated without developing tension. The short-range elastic behaviour ensures the muscle fascicles are stiff, even though they are under no tension. Consequently when the slack muscle is lengthened all of the increase in length occurs in the tendinous structures. The mechanism by which tendinous structures lengthen under no tension is not completely clear but some sort of buckling – either macroscopic or microscopic – is likely. We have previously demonstrated macroscopic buckling of aponeuroses in some subjects (Herbert et al. 2011). It is possible that even in those subjects in whom macroscopic buckling was not observed there was buckling in tendinous structures that was not imaged.
Variability of the muscle length at which fascicles fall slack
In the current study, measurements were obtained from 14 sites distributed throughout the gastrocnemius muscle, so the current study provides better estimates of between-fascicle variability than our previous study which sampled from just three sites in one plane in each muscle. Another improvement over the previous study was that repeated measurements were obtained, making it possible to estimate measurement errors and partition out the contribution of measurement errors to the observed variability between fascicles.
There was considerable between-fascicle variability in measurements of the muscle–tendon lengths at which the slack was taken up. However, the within-muscle variances of the measurements (38% for the medial gastrocnemius and 42% for the lateral gastrocnemius) were not much greater than the error variance (29%). If the measurement errors are independent of true values, and if errors in the first measurement are independent of errors in the second, the true variance of muscle–tendon length at which fascicles fall slack is simply the between-fascicle variance minus the error variance (Appendix). This would imply the SD of the true muscle–tendon lengths at which the fascicles fell slack was just 3% of the in vivo range of muscle–tendon lengths for medial gastrocnemius and 4% of the range for lateral gastrocnemius. Relaxing the assumption of independence (Appendix) made little difference to these estimates: the SD calculated in all sensitivity analyses was less than 7.2%. These observations refute our hypothesis of progressive engagement of muscle fascicles, at least in the human gastrocnemius muscle. Slack is taken up by the fascicles over a narrow range of muscle–tendon lengths. The implication is that the slack length of the muscle is determined by all muscle fascicles, not just by a small sub-population of the first-engaged fascicles. Another implication is that, above slack length, the passive compliance of the muscle–tendon unit is determined by all fascicles, not just by a sub-population of the first-engaged fascicles. While these conclusions hold under the physiological conditions investigated here, it is possible that fascicles behave less homogeneously under pathological conditions.
Our conclusions are based on the assumption that the discrepancies between repeated measurements were due to measurement error. A competing explanation is that the discrepancies occurred because the repeat measurement was not obtained from exactly the same fascicles as the first measurement (i.e. the transducer location was not replicated exactly). In that case the discrepancy could be due to both measurement error and true between-fascicle variability. However, the discrepancies between repeated measurements appeared to be independent of the distance between the location of repeated measurements (data not shown). This suggests that the estimates of measurement error were not inflated by inexact replication of the location of the transducers. A corollary is that estimates of the true between-fascicle variation in the muscle–tendon length at which the fascicles fell slack were not underestimated by inexact replication of the location of the transducers.
If, as we argue, the between-fascicle variation in the apparent muscle–tendon lengths at which muscle fascicles fall slack is largely or entirely due to measurement error, the mean of the measurements obtained from multiple muscle fascicles is likely to provide a good estimate of the muscle–tendon lengths at which all fascicles fall slack. It would be expected that this length coincides with the slack length of the muscle–tendon unit. The mean muscle–tendon length at which the muscle fascicles fell slack ranged across participants from 25% to 40% of the in vivo range, and the mean of the subject's means was 33%. This value falls between the gastrocnemius muscle–tendon slack length estimated with Hoang's method (∼25%; Hoang et al. 2007) and the slack length inferred from observations reported by Muraoka and colleagues (∼50%; Muraoka et al. 2005; Herbert et al. 2011).
Mechanisms of increases in muscle length
The methods used here made it possible to track the three-dimensional locations of the ends of up to 28 muscle fascicles. Consequently it was possible to quantify the contribution of a representative sample of muscle fascicles to the total change in muscle–tendon length, properly accounting for three-dimensional changes in fascicle orientation. Changes in muscle fascicle length and orientation were found to contribute 52% of the total change in muscle–tendon length observed when the muscle–tendon unit was stretched to 60% of its in vivo length. This is very similar to the value reported by Loram et al. (2007) for 7 deg passive displacements at approximately 80% of the in vivo range of muscle–tendon lengths (they reported the ratio of muscle fascicle and tendon stiffness to be 1, implying a muscle fascicle contribution of 50%). It is somewhat larger than the estimate of a 27% contribution obtained at 70% of the in vivo length reported in our earlier study (Herbert et al. 2011). In that study two-dimensional measurements were made on three fascicles in a single image plane of each muscle. The estimate in the present study would appear to be more robust both because it is based on many more measurements and because the muscle–tendon length at which fascicles fall slack has been better estimated.
The three-dimensional locations of the ends of the muscle fascicles also provided estimates of aponeurosis strains, although strain data in some subjects were noisy (Fig.5D and E). On average, the superficial aponeuroses strained 6.1% and the deep aponeurosis strained 4.0% at 60% of the in vivo range of muscle–tendon lengths. These values cannot be compared directly with published reports because most reports of aponeurosis strains in human muscles in vivo are obtained from contracting muscles (e.g. Magnusson et al. 2001) and the aponeurosis force–length relationship may be quite different in passive and active conditions (Zuurbier et al. 1994; Azizi & Roberts, 2009). In the few studies which have reported aponeurosis strains under passive conditions, the reference length is usually defined as the aponeurosis length at an intermediate joint angle. The use of such arbitrary reference lengths is problematic because the choice of reference length has a large effect on measured strains. In the current study, the reference lengths used to calculate aponeurosis strains were not arbitrary – they were measured when the fascicles in series with the aponeurosis were demonstrably slack. This may explain why the strains we observed under passive conditions are similar to tendon failure strains or strains at maximum isometric tension reported in some earlier studies (Zajac, 1989).
The centroid of the superficial aponeurosis underwent only a small distal translation as the muscle was passively lengthened (Fig.5A). This suggests that most of the longitudinal deformation of tendinous structures occurs in the deep aponeurosis or the Achilles’ tendon.
Other findings
Increases in muscle–tendon length were accompanied by only small changes in pennation angle and fascicle orientation. Although data on fascicle orientations are noisy, it appears that changes in the orientation of muscle fascicles during passive lengthening are very small and contribute little to the total increase in muscle–tendon length.
The thickness of the muscle remained nearly constant as the muscle–tendon unit was lengthened from slack lengths to 60% of the in vivo range of lengths (Fig.5F). Over the same range of muscle lengths, muscle fascicles underwent strains of 22%. If, as expected, the volume of the muscle remains nearly constant with muscle changes in length, then a constant muscle thickness would imply a mean transverse muscle strain of about −22%. Direct measurement of transverse strains is difficult because the two heads of the gastrocnemius could move together or apart during passive lengthening.
Method
In the past few years a number of sophisticated methods have been developed to non-invasively measure deformation of human skeletal muscles in vivo. Of particular note are the technically impressive quasi-three-dimensional ultrasound-based methods developed by Rana and Wakeling (Rana & Wakeling, 2011) and the velocity-encoded phase-contrast MRI methods developed by Sinha and colleagues (Finni et al. 2003). The simpler methods used here have both advantages and limitations compared to those methods.
A significant advantage of the method described here is its good temporal resolution. For the current study, in which slow stretches were applied to the muscle, images were collected at 10 Hz. Much higher sampling rates, of the order of 4 kHz, are attainable with existing ultrasound systems (Nordez et al. 2009). The good temporal resolution makes the method suitable for studying changes in muscle architecture accompanying dynamic phenomena such as muscle stretch or changes in muscle activation. This is probably not possible with the other quasi-three-dimensional ultrasound method (Rana & Wakeling, 2011) but is possible with phase-contrast MRI (Finni et al. 2003). The sampling frequency of the current method also permits temporal smoothing which could partially offset the relatively poor spatial resolution. A second advantage is that, because images are obtained in a plane that is notionally the plane in which muscle fascicles lie, the method provides direct visualisation of individual fascicles, in contrast to the alternative approaches which involve reconstructing fascicles as they traverse across parallel images. Finally, ultrasonography provides good visualisation of tendinous structures, unlike MRI which provides only a weak tendon signal. So ultrasound-based methods, including the method described here, may provide a better way to examine deformations in tendinous structures than MRI.
There are, however, several distinct limitations to the current ultrasound-based method. It has already been noted that ultrasound has a much lower spatial resolution than MRI. Another limitation is that standard ultrasound systems only provide planar images, so it must be assumed that the muscle fascicles lie in the image plane. To the extent that the ultrasonographer does not align the image plane with the ends of the muscle fascicles, measurements of fascicle lengths are potentially biased. Many researchers, including us, have assumed that if the ultrasound image quality is good the muscle fascicles must lie close to the image plane. We recently tested that assumption by comparing our ultrasound-based measurements with three-dimensional diffusion tensor imaging-based reconstructions of the human medial gastrocnemius muscle (B. Bolsterlee, H. E. Veeger, F. C. van der Helm, S. C. Gandevia & R. D. Herbert, unpublished observations). It was shown that the muscle fascicles lie quite close to the ultrasound image plane (mean absolute error <6 deg). It was also shown that, while ultrasound-based measurements of fascicle length were imprecise, there was little systematic error in the measurements (mean error 1.8 mm or 3%).
A specific limitation of the current method is that it was difficult or impossible to obtain high-quality images of muscle fascicles that terminated close to the margins of the aponeuroses. As a consequence it was not possible to reconstruct the whole muscle. In this respect, Rana and Wakeling's ultrasound-based method and the velocity-encoded phase-contrast MRI method are superior to ours – both those approaches provide data on the architecture of the entire muscle. If muscle fascicles at the margins of the aponeurosis behaved differently to more centrally located fascicles our measurements of fascicle behaviour may have been biased. Also, if the margins of the aponeuroses experienced different strains to more central parts of the aponeuroses, these estimates of aponeurosis strains could be biased. Other limitations were that the data were too sparse to provide good estimates of transverse aponeurosis strains and too noisy to provide reliable information about regional strain differences. We are currently attempting to collect data from more locations with better spatial resolution to measure transverse aponeurosis strains and compare strains at different regions on the aponeuroses.
This study shows, contrary to our initial hypothesis, that muscle fascicles in the human gastrocnemius muscles are not progressively ‘engaged’ when the muscle is passively lengthened. It might be expected that if progressive engagement does not occur in the architecturally complex gastrocnemius it is unlikely to occur in architecturally more simple muscles. However, this is yet to be tested. It was also shown, using a novel quasi-three-dimensional ultrasound-based method, that elongation of muscle fascicles and tendinous structures contribute roughly equally to the total change in muscle–tendon length under passive conditions, at least over the range of muscle–tendon lengths that was investigated. Changes in the three-dimensional alignment of muscle fascicles and the curvature of aponeuroses have a negligible contribution to change in muscle–tendon length.
Appendix Calculation of the true variance of muscle lengths at which fascicles fall slack
Measures of the muscle lengths at which individual muscle fascicles fell slack (Mi) were obtained using ultrasonography. Some measurements were repeated (MiA and MiB).
We want to estimate the true variance of muscle lengths at which fascicles fall slack, var[Ti], or its square root, SD[Ti]. However, we do not observe the true values. Instead we observe the values contaminated by measurement error: Mi = Ti + ei.
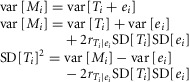 |
(1) |
where  is the correlation between the true measurement and the error. SD[ei] is related to differences between the repeated measures because MiA = Ti + eiA and MiB = Ti + eiB, so MiB − MiA = eiB − eiA. Therefore:
where  is the correlation between the errors in the first and second measurements. The error variances of the first and second measurements are expected to be exchangeable. So:
| (2) |
| (3) |
Substituting eqns 2 and 3 into eqn 1 gives:
This is a quadratic equation whose solutions are:
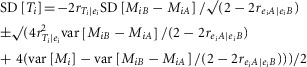 |
(4) |
We can obtain values for var[Mi] and var[MiB – MiA] from the data and find positive real values for SD[Ti] provided the two correlations can be specified. Neither is known but both are likely to be close to zero (the errors are likely to be nearly independent of the true values, and the errors in one measurement are likely to be nearly independent of errors in another). Any non-zero correlation between measurement errors is likely to be positive. In the primary analysis we assumed independence, so:
| (5) |
Equation 4 was used to conduct a sensitivity analysis in which  was varied from −0.3 to 0.3 and
  was varied from 0 to 0.3 (Fig.7).
Figure A1.
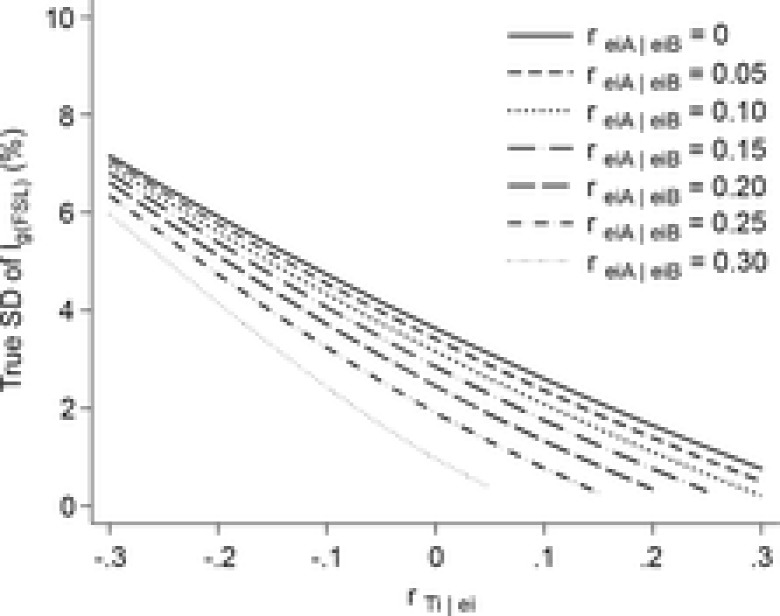
Sensitivity analysis
Sensitivity analysis showing the relationship between estimates of the variability (SD) of muscle lengths at which fascicles fall slack and the two error correlations,  and reiA|eiB. There was little variability in the muscle lengths at which fascicles fall slack (SD < 7.2%) across the ranges of plausible correlations (−0.3 <
  , and 0 < reiA|eiB < 0.3).
Additional information
Competing interests
None of the authors have any conflicts of interests.
Author contributions
Conception and design of the experiments: R.D.H., J.D., S.C.G., G.A.L. All authors contributed to collection, analysis and interpretation of data. All authors contributed to drafting the article and revising it critically for important intellectual content. All authors have read and approved the final submission. Experiments were conducted at Neuroscience Research Australia (NeuRA), Sydney, Australia.
Funding
The project was supported by a programme grant from the Australian NHMRC (APP1055084). R. D. Herbert, L. E. Bilston and S. C. Gandevia are supported by NHMRC research fellowships.
Supporting Information
The following supporting information is available in the online version of this article.
Video sequence showing changes in length of medial gastrocnemius muscle fascicles.
Animation of gastrocnemius muscle fascicles during passive lengthening.
Animation of the superficial and deep aponeuroses during passive lengthening.
References
- Azizi E. Roberts TJ. Biaxial strain and variable stiffness in aponeuroses. J Physiol. 2009;587:4309–4318. doi: 10.1113/jphysiol.2009.173690. [DOI] [PMC free article] [PubMed] [Google Scholar]
- Baskin RJ. Paolini P. Volume change accompanying passive stretch of frog muscle. Nature. 1964;204:694–695. doi: 10.1038/204694a0. [DOI] [PubMed] [Google Scholar]
- D'Errico J. SLM-shape language modeling. 2012. In http://www.mathworks.com.au/matlabcentral/fileexchange/24443-slm-shape-language-modeling, accessed 30 October 2013.
- Duong B, Low M, Moseley AM, Lee RY. Herbert RD. Time course of stress relaxation and recovery in human ankles. Clin Biomech. 2001;16:601–607. doi: 10.1016/s0268-0033(01)00043-2. [DOI] [PubMed] [Google Scholar]
- Efron B. Tibshirani R. An Introduction to the Bootstrap. New York: Chapman & Hall; 1993. [Google Scholar]
- Elek J, Prochazka A, Hulliger M. Vincent S. In-series compliance of gastrocnemius muscle in cat step cycle: do spindles signal origin-to-insertion length. J Physiol. 1990;429:237–258. doi: 10.1113/jphysiol.1990.sp018254. [DOI] [PMC free article] [PubMed] [Google Scholar]
- Farmer SE. James M. Contractures in orthopaedic and neurological conditions: a review of causes and treatment. Disabil Rehabil. 2001;23:549–558. doi: 10.1080/09638280010029930. [DOI] [PubMed] [Google Scholar]
- Finni T, Hodgson JA, Lai AM, Edgerton VR. Sinha S. Nonuniform strain of human soleus aponeurosis-tendon complex during submaximal voluntary contractions in vivo. J Appl Physiol (1985) 2003;95:829–837. doi: 10.1152/japplphysiol.00775.2002. [DOI] [PubMed] [Google Scholar]
- Fukunaga T, Kawakami Y, Kuno S, Funato K. Fukashiro S. Muscle architecture and function in humans. J Biomech. 1997;30:457–463. doi: 10.1016/s0021-9290(96)00171-6. [DOI] [PubMed] [Google Scholar]
- Gillis GB, Flynn JP, McGuigan P. Biewener AA. Patterns of strain and activation in the thigh muscles of goats across gaits during level locomotion. J Exp Biol. 2005;208:4599–4611. doi: 10.1242/jeb.01940. [DOI] [PubMed] [Google Scholar]
- Grieve D, Pheasant S. Cavanagh PR. Prediction of gastrocnemius length from knee and ankle posture. In: Jorgensen K, editor; Asmussen E, editor. Biomechanics VI: Proceedings of the Sixth International Congress of Biomechanics, Copenhagen, Denmark. Baltimore: University Park Press; 1978. [Google Scholar]
- Haugen P. Sten-Knudsen O. The dependence of the short-range elasticity on sarcomere length in resting isolated frog muscle fibres. Acta Physiol Scand. 1981;112:113–120. doi: 10.1111/j.1748-1716.1981.tb06793.x. [DOI] [PubMed] [Google Scholar]
- Herbert RD, Clarke J, Kwah LK, Diong J, Martin J, Clarke EC, Bilston LE. Gandevia SC. In vivo passive mechanical behaviour of muscle fascicles and tendons in human gastrocnemius muscle–tendon units. J Physiol. 2011;589:5257–5267. doi: 10.1113/jphysiol.2011.212175. [DOI] [PMC free article] [PubMed] [Google Scholar]
- Herbert RD. Gandevia SC. Changes in pennation with joint angle and muscle torque: in vivo measurements in human brachialis muscle. J Physiol. 1995;484:523–532. doi: 10.1113/jphysiol.1995.sp020683. [DOI] [PMC free article] [PubMed] [Google Scholar]
- Herbert RD, Moseley AM, Butler JE. Gandevia SC. Change in length of relaxed muscle fascicles and tendons with knee and ankle movement in humans. J Physiol. 2002;539:637–645. doi: 10.1113/jphysiol.2001.012756. [DOI] [PMC free article] [PubMed] [Google Scholar]
- Hill DK. Tension due to interaction between the sliding filaments in resting striated muscle. The effect of stimulation. J Physiol. 1968;199:637–684. doi: 10.1113/jphysiol.1968.sp008672. [DOI] [PMC free article] [PubMed] [Google Scholar]
- Hoang PD, Herbert RD, Todd G, Gorman RB. Gandevia SC. Passive mechanical properties of human gastrocnemius muscle-tendon unit, muscle fascicles and tendon in vivo. J Exp Biol. 2007;210:4159–4168. doi: 10.1242/jeb.002204. [DOI] [PubMed] [Google Scholar]
- Hodgson JA, Finni T, Lai AM, Edgerton VR. Sinha S. Influence of structure on the tissue dynamics of the human soleus muscle observed in MRI studies during isometric contractions. J Morphol. 2006;267:584–601. doi: 10.1002/jmor.10421. [DOI] [PubMed] [Google Scholar]
- Jahnke MT, Proske U. Struppler A. Measurements of muscle stiffness, the electromyogram and activity in single muscle spindles of human flexor muscles following conditioning by passive stretch or contraction. Brain Res. 1989;493:103–112. doi: 10.1016/0006-8993(89)91004-4. [DOI] [PubMed] [Google Scholar]
- Kwah LK, Pinto RZ, Diong JHL. Herbert RD. Reliability and validity of ultrasound measurements of muscle fascicle length and pennation in humans: a systematic review. J Appl Physiol. 2013;114:761–769. doi: 10.1152/japplphysiol.01430.2011. [DOI] [PubMed] [Google Scholar]
- Lee D, Li Z, Sohail QZ, Jackson K, Fiume E. Agur A. A three-dimensional approach to pennation angle estimation for human skeletal muscle. Comput Methods Biomech Engin. 2014;21:1–11. doi: 10.1080/10255842.2014.917294. [DOI] [PubMed] [Google Scholar]
- Lichtwark GA, Bougoulias K. Wilson AM. Muscle fascicle and series elastic element length changes along the length of the human gastrocnemius during walking and running. J Biomech. 2007;40:157–164. doi: 10.1016/j.jbiomech.2005.10.035. [DOI] [PubMed] [Google Scholar]
- Loram ID, Maganaris CN. Lakie M. The passive, human calf muscles in relation to standing: the short range stiffness lies in the contractile component. J Physiol. 2007;584:677–692. doi: 10.1113/jphysiol.2007.140053. [DOI] [PMC free article] [PubMed] [Google Scholar]
- Maganaris CN, Baltzopoulos V. Sargeant AJ. In vivo measurements of the triceps surae complex architecture in man: implications for muscle function. J Physiol. 1998;512:603–614. doi: 10.1111/j.1469-7793.1998.603be.x. [DOI] [PMC free article] [PubMed] [Google Scholar]
- Magnusson SP, Aagaard P, Dyhre-Poulsen P. Kjaer M. Load-displacement properties of the human triceps surae aponeurosis in vivo. J Physiol. 2001;531:277–288. doi: 10.1111/j.1469-7793.2001.0277j.x. [DOI] [PMC free article] [PubMed] [Google Scholar]
- Morgan DL, Proske U. Warren D. Measurements of muscle stiffness and the mechanism of elastic storage of energy in hopping kangaroos. J Physiol. 1978;282:253–261. doi: 10.1113/jphysiol.1978.sp012461. [DOI] [PMC free article] [PubMed] [Google Scholar]
- Muraoka T, Chino K, Muramatsu T, Fukunaga T. Kanehisa H. In vivo passive mechanical properties of the human gastrocnemius muscle belly. J Biomech. 2005;38:1213–1219. doi: 10.1016/j.jbiomech.2004.06.012. [DOI] [PubMed] [Google Scholar]
- Narici MV, Binzoni T, Hiltbrand E, Fasel J, Terrier F. Cerretelli P. In vivo human gastrocnemius architecture with changing joint angle at rest and during graded isometric contraction. J Physiol. 1996;496:287–297. doi: 10.1113/jphysiol.1996.sp021685. [DOI] [PMC free article] [PubMed] [Google Scholar]
- Nordez A, Gallot T, Catheline S, Guevel A, Cornu C. Hug F. Electromechanical delay revisited using very high frame rate ultrasound. J Appl Physiol. 2009;106:1970–1975. doi: 10.1152/japplphysiol.00221.2009. [DOI] [PubMed] [Google Scholar]
- Rack PM. Westbury DR. Elastic properties of the cat soleus tendon and their functional importance. J Physiol. 1984;347:479–495. doi: 10.1113/jphysiol.1984.sp015077. [DOI] [PMC free article] [PubMed] [Google Scholar]
- Rana M, Hamarneh G. Wakeling JM. 3D fascicle orientations in triceps surae. J Appl Physiol (1985) 2013;115:116–125. doi: 10.1152/japplphysiol.01090.2012. [DOI] [PubMed] [Google Scholar]
- Rana M. Wakeling JM. In-vivo determination of 3D muscle architecture of human muscle using free hand ultrasound. J Biomech. 2011;44:2129–2135. doi: 10.1016/j.jbiomech.2011.05.026. [DOI] [PubMed] [Google Scholar]
- Scott SH, Brown IE. Loeb GE. Mechanics of feline soleus: I. Effect of fascicle length and velocity on force output. J Muscle Res Cell Motil. 1996;17:207–219. doi: 10.1007/BF00124243. [DOI] [PubMed] [Google Scholar]
- Shin DD, Hodgson JA, Edgerton VR. Sinha S. In vivo intramuscular fascicle-aponeuroses dynamics of the human medial gastrocnemius during plantarflexion and dorsiflexion of the foot. J Appl Physiol (1985) 2009;107:1276–1284. doi: 10.1152/japplphysiol.91598.2008. [DOI] [PMC free article] [PubMed] [Google Scholar]
- van Bavel H, Drost MR, Wielders JD, Huyghe JM, Huson A. Janssen JD. Strain distribution on rat medial gastrocnemius (MG) during passive stretch. J Biomech. 1996;29:1069–1074. doi: 10.1016/0021-9290(95)00162-x. [DOI] [PubMed] [Google Scholar]
- Vergari C, Pourcelot P, Holden L, Ravary-Plumioen B, Gerard G, Laugier P, Mitton D. Crevier-Denoix N. True stress and Poisson's ratio of tendons during loading. J Biomech. 2011;44:719–724. doi: 10.1016/j.jbiomech.2010.10.038. [DOI] [PubMed] [Google Scholar]
- Wei JY, Simon J, Randic M. Burgess PR. Joint angle signaling by muscle spindle receptors. Brain Res. 1986;370:108–118. doi: 10.1016/0006-8993(86)91110-8. [DOI] [PubMed] [Google Scholar]
- Zajac FE. Muscle and tendon: properties, models, scaling, and application to biomechanics and motor control. Crit Rev Biomed Eng. 1989;17:359–411. [PubMed] [Google Scholar]
- Zuurbier CJ, Everard AJ, van der Wees P. Huijing PA. Length-force characteristics of the aponeurosis in the passive and active muscle condition and in the isolated condition. J Biomech. 1994;27:445–453. doi: 10.1016/0021-9290(94)90020-5. [DOI] [PubMed] [Google Scholar]
Associated Data
This section collects any data citations, data availability statements, or supplementary materials included in this article.
Supplementary Materials
Video sequence showing changes in length of medial gastrocnemius muscle fascicles.
Animation of gastrocnemius muscle fascicles during passive lengthening.
Animation of the superficial and deep aponeuroses during passive lengthening.