Abstract
In order to determine how functionalized gold nanoparticles (AuNPs) interact in a near-physiological environment, we performed all-atom molecular dynamics simulations on the icosahedral Au144 nanoparticles each coated with a homogeneous set of 60 thiolates selected from one of these five (5) types: 11-mercapto-1-undecanesulfonate −SC11H22−(SO3−), 5-mercapto-1-pentanesulfonate −SC5H10(SO3−), 5-mercapto-1-pentaneamine −S+10H(NH3+), 4-mercapto-benzoate −SPh(COO−), or 4-mercapto-benzamide −SPh(CONH3+3). These thiolates were selected to elucidate how the aggregation behavior of AuNPs depends on ligand parameters, including the charge of the terminal group (anionic vs. cationic), and its length and conformational flexibility. For this purpose, each functionalized AuNP was paired with a copy of itself, placed in an aqueous cell, neutralized by 120 Na+/Cl− counter-ions and salinated with a 150 mM concentration of NaCl, to form five (5) systems of like-charged AuNPs pairs in a saline. We computed the potential of mean force (the reversible work of separation) as a function of the intra-pair distance and, based on which, the aggregation affinities. We found that the AuNPs coated with negatively charged, short ligands have very high affinities. Structurally, a significant number of Na+ counter-ions reside on a plane between the AuNPs, mediating the interaction. Each such ion forms a “salt bridge” (or “ionic bonds”) to both of the AuNPs when they are separated by its diameter plus 0.2~0.3 nm. The positively charged AuNPs have much weaker affinities, as Cl− counter-ions form fewer and weaker salt bridges between the AuNPs. In the case of Au144(SC11H22(SO3−))60 pair, the flexible ligands fluctuate much more than the other four cases. The large fluctuations disfavor the forming of salt bridges between two AuNPs, but enable hydrophobic contact between the exposed hydrocarbon chains of the two AuNPs, which are subject to an effective attraction at a separation much greater than the AuNP diameter and involve a higher concentration of counter ions in the inter-pair space.
INTRODUCTION
The applicability of functionalized gold nanoparticles (AuNPs) in the improvement of diverse biomedical procedures is a promising area of research. For this reason, the interactions between AuNPs and biologically relevant molecules and aggregates such as those in cell membranes have been studied using both in vitro/vivo1-7 and in silico8-11 experiments. Other interaction partners of AuNPs considered in the literature include amyloids,12 viruses,13 bacteria,14 proteins,15, 16 and DNA.17 An example of the use of AuNPs in the improvement of a medical procedure was a study conducted on mice bearing brain tumors:18 the AuNPs were functionalized by selective targeting of ligands and injected intravenously. The ligands allowed them to diffuse through the cancer cell membranes and deliver a photodynamic therapy agent able to induce cell death once light was applied on it.
A decisive factor in the nature of AuNPs’ interactions is thus the properties of their protecting ligands. However, one consequence of modifying the choice of ligands is that the AuNPs’ aggregation tendency may be affected. Depending on the intended medical application, a high propensity to aggregate may be a desirable property, and may even be tuned by modifying the ligand.19 On the μm-scale, numerous studies performed on charged colloids interacting in electrolyte solutions have shown that they display attraction when equally charged.20-30
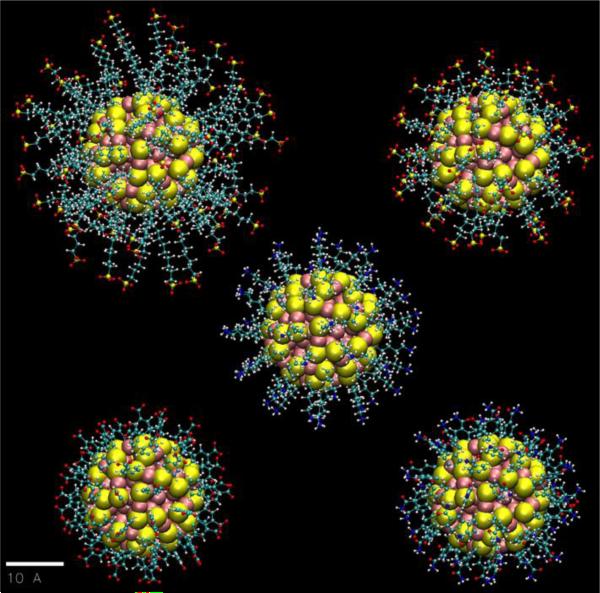
Our main objective in this paper is to study the interactions between functionalized charged Au144(SR)60 nanoparticles in a near-physiological environment (150-mM NaCl; 1-bar; 298K) for ligands with various lengths and flexibilities. For this purpose, we consider five different charged thiolate groups: 11-mercapto-1-undecanesulfonate −SC11H22(SO3−) (MUS−), 5-mercapto-1-pentanesulfonate −SC5H10(SO3−) (MPS−), 5-mercapto-1-pentaneamine −C5H10(NH3+) (MPM+), 4-mercapto-benzoate −SPh(COO−) (pMBA−), and 4-mercapto-benzamide −SPh(CONH3+) (pMBM+). The functionalized nanoparticles are shown in Fig. 1 and a more detailed view of the core and selected groups are shown in the electronic supplementary information (ESI), Fig. S1. A comparison of selected properties of each ligand is presented in Table 1. Some preliminary results were published in a recent communication.31
Fig. 1.
Equilibrium structures of the five Au144(SR)60 NPs shown on a common scale (bar length = 1.0 nm). The ligand RS-groups are: 11-mercapto-1-undecanesulfonate −SC11H22(SO3−) (MUS−, top left), 5-mercapto-1-pentanesulfonate −SC5H10(SO3−) (MPS−, top right), 5-mercapto-1-pentaneamine −SC5H10(NH3+) (MPM+, center), 4-mercapto-benzoate −SPh(COO−) (pMBA−, bottom left), and 4-mercapto-benzamide −SPh(CONH3+) (pMBM+, bottom right). The effective diameter of the inorganic Au144S60 core is 2.0 nm. The Au and S atoms are represented as large spheres (van der Waals), and the ligands are in the ball-and-stick (CPK) representation (Au: pink. S: yellow. O: red. C: cyan. N: blue. H: white). All graphics were rendered with VMD32.
Table 1.
Comparison of ligand properties.
| Property | NP1 | NP2 | |
|---|---|---|---|
| Length | MUS− | longer than | MPS− |
| Charge sign | MPS− | opposite to | MPM+ |
| pMBA− | opposite to | pMBM+ | |
| Flexibility | MPS− | greater than | pMBA− |
| MPM+ | greater than | pMBM+ |
We first conducted equilibrium molecular dynamics (MD) simulations, of 20-ns duration, on each of the five AuNPs interacting singly with the saline environment. Using the equilibrated structures so obtained, we formed five distinctive pairs of AuNPs (see Table 2) and built five all-atom model systems of AuNP pair in the saline environment. We then conducted equilibrium MD and nonequilibrium steered MD (SMD) runs on each of the five (5) systems. We calculated the potential of mean force (PMF) as a function of the distance between the centers of mass of the Au cores, as they were pulled toward each other in the SMD simulations.
Table 2.
Systems of paired NPs.
| System | AuNPI ligand and charge. | AuNP2 ligand and charge. |
|---|---|---|
| I | MUS− (–60e) | MUS− (–60e) |
| II | MPS− (–60e) | MPS− (–60e) |
| III | MPM+ (+60e) | MPM+ (+60e) |
| IV | pMBA− (–60e) | pMBA− (–60e) |
| V | pMBM+ (+60e) | pMBM+ (+60e) |
METHODS
Simulation Parameters
Interaction parameters for sulfur and gold (Au-Au and S-Au) are from Ref. 33. All other interactions were represented by the CHARMM36 force field,34, 35 to which were added the van der Waals (vdW) parameters for gold: σ = 1.66Å and ε = −0.106 kcal/mol. Water was represented with the TIP3P36 model. The cut-off distance applied to the vdW interactions was 1.0 nm, with a switching distance of 0.9 nm and a pair-list distance of 1.2 nm. Langevin dynamics was implemented with a 1.0-fs time-step for short-range interactions and 4.0 fs for long-range interactions, and with a Langevin damping of 5.0 ps−1. Temperature and pressure were maintained at 298 K and 1.0 bar. Periodic boundary conditions were applied in all directions. Full electrostatic interactions were computed through the Particle-Mesh Ewald (PME) method.
Building Single AuNPs
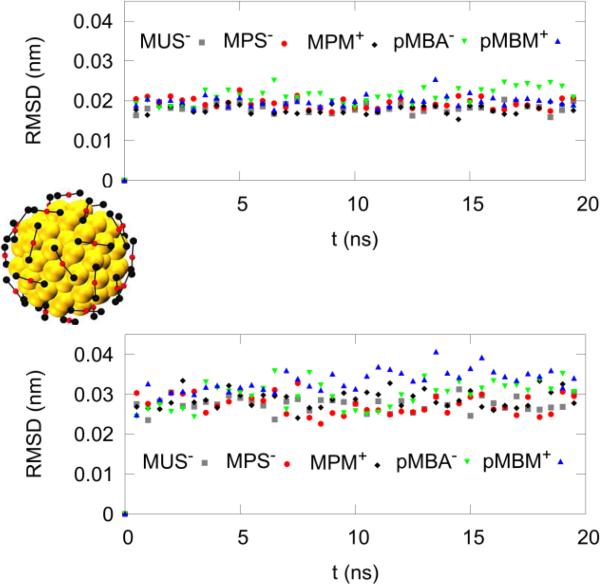
The procedure of building an AuNP was the following: Starting from the structure of Au144S60 taken from Refs. 37-39, one attaches, without regard for the C-S bond length, one ligand R-group to each of the 60 S atoms on the NP surface, thus forming a monolayer-protected Au144(SR)60 gold nanoparticle, whose initial structure is far from equilibrium. Second, one fixes the coordinates of the Au144S60 core, minimizes the NP's energy, and subsequently equilibrates (at 298 K) in vacuum for 1 ns (as shown in the ESI, Fig. S2). The AuNP thus formed is then placed in a cubic 103-nm aqueous cell; neutralized with Na+/Cl− counter-ions, salinated with 150 mM of NaCl, and then re-equilibrated. Subsequently, all atomic constraints are removed, the system equilibrated for 20 ns, and the core-structure stability is verified, in every case, by an RMSD of ≈ 0.03 nm (Fig. 2), thus confirming the validity of the interaction parameters selected.
Fig. 2.
Rigidity of the inorganic core, Au144S60. The RMSD of the Au114 inner core, top. The RMSD of the Au30S60 outer shell, bottom. One point was plotted per 0.5 ns. The AuNP's overall diffusion and rotation was excluded. The outer shell thus presented higher fluctuations than the inner core. On the right is shown an image of the inner Au114 inner core as golden spheres, and the shell Au30S60 core in the ball-and-stick representation: Au, red; S, black. For comparison, interatomic bond distances are typically 0.30 nm (Au-Au) and 0.24 nm (Au-S).
Forming AuNP Pairs
To form the systems of AuNP pairs, the coordinates of the five AuNPs were extracted from the end of the 20 ns equilibration in saline. An equilibrated AuNP was replicated at a center-to-center distance of 5 nm. The pair is then placed in a 10 × 10 × 20 nm3 water cell, neutralized by 120 of Na+/Cl− counter-ions, and salinated with 150 mM NaCl. One of the five systems so formed is illustrated in Fig. 3. Each system was then equilibrated for 20 ns while keeping fixed only the 12 central (Au) atoms of each inorganic core.
Fig. 3.
The in silico cell of physiological saline for system I: two AuNPs each coated with 60 MUS−, in a 10 × 10 × 20 nm aqueous cell, neutralized and salinated by 150mM NaCl, for a total of 190,616 atoms.
SMD Procedure
The PMF40-45 was computed, as a function of the distance, r, between the centers of mass (COM) of the AuNPs’ cores, using the multi-sectional scheme of Ref. 46. The starting positions of the two Au144S60 cores’ COMs were set at locations (x,y,z) = (0,0,±2.5) nm. The trajectory was then divided into sections of 0.2 nm in length. The central Au12 units were pulled through NAMD47, as adapted for steered molecular dynamics (SMD) from section i to section i±1 at a speed of 1.0 nm/ns, and the system was subsequently equilibrated for 1.0 ns once section i±1 was reached. Three additional equilibrium states were generated, at each section, by conducting 0.01 ns of equilibrium MD, for a total of four states per section.
For each state of each section, the COMs of each of the Au12 unit were then pulled backward and forward a distance of 0.1 nm (for a total change in separation of 0.2 nm) at a speed of 1.0 nm/ns, as illustrated in the ESI, Fig. S3. The work done to the system along these pulling paths was then employed in the Brownian-dynamics fluctuation-dissipation theorem48 to compute the free-energy difference (reversible work or PMF) as a function of the center-to-center distance:
| (1) |
Here WZi→Z is the work done to the system along a forward path when the NP pair is steered from zi to zi+1 (z C̵ [zi,zi+1]); WZi+1→Zi – WZi+1→Z is the work for the part of a reverse path when the NP pair is pulled from z to zi; kB and T are the Boltzmann constant and the absolute temperature.
Computation of Affinities
By combining the free-energy differences (the PMFs) over all sections, we obtain an overall PMF curve, PMF(r), as a function of the center-to-center distance, r = 2|z|. Using PMF(r) and following the standard literature, we obtain the aggregation affinity in terms of dissociation constant as follows:
| (2) |
Here c0 is the standard concentration. For convenience of unit conversion, we use c0 = 1M in the numerator and c0 = 6.023 ×10⁻¹ / nm3 in the denominator. The binding energy, the free energy of aggregation, is
| (3) |
Here r* is the cut-off separation beyond which the AuNPs are considered in the dissociated state. For System I, we took r*=4.5 nm and, for all other systems, r*=4.0 nm.
RESULTS AND DISCUSSION
Single-AuNP characteristics
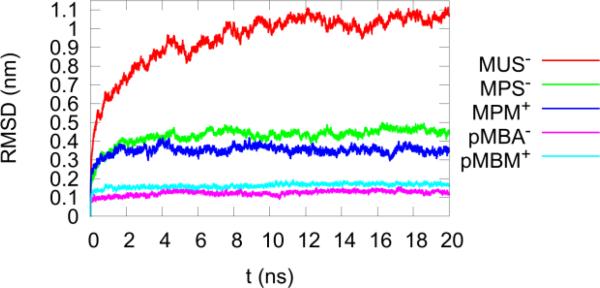
Figure 4 shows the fluctuations (RMSDs) of the ligand terminal groups, calculated from the trajectory of the 20-ns MD run for each AuNP in solution, and excluding the overall diffusion and rotation of AuNP. The largest ligand fluctuation (≈ 1.0 nm) belonged to MUS−, while pMPA− and pMBM+ had the lowest values at <0.2 nm. The ligands in order of decreasing amount of fluctuation were thus: MUS− > MPS− ≈ MPM+ > pMBA− ≈ pMBM+. MUS− fluctuates much more than MPS− because its hydrocarbon chain is longer, and MPS−/MPM+ fluctuates more than pMBA− because the (-CH2)5- chain is more flexible than the phenyl (–C6H4-) ring in pMBM+/pMBA−.
Fig. 4.
The RMSD of the terminal groups of the 60 RS-ligands, excluding the AuNP's overall diffusion and rotation. Note the the vertical scale is compressed 25-fold vs. that in Fig. 2.
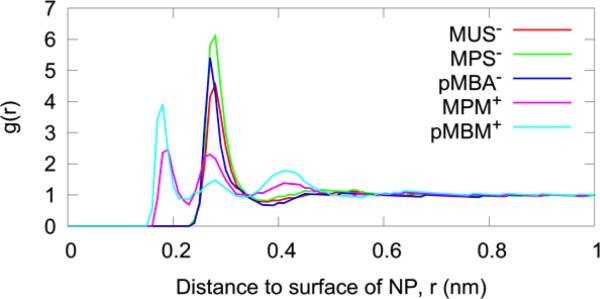
The water-AuNP pair correlation g(r) is plotted in Fig. 5 as a function of the distance from a water molecule (represented by its oxygen) to the surface of the AuNP. (The AuNP surface is defined by the ligand atoms that are in contact with the solvent water molecules.) Note that in the case of negatively charged AuNPs, the peak of the first hydration shell was displaced farther from the surface than the case of positively charged AuNPs.
Fig. 5.
The water-AuNP pair correlation with respect to the surface of the AuNP (including all ligand atoms).
The first peak was higher when the ligand was shorter (compare MUS− vs MPS−), indicating stronger interaction between water and the terminal group of a shorter ligand that fluctuates less (Fig. 4). Three solvation shells (peaks in g(r)) can be unambiguously identified when the AuNP is positively charged, while only one is pronounced around the negatively-charged AuNP. The cause of this is related to the difference in size of the counter-ions. The van der Waals radius of Na+ employed in the CHARMM36 force field is 0.136 nm, while the one for Cl− is 0.227 nm. Because they both have the same charge magnitude, the charge density of Na+ is thus higher than that of Cl−, which is why Na+ interacts with water more strongly than Cl−. As pointed out in Ref. 49, small ions are called “structure makers” because the water in their innermost region is strongly bound to them, thus forming a well-defined ion-water complex. Larger ions are called “structure breakers” because their influence on water is mainly to disrupt its hydrogen-bond network. Na+ thus interfered more than Cl− with the water structure created by the AuNP around itself. The stronger attraction of water to Na+ also explains why the peak of the first hydration shell is higher for the negative AuNPs (compare MPS− vs. MPM+ and pMBA− vs. pMBM+).
The radial distribution of the ligands’ terminal groups and the absolute value of the total ionic charge density are shown in Fig. 6, wherein the COM of the AuNP's core is set at the origin. The distribution of terminal groups is more dispersed for the ligands with higher fluctuations, as was expected from Fig. 4. As for the ionic charge distribution, it is similarly spread over a larger volume as the ligand's fluctuation increased (compare MUS− vs MPS−, MPS− vs pMBA−, and MPM+ vs pMBM+). For those ligands whose fluctuation was similar but whose charge sign was opposite, the charge distribution was more dispersed about the negatively charged one (compare pMBA− vs. pMBM+ and MPS− vs. MPM+). Because the Cl−-water complex is less tightly bound than the Na+-water complex, the Cl− ion is able to escape from its hydration shell and to concentrate densely on the AuNP surface, forming contact ion-pairs with the terminal groups.
Fig. 6.
The radial density distributions of the terminal groups (top) and the absolute value of the ionic charge density distributions (bottom). For MUS− and MPS− ligands, only the sulfonate S-atom of the terminal group was selected; and for the pMBA− and pMBM+ ligands, only the farthest carbon atom from the NP surface was selected. In the SI is presented the density distributions of the terminal groups, and the Na+ and Cl− ions for each system separately (ESI, Figs. S4-S5). The peak position of the terminal-group distribution (top) is approximately equal to the radius of the AuNP as a whole (core plus ligands).
The counter-ion distributions were fitted to the Debye-Hückel description around a charged NP: Ar−1e−Br + C where B−1 is the Debye length50. The results, presented in the ESI Fig. S6, confirm that the more the ligands fluctuate (i.e. the longer and more flexible it was), the better the Debye-Hückel description applied to the counter-ion distribution. The Debye lengths for those systems that showed a good fitting (RMS of residuals less than 0.1) were: 0.47, MUS−; 0.26, MPS−; and 0.13-nm, MPM+. For the two cases of rigid ligands, the Debye-Hückel formula does not seem to fit even qualitatively.
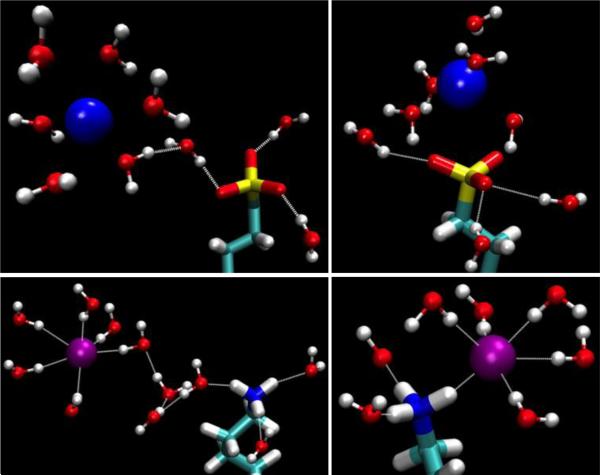
Finally, the self-diffusion coefficients of Na+ and Cl− (table 3) were calculated for each NP type in the NPT ensemble, and also for a salinated water cell in the absence of NP (the control system). They were obtained from the mean-squared displacement (MSD) using the Einstein relation (see ESI Figs. S7 for details). The diffusion constant of Na+ is less than that of Cl− in all systems, irrespective of the presence of AuNPs. This can be easily attributed to the fact that the Cl−-water complex is less tightly bound together than the Na+-water complex (see Fig. 7, top left and bottom left). The presence of AuNPs does not significantly alter the diffusion constant of like-charged ions (Na+ for AuNP+ and Cl− for AuNP−) from the values of the control system. An AuNP does reduce the diffusion of its counter-ions by 11 to 33%. This is partly due to the fact that a number of counter-ions are tightly bound to the AuNP and thus move along with the ligand terminal groups. The reduction of the counter-ion diffusion is more dramatic when the ligands’ fluctuation is smaller (compare MUS− vs. MPS− vs. pMBA−). This indicates that rigid ligands are more favorable for counter-ion binding.
Table 3.
Self-diffusion coefficients for 20 ns in the NPT ensemble (nm2/ns).
| Control | R=MUS− | R=MPS− | R=MPM+ | R=pMBA− | R=pMBM+ | |
|---|---|---|---|---|---|---|
| Cl− | 1.5 | 1.5 | 1.5 | 1.1 | 1.4 | 1.1 |
| Na+ | 0.9 | 0.8 | 0.7 | 0.9 | 0.6 | 0.9 |
Fig. 7.
The Na+ counter-ion drags its strongly-bound hydration shell towards SO3− terminal group, top left, and bonds by ionic contacts both to the terminal group and water, top right. A Cl− counter-ion drags its weakly-bound hydration shell towards the NH3+ terminal group, bottom left, and bonds by hydrogen bonds both to water and the terminal group, bottom right. A cutoff distance 0.35 nm and a cutoff angle of 30° was considered for the hydrogen bonds two values were taken from Ref. 50). Color code: S, yellow; O, red; C, cyan; white; N, blue; Na+, blue; Cl−, purple; hydrogen bonds, white.
Moreover, the ionic bonds binding Na+ to -COO− are stronger than the hydrogen bonds binding Cl− to -NH +3, as pointed out in Ref.50 (see Fig.7, right). When considering only electrostatic and van der Waals forces, and disregarding water, the energy of binding of the counterions to the terminal groups were −125 kcal/mol for Na+-COO−, -112 kcal/mol for Na+-SO −3 and −73 kcal/mol for Cl−-NH +3 (the corresponding configuration of minimum energy is illustrated in the ESI, Fig. S8). Despite the same charge-magnitudes shared by all terminal groups and counter-ions, the differences in van der Waals radii and molecular geometry restrict the approach of opposite charges to different extents.
AuNP-AuNP interactions
Nonequilibrium SMD runs have been performed on each system listed in Table 2. The PMF profiles extracted from the SMD runs are presented in Fig. 8 to Fig. 10 and analyzed below in this section. (The curves of work done on the systems are shown in the ESI, Fig. S9.) Table 4 presents a summary of the main characteristics of Systems I to V, along with those for a pair of glutathione-coated Au144 (noted here as GS−-GS−) whose PMF was presented in Ref. 31.
Fig. 8.
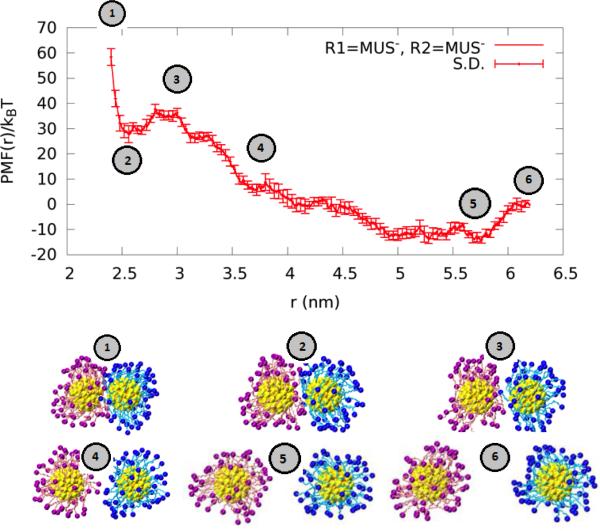
The PMF of the MUS−-MUS− AuNP pair as a function of center-to-center distance r between the cores, top. Bottom, snapshots of the AuNPs, each a different color to facilitate their distinction (the terminal groups were represented as spheres without atomic detail).
Fig. 10.
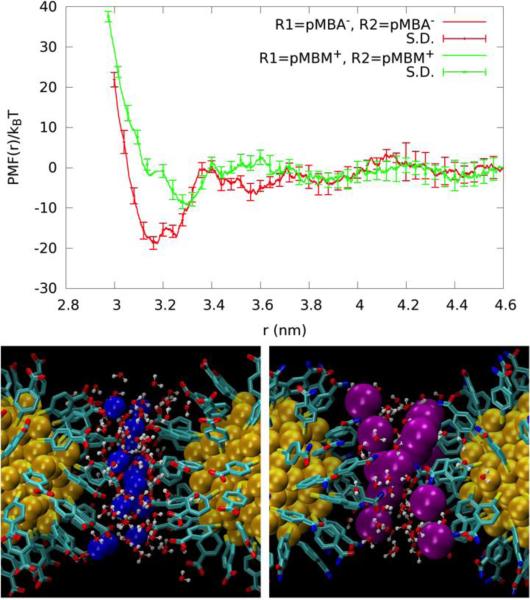
Top, the PMF profiles of the pMBA−-pMBA− (red) and pMBM+-pMBM+ (green) AuNP pairs as a function of the center-to-center distance between the cores. Bottom, the AuNP pairs positioned as at the well bottoms, r=3.2 nm for pMBA− pair (left) and r=3.3 nm for pMBM+ pair (right) respectively. Structure representation is identical to Fig. 9.
Table 4.
PMF wells (depths and separations) and aggregation affinities.
| Systems: AuNP pairs | Well depth | Well location | pkD |
|---|---|---|---|
| System I | 8 kBT | ~2.5 nm | 1.7 |
| MUS−MUS− | 14 kBT | ~5.7 nm | |
| System II | 23 kBT | ~3.3 nm | 11 |
| MPS−-MPS− | 7 kBT | ~4.9 nm | |
| System III | 5 kBT | ~3.4 nm | 1.3 |
| MPM+-MPM+ | 8 kBT | ~4.6 nm | |
| System IV | 19 kBT | ~3.2 nm | 8.5 |
| pMBA−-pMBA− | |||
| System V | 9 kBT | ~3.3 nm | 4.5 |
| pMBM+-pMBM+ | |||
| Reference31 | 21 kBT | ~3.7 nm | 10.5 |
| GS−-GS− | 6 kBT | ~5.1 nm |
The MUS−-MUS− AuNP pair (System I) is distinctive from all other pairs (Systems II to V). Its PMF is shown in Fig. 8. The ligands fluctuate with large amplitude at equilibrium (Fig. 4 and Fig. 6) due to their length (11 hydrocarbons) and flexibility. These large fluctuations cause the charge carried by this AuNP−60 to be unscreened by counterions even though Na+ interacts with the ligand's SO3− terminal group. The counter-ions instead concentrate in the inter-AuNP space when the two AuNPs are at an optimal separation (~5.7 nm), giving rise to a PMF well.
When the two MUS−-AuNPs are forced closer to one another, the interspace counter ions dissipate away and the net charges carried by the two AuNPs cause a large range of repulsion between them (3.7 to 5.7 nm). Further reducing the separation, partial contact between the two AuNPs starts at around 3.7 nm and the repulsive interaction continues until about 3 nm in separation.
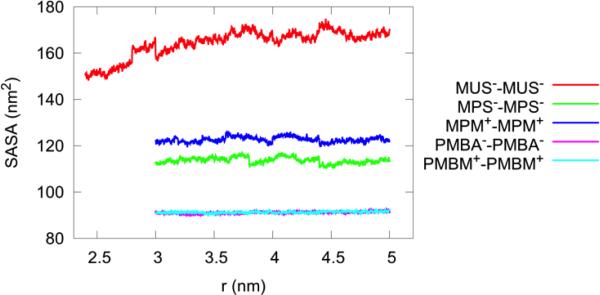
At a separation of about 2.5 nm, there is a significant PMF well indicating attraction between the two AuNPs. At this separation, the long ligands mostly bend out of the inter-AuNPs space so that the hydrophobic hydrocarbon chains are exposed toward one another, in agreement with the observations in Ref. 19. The hydrophobic interaction between the two AuNPs gives rise to the PMF well shown in Fig. 8. In order to ascertain the hydrophobic origin of this metastable state, we computed the solvent-accessible surface-area (SASA) of each AuNP pair as a function of its separation, cf. Fig. 11. The MUS−-MUS− AuNP pair has the largest SASA. As the separation is reduced, this pair's SASA changes significantly whereas no other pairs suffer any such large changes. Thus the other four systems fail to exhibit any behavior dominated by the hydrophobic contact.
Fig. 11.
The solvent-accessible surface area (SASA) of the AuNP pairs vs the separation, as calculated from the SMD runs. The small-r terminus was set where the steep inter-AuNP repulsion starts to dominate. The jumps reflect the 1 ns equilibration that occur between every section. The radius of each atom of the hydrophobic regions was extended by 1.4 Å to find the points on a sphere that are exposed to the solvent.
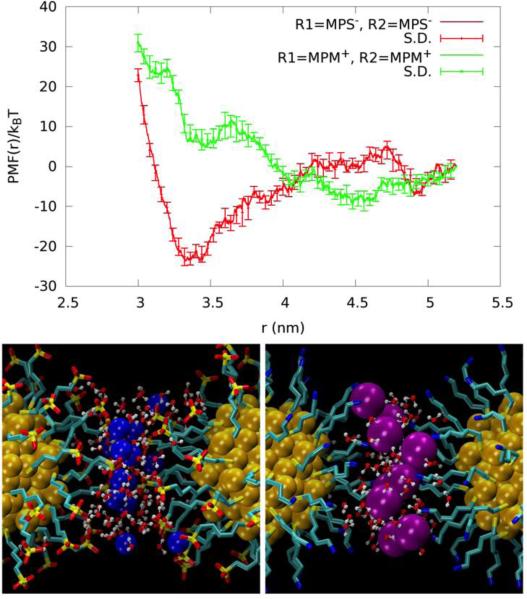
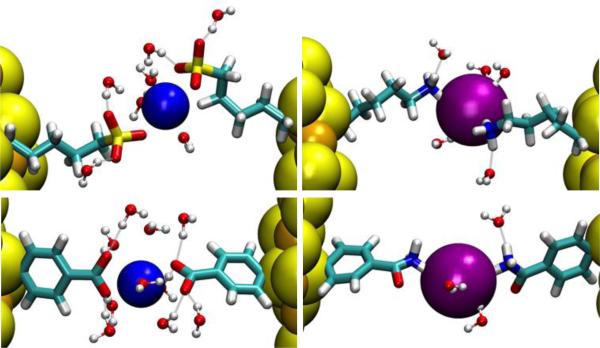
The PMFs of the remaining Systems II to V (Fig. 9 and Fig. 10, top panels) share one common feature along with the GS−-GS− pair.31 At the separation equal to the AuNP diameter (twice the peak distance of the terminal-group distribution shown in Fig. 6) plus 0.2~0.3 nm, there is a significant well in all the PMF curves. At this separation, there are a number of counter-ions residing approximately on the plane in between the two AuNPs of a given pair (Fig. 9 and Fig. 10, bottom panels). Each of these counter-ions forms “salt bridges” (or “ionic bonds”) to the ligands on both AuNPs (Fig. 12). These salt bridges give rise to the PMF wells shown in Fig. 9 and Fig. 10.
Fig. 9.
Top, the PMF profiles of the MPS−-MPS− (red) and MPM+-MPM+ (green) AuNP pairs are displayed as a function of the center-to-center distance between the cores. Bottom, the AuNP pairs positioned, as at the well bottoms, r=3.3nm for pMPS− pair (left) and r=3.4nm for pMPM+ pair (right) respectively. Au (yellow), Na+ (blue), and Cl− (purple) are shown as balls. Waters within 0.35 nm of the ions are shown in ball-and-sticks. The ligands are shown in licorice colored by atom name.
Fig. 12.
Close-up view of salt bridges between two AuNPs: System II, MPS−−Na+−MPS− (top, left), System III, MPM+−Cl−−MPM+ (top, right), System IV, pMBA−−Na+−pMBA− (bottom, left), and System V, pMBM+−Cl−−pMBM+ (bottom, right). Au (gold), S (yellow), Na+ (blue), and Cl− (purple) are represented by large spheres. Waters within 0.35 nm from the ions/terminal groups are shown as ball-and-sticks (oxygen, red and hydrogen, white). The ligands are in licorice colored by atom names (carbon, cyan; hydrogen, white and nitrogen, blue).
For convenience of discussion, let us define the “salt-bridge length” as the separation between two AuNPs corresponding to the well bottom in the PMF curve. Comparing the PMF of the MPS−-MPS− pair (System II) with that of the MPM+-MPM+ pair (System III) (Fig. 9, top panel), we note that the salt-bridge length of the MPS−-MPS− pair is approximately 0.1 nm shorter than that of the MPM+-MPM+ pair even though the two ligands are similar in length. The size of the Cl− counter-ion is significantly larger than the Na+ counter ion. And the Cl−-NH +3 attraction is much weaker than the Na+-SO3− attraction. These two factors combine to produce weaker and longer salt bridges between the MPM+-MPM+ pair than the MPS−-MPS− pair. Moreover, there are fewer Cl− counter-ions in between the MPM+-MPM+ pair forming fewer MPM+-Cl−-MPM+ bridges (Fig. 9, bottom panel). Together these lead to the PMF well depth of only 5 kBT for System III vs. the PMF well depth of 23 kBT for System II. Therefore, MPS− coated AuNPs have a much stronger aggregation affinity than MPM+ coated AuNPs. The dissociation constants are predicted to be pkD=11 for MPS-AuNPs vs pkD=1.3 for MPM-AuNPs.
The characteristics of the pMBA−-Na+-pMBA− bridges of System IV vs. the pMBM+-Cl−-pMBM+ bridges of System V (Fig. 12, bottom panels) can be understood in ways similar to the discussion of Systems II vs III. Again, the size of the Cl− counter-ion is significantly larger than the Na+ counter-ion. And the Cl−-NH3+ attraction is much weaker than the Na+-CO2− attraction. These make the pMBA−-Na+-pMBA− bridge shorter and stronger than the pMBM+-Cl−-pMBM+ bridge. Correspondingly, the PMF well locations are displaced as in Fig. 10 (top panel). Additionally, there are fewer pMBM+-Cl−-pMBM+ bridges (Fig. 10, bottom panel). Altogether, System IV has a much deeper well than System V (Table 4). Therefore, pMBA− coated AuNPs have a much stronger aggregation affinity than pMBM+ coated AuNPs in physiological saline. The dissociation constants are predicted to be pkD=8.5 for pMBA-AuNPs vs pkD=4.5 for pMBM-AuNPs.
It is also interesting to note the difference between System II (the MPS−-MPS− pair) and System IV (the pMBA−-pMBA− pair). Since MPS− is more flexible than pMBA−, the ligands of System II can bend slightly to form additional MPS−-Na+-MPS− bridges as compared to the ligands of System IV. Compare Fig. 9 bottom left panel vs. Fig. 10 bottom left panel. Therefore, MPS-AuNPs have a greater affinity than pMBA-AuNPs.
When the AuNP pairs of Systems II to V are separated at a distance significantly longer than the corresponding salt bridges, the Coulombic repulsion between the two AuNPs is largely screened out. This is particularly true for Systems IV and V as the ligands of these two systems are rigid. The very small fluctuations of the ligands (Fig. 4) enable nearly complete neutralization of the AuNP charge by the counter ions, as indicated by Fig. 6. (ESI, Fig. S10 presents snapshots of the systems at the long range). Consequently, their PMF curves flatten out in the range of separation larger than the corresponding salt bridges (Fig. 10, top panel). In Systems II and III, the ligands are flexible and fluctuate more than the other two cases (Fig 4). The counter ions do not neutralize the AuNPs as completely as the other two cases (Fig. 6). The residual charges give rise to the repulsive regime for AuNP pair separation up to about 1 nm beyond the corresponding salt bridges (Fig. 9, top panel). At that stage, another attractive regime emerges. The MPS−-MPS− pair has a PMF well located at 4.9 nm and the MPM+-MPM+ pair at 4.6 nm. This attractive regime resembles the attraction between two like-charged colloids in electrolyte solution20-30 mediated by the counter ions that are distributed with a higher density in the inter-AuNP space.
Range of solution pH
In this study, we assume all the ligand terminal groups are fully charged. This assumption is valid in a good range of pH values around the physiological pH. For pH 6 and above, the four negatively charged ligand terminal groups remain practically fully charged because their pKa values are around 4. For pH 8 and below, the two positively charged ligand terminal groups remain approximately fully charged because their pKa values are greater than 10. Extending the study of Systems I, II, IV, and VI to pH below 6 will involve the four negatively charged ligands becoming partially charged depending on the pH. Going to pH above 8 will have the two positively charged ligands of Systems III and V becoming partially charged.
Multiple-AuNP interactions
This study is on the basis of the PMFs of AuNP pairs, assuming that multiple-AuNP interactions can be approximated as sums of pair interactions. This assumption is valid for most experimental situations because, even if the multiple-AuNP interactions cannot be completely represented by sums of pair interactions, pairwise interactions generally play the largest, if not dominant, role. Corrections beyond the pairwise interactions are expected to be smaller terms as they are proportional to the third power of the AuNP concentration. And the AuNP concentration is always very small in comparison with the solvent or ion concentrations due to the dimension of an AuNP being at least 10 times the dimension of a water or ion. These corrections can be computed in terms of PMFs of three or more AuNPs.
CONCLUSIONS
Comparing the PMF profiles of the AuNP pairs functionalized with charged ligands in saline with neutralizing counter ions, we draw the following conclusions:
AuNPs coated with long flexible ligands are not effectively neutralized by counter-ions. They carry a significant residual amount of charges giving rise to repulsion when their separation is one to two times their diameter and, consequently, they should fail to aggregate in close contact. The narrow range of attraction due to hydrophobic contact is theoretically predicted as a consequence of the long ligands bending collectively so that their terminal groups move out of the interspace between the AuNPs. The binding affinity of this attraction is very weak. Aggregation in this hydrophobic contact state can only happen at very high concentration of AuNPs in saline. However, there is a stronger attractive regime when the two AuNPs are separated slightly more than two times their diameter. Therefore they are expected to aggregate more readily in that state. In contrast, AuNPs coated with short ligands are more effectively neutralized by counterions and thus behave very differently.
The Na+ counter ions form very strong salt bridges between AuNPs coated with short, negatively charged ligands, resulting in a high inter-NP affinity likely to cause aggregation in the state of close contact. In this aggregated state, the AuNPs are separated only by a monolayer of Na+ counter-ions. And the computed value of dissociation constant, in the picomolar- to nanomolar-range, means that those AuNPs always aggregate in an aqueous environment with sufficient supply of Na+ counter ions. However, such salt bridges should be weakened and, consequently, aggregation minimized, by replacing Na+ with larger cations.
The Cl− counter ions also form salt bridges between AuNPs coated with short, positively charged ligands, but the strength of Cl− mediated bridges are weaker in strength and fewer in number. Consequently, AuNPs coated with positively charged ligands can aggregate in close contact state in aqueous solution with sufficient supply of Cl− counter-ions. The dissociation constants are predicted to be in the micromolar- to millimolar-range. However, replacing Cl− counter ions with smaller or stronger anions such as F− may greatly enhance the aggregation affinity of AuNPs coated with positively charged ligands.
Finally, we speculate that certain conclusions drawn in the work for functionalized AuNPs may be applicable to globular, strongly charged proteins in aqueous solutions.
Supplementary Material
Acknowledgments
The authors are indebted for support to the following funding agencies: the Mexican national council of science and technology (CONACYT, grant 533262), the NIH (Grants #GM084834 and #G12RR013646), the Welch Foundation (Project AX-1615), and the NSF (Grants #DMR-0934218 and #1103730). They also acknowledge support from the Texas Advanced Computing Centre.
Footnotes
Electronic Supplementary Information (ESI) available: Computational details. See DOI: 10.1039/c000000x/
References
- 1.Bartczak D, Muskens OL, Sanchez-Elsner T, Kanaras AG, Millar TM. ACS nano. 2013;7:5628–5636. doi: 10.1021/nn402111z. [DOI] [PubMed] [Google Scholar]
- 2.Cho EC, Au L, Zhang Q, Xia Y. Small. 2010;6:517–522. doi: 10.1002/smll.200901622. [DOI] [PMC free article] [PubMed] [Google Scholar]
- 3.Kim C, Agasti SS, Zhu Z, Isaacs L, Rotello VM. Nat Chem. 2010;2:962–966. doi: 10.1038/nchem.858. [DOI] [PMC free article] [PubMed] [Google Scholar]
- 4.Leroueil PR, Berry SA, Duthie K, Han G, Rotello VM, McNerny DQ, Baker JR, Orr BG, Banaszak Holl MM. Nano letters. 2008;8:420–424. doi: 10.1021/nl0722929. [DOI] [PubMed] [Google Scholar]
- 5.Lin C-AJ, Yang T-Y, Lee C-H, Huang SH, Sperling RA, Zanella M, Li JK, Shen J-L, Wang H-H, Yeh H-I, Parak WJ, Chang WH. ACS nano. 2009;3:395–401. doi: 10.1021/nn800632j. [DOI] [PubMed] [Google Scholar]
- 6.Verma A, Uzun O, Hu Y, Hu Y, Han H-S, Watson N, Chen S, Irvine DJ, Stellacci F. Nat Mater. 2008;7:588–595. doi: 10.1038/nmat2202. [DOI] [PMC free article] [PubMed] [Google Scholar]
- 7.Cho EC, Xie J, Wurm PA, Xia Y. Nano letters. 2009;9:1080–1084. doi: 10.1021/nl803487r. [DOI] [PubMed] [Google Scholar]
- 8.Heikkila E, Martinez-Seara H, Gurtovenko AA, Vattulainen I, Akola J. Biochimica et biophysica acta. 2014;1838:2852–2860. doi: 10.1016/j.bbamem.2014.07.027. [DOI] [PubMed] [Google Scholar]
- 9.Lin J, Zhang H, Chen Z, Zheng Y. ACS nano. 2010;4:5421–5429. doi: 10.1021/nn1010792. [DOI] [PubMed] [Google Scholar]
- 10.Lin J-Q, Zheng Y-G, Zhang H-W, Chen Z. Langmuir : the ACS journal of surfaces and colloids. 2011;27:8323–8332. doi: 10.1021/la201086u. [DOI] [PubMed] [Google Scholar]
- 11.Rocha E. L. d., Caramori GF, Rambo CR. Physical Chemistry Chemical Physics. 2013;15:2282–2290. doi: 10.1039/c2cp44035k. [DOI] [PubMed] [Google Scholar]
- 12.Antosova A, Gazova Z, Fedunova D, Valusova E, Bystrenova E, Valle F, Daxnerova Z, Biscarini F, Antalik M. Materials Science and Engineering: C. 2012;32:2529–2535. [Google Scholar]
- 13.Bowman M-C, Ballard TE, Ackerson CJ, Feldheim DL, Margolis DM, Melander C. Journal of the American Chemical Society. 2008;130:6896–6897. doi: 10.1021/ja710321g. [DOI] [PMC free article] [PubMed] [Google Scholar]
- 14.Bresee J, Maier KE, Boncella AE, Melander C, Feldheim DL. Small. 2011;7:2027–2031. doi: 10.1002/smll.201100420. [DOI] [PubMed] [Google Scholar]
- 15.Ackerson CJ, Powell RD, Hainfeld JF. In: Methods in Enzymology. Grant JJ, editor. Vol. 481. Academic Press; 2010. pp. 195–230. [DOI] [PMC free article] [PubMed] [Google Scholar]
- 16.Hainfeld JF, Liu W, Halsey CMR, Freimuth P, Powell RD. Journal of Structural Biology. 1999;127:185–198. doi: 10.1006/jsbi.1999.4149. [DOI] [PubMed] [Google Scholar]
- 17.Paillusson F, Dahirel V, Jardat M, Victor J-M, Barbi M. Physical Chemistry Chemical Physics. 2011;13:12603–12613. doi: 10.1039/c1cp20324j. [DOI] [PubMed] [Google Scholar]
- 18.Doane TL, Burda C. Chemical Society reviews. 2012;41:2885–2911. doi: 10.1039/c2cs15260f. [DOI] [PubMed] [Google Scholar]
- 19.Van Lehn RC, Alexander-Katz A. Langmuir : the ACS journal of surfaces and colloids. 2013;29:8788–8798. doi: 10.1021/la400756z. [DOI] [PubMed] [Google Scholar]
- 20.Dahirel V, Jardat M. Current Opinion in Colloid & Interface Science. 2010;15:2–7. [Google Scholar]
- 21.Dahirel V, Jardat M, Dufreche JF, Turq P. Physical Chemistry Chemical Physics. 2008;10:5147–5155. doi: 10.1039/b806315j. [DOI] [PubMed] [Google Scholar]
- 22.Ibarra-Armenta JG, Martin-Molina A, Quesada-Perez M. Physical Chemistry Chemical Physics. 2011;13:13349–13357. doi: 10.1039/c1cp21162e. [DOI] [PubMed] [Google Scholar]
- 23.Jho YS, Safran SA, In M, Pincus PA. Langmuir : the ACS journal of surfaces and colloids. 2012;28:8329–8336. doi: 10.1021/la3009943. [DOI] [PubMed] [Google Scholar]
- 24.Manning GS. Eur. Phys. J. E. 2011;34:1–18. doi: 10.1140/epje/i2011-11132-6. [DOI] [PubMed] [Google Scholar]
- 25.Nagornyak E, Yoo H, Pollack GH. Soft Matter. 2009;5:3850–3857. [Google Scholar]
- 26.Netz RR, Orland H. Eur. Phys. J. E. 2000;1:203–214. [Google Scholar]
- 27.Tata BVR, Mohanty PS, Valsakumar MC. Solid State Communications. 2008;147:360–365. [Google Scholar]
- 28.Turesson M, Jönsson B, Labbez C. Langmuir : the ACS journal of surfaces and colloids. 2012;28:4926–4930. doi: 10.1021/la3005008. [DOI] [PubMed] [Google Scholar]
- 29.Wu J, Bratko D, Prausnitz JM. Proceedings of the National Academy of Sciences. 1998;95:15169–15172. doi: 10.1073/pnas.95.26.15169. [DOI] [PMC free article] [PubMed] [Google Scholar]
- 30.Wu Y-Y, Wang F-H, Tan Z-J. Physics Letters A. 2013;377:1911–1919. [Google Scholar]
- 31.Alsharif SA, Chen LY, Tlahuice-Flores A, Whetten RL, Yacaman MJ. Physical Chemistry Chemical Physics. 2014;16:3909–3913. doi: 10.1039/c3cp54503b. [DOI] [PMC free article] [PubMed] [Google Scholar]
- 32.Humphrey W, Dalke A, Schulten K. Journal of Molecular Graphics. 1996;14:33–38. doi: 10.1016/0263-7855(96)00018-5. [DOI] [PubMed] [Google Scholar]
- 33.Hautman J, Klein ML. J Chem Phys. 1989;91:4994–5001. [Google Scholar]
- 34.Brooks BR, Brooks CL, Mackerell AD, Nilsson L, Petrella RJ, Roux B, Won Y, Archontis G, Bartels C, Boresch S, Caflisch A, Caves L, Cui Q, Dinner AR, Feig M, Fischer S, Gao J, Hodoscek M, Im W, Kuczera K, Lazaridis T, Ma J, Ovchinnikov V, Paci E, Pastor RW, Post CB, Pu JZ, Schaefer M, Tidor B, Venable RM, Woodcock HL, Wu X, Yang W, York DM, Karplus M. Journal of Computational Chemistry. 2009;30:1545–1614. doi: 10.1002/jcc.21287. [DOI] [PMC free article] [PubMed] [Google Scholar]
- 35.Vanommeslaeghe K, Hatcher E, Acharya C, Kundu S, Zhong S, Shim J, Darian E, Guvench O, Lopes P, Vorobyov I, Mackerell AD. Journal of Computational Chemistry. 2010;31:671–690. doi: 10.1002/jcc.21367. [DOI] [PMC free article] [PubMed] [Google Scholar]
- 36.Jorgensen WL, Chandrasekhar J, Madura JD, Impey RW, Klein ML. The Journal of Chemical Physics. 1983;79:926–935. [Google Scholar]
- 37.Lope-Acevedo O, Akola J, Whetten RL, Grönbeck H, Häkkinen H. The Journal of Physical Chemistry C. 2009;113:5035–5038. [Google Scholar]
- 38.Bahena D, Bhattarai N, Santiago U, Tlahuice A, Ponce A, Bach SBH, Yoon B, Whetten RL, Landman U, Jose-Yacaman M. The Journal of Physical Chemistry Letters. 2013;4:975–981. doi: 10.1021/jz400111d. [DOI] [PMC free article] [PubMed] [Google Scholar]
- 39.Tlahuice-Flores A, Black DM, Bach SBH, Jose-Yacaman M, Whetten RL. Physical Chemistry Chemical Physics. 2013;15:19191–19195. doi: 10.1039/c3cp53902d. [DOI] [PMC free article] [PubMed] [Google Scholar]
- 40.Kirkwood JG. The Journal of Chemical Physics. 1935;3:300–313. [Google Scholar]
- 41.Chandler D. The Journal of Chemical Physics. 1978;68:2959–2970. [Google Scholar]
- 42.Pratt LR, Hummer G, Garcia AE. Biophysical chemistry. 1994;51:147–165. doi: 10.1016/s0301-4622(99)00018-6. [DOI] [PubMed] [Google Scholar]
- 43.Roux B. Computer Physics Communications. 1995;91:275–282. [Google Scholar]
- 44.Allen TW, Andersen OS, Roux B. Biophysical chemistry. 2006;124:251–267. doi: 10.1016/j.bpc.2006.04.015. [DOI] [PubMed] [Google Scholar]
- 45.Wu J. AIChE Journal. 2006;52:1169–1193. [Google Scholar]
- 46.Chen LY. Biochimica et Biophysica Acta (BBA) - Biomembranes. 2013;1828:1786–1793. doi: 10.1016/j.bbamem.2013.03.008. [DOI] [PMC free article] [PubMed] [Google Scholar]
- 47.Phillips JC, Braun R, Wang W, Gumbart J, Tajkhorshid E, Villa E, Chipot C, Skeel RD, Kalé L, Schulten K. Journal of Computational Chemistry. 2005;26:1781–1802. doi: 10.1002/jcc.20289. [DOI] [PMC free article] [PubMed] [Google Scholar]
- 48.Chen LY. The Journal of Chemical Physics. 2008;129:144113–144114. doi: 10.1063/1.2992153. [DOI] [PMC free article] [PubMed] [Google Scholar]
- 49.Impey RW, Madden PA, McDonald IR. The Journal of Physical Chemistry. 1983;87:5071–5083. [Google Scholar]
- 50.Heikkilä E, Gurtovenko AA, Martinez-Seara H, Häkkinen H, Vattulainen I, Akola J. The Journal of Physical Chemistry C. 2012;116:9805–9815. [Google Scholar]
Associated Data
This section collects any data citations, data availability statements, or supplementary materials included in this article.


