Abstract
High resolution structure is presented for the ripple (Pβ′) phase of the phospholipid dimyristoylphosphatidylcholine. Low angle X-ray scattering from oriented samples yielded 57 orders, more than twice as many as recorded previously. The determined electron density map has a sawtooth profile similar to the result from lower resolution data, but the features are sharper allowing better estimates for the modulated bilayer profile and the distribution of headgroups along the aqueous interface. Analysis of high resolution wide angle X-ray data shows that the hydrocarbon chains in the longer, major side of the asymmetric sawtooth are packed similarly to the LβF gel phase, with chains in both monolayers coupled and tilted by 18° in the same direction. The absence of Bragg rods that could be associated with the minor side is consistent with disordered chains, as often suggested in the literature. However, the new high resolution bilayer profile strongly suggests that the chains in the two monolayers in the minor side and the curved region are not in registry. This staggered monolayer modulated melting suggests a direction for improving theories of the ripple phase.
1 Introduction
Multilamellar systems of lipid bilayers are liquid crystals whose study has been inspired by their biological relevance. An outstanding soft matter problem has been to characterize and understand the enigmatic Pβ′ ripple phase that occurs in bilayers composed of phospholipids with saturated hydrocarbon chains. As the temperature is increased in the canonical dimyristoylphosphatidylcholine (DMPC) and dipalmitoylphosphatidylcholine (DPPC) lipids, flat bilayers with nearly crystalline packing of chains melt into a so-called Lβ′ gel phase, still flat and still with essentially all-trans chain conformations, but now with substantial rotational disorder about their long axes. At substantially higher temperature, the bilayer is also statistically flat, although with undulational fluctuations and with ‘melted’ chains with considerable conformational disorder. Between the gel phase and the high temperature Lα ‘fluid’ phase, there is the ripple phase with static out-of-plane, sawtooth structure,1–4 breaking the statistically flat symmetry of adjacent phases.
Understanding why the ripple phase occurs has inspired much theory5–10 and some simulations.11–13 While modulated ripple-like phases have been obtained, there are considerable differences in the kinds of models that have been proposed and in the ensuing types of structures.
While the coarse structure at the level of the sawtooth profile has been well established for the DMPC ripple phase, this does not suffice to determine the packing of the lipid molecules, which is necessary to discriminate between theoretical models. Obtaining structure at the molecular level is the primary goal of the present study. The structure we obtain includes a feature, staggered monolayer modulated melting, that is not allowed in all but one of the previously proposed Landau-Ginzburg theoretical models.14
2 Samples, Methods, and Primary Data
2.1 Sample Preparation and X-ray Setup
DMPC was purchased from Avanti Polar Lipids. A solution consisting of 4 mg lyophilized DMPC dissolved in 140 μL chloroform:methanol (2:1 v:v) mixture was plated onto silicon wafers following the rock and roll procedure.15 Some samples were annealed at 60 °C for about 12 hours in a humid chamber to obtain even better orientation; mosaic spread was estimated at 0.1°. After mounting the sample in the X-ray chamber the samples were equilibrated for at least 100 minutes at 18°C which is near the midrange for the DMPC ripple phase. The temperature for the gel phase was 10°C and it was 30°C for the fluid phase.
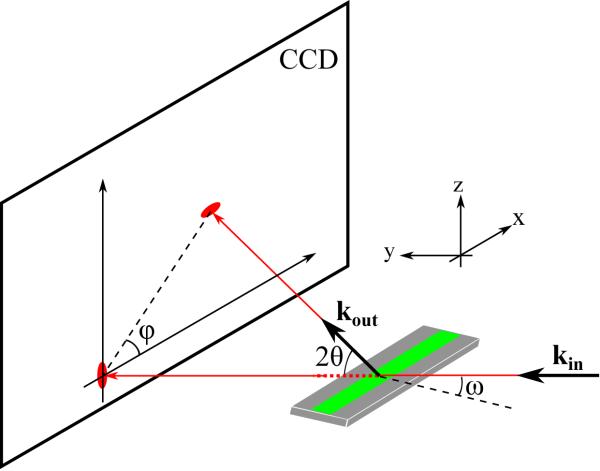
A schematic of the X-ray setup is shown in Fig. 1. Not shown is the well hydrated sample chamber that allowed the lamellar repeat spacing D to be tuned.16 The X-ray wavelength was set to 1.175 Å using the W/B4C multilayer monochromator at the G1 station of the Cornell High Energy Synchrotron Source (CHESS). To achieve optimal q-range and resolution, the distance between the sample and the CCD detector was larger (359.7 mm) for the low angle scattering (LAXS) and smaller (158.6 mm) for the wide angle scattering (WAXS).
Fig. 1.
Experimental scattering geometry with X-rays shown in red. The incoming beam is along the y-axis with wavevector kin, and a typical elastically scattered X-ray is portrayed by kout. The total scattering angle is 2θ. The CCD detector is in the lab xz-plane. The 30 mm by 15 mm Si wafer is shown as a gray rectangle and the green strip portrays the 10 μm thick oriented film. ω shows the rotation angle about the x-axis of the wafer with respect to the incoming beam, so the normal to the stack of bilayers is in the yz plane.
2.2 Low Angle X-ray Scattering
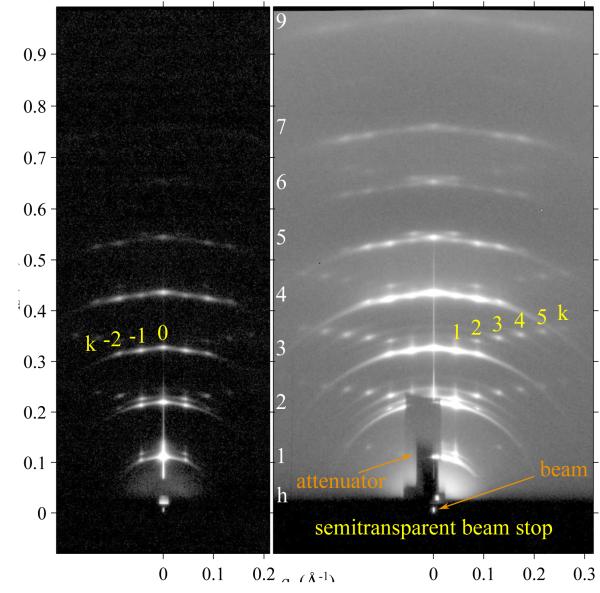
Figure 2 shows the CCD intensity pattern using our method of continuously rotating the sample uniformly during an exposure that obtains the intensities of multiple reflections in one CCD data set with the same normalization. However, the low order Bragg peaks were very strong, leading to saturation of CCD pixels for the longer exposure times appropriate to record the weaker higher orders. Therefore, three images were taken to obtain good statistics on each reflection and to provide overlap for mutual normalization. The integrated intensity of each peak was obtained using in-house software by defining a rectangular area on the CCD image containing most of the reflection and summing the intensity in the included pixels. Background was first subtracted from exposures with ω rotated between negative angles and remaining background was estimated from the intensity of nearby pixels.
Fig. 2.
1 second exposure (left) and 60 second exposure (right) of the low angle X-ray scattering from the DMPC ripple phase in different gray scales for the log of the intensity. The index h is labeled in white. The k index is identified for the (h = 3,k) reflections in yellow. The shadow cast by a 100 μm thick molybdenum attenuator blocking strong (1, 0) and (2, 0) orders in the right image is labeled as attenuator and extends from qz = 0 to 0.2 Å−1. The lamellar repeat distance D = 57.8 Å, ripple amplitude λr = 145.0 Å, and monoclinic oblique angle γ = 98.2°. The sample was continuously rotated to expose it twice each second to all angles −1.8° ≤ ω ≥ 7° which includes the Bragg angles for all observed reflections. The streak along the qz = 0 meridian is specular reflection from the substrate.
2.3 Wide Angle X-ray Scattering
Two methods were used to obtain wide angle scattering data. For the traditional grazing incidence method (GIWAXS), we used incident angle ω = 0.2°. Because the widths of Bragg rod reflections in the lateral qr direction are broadened by the 1.3% energy dispersion of the resident monochromator at G1 station, a channel cut silicon monochromator with energy dispersion 0.01% was inserted upstream of the sample. Background scattering collected immediately afterwards at ω = −0.2° was subtracted. A disadvantage of this GIWAXS method is that scattering below and near the equator is blocked by the substrate or attenuated by the sample itself, and also that complex Yoneda substrate scattering appears.
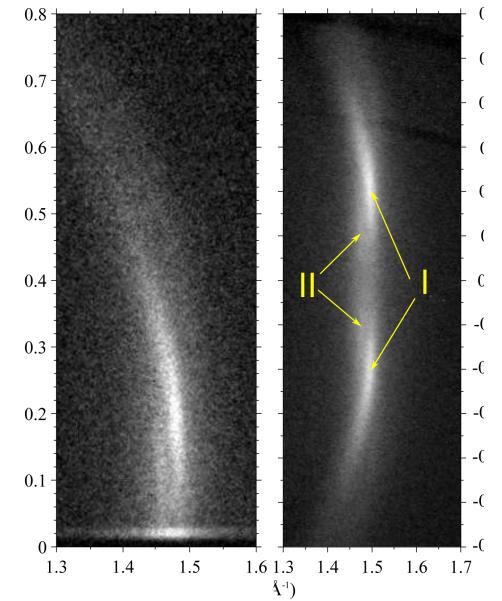
We call the second method tWAXS for transmission wide angle X-ray scattering. The incident angle ω was set to −45° which has the advantage that scattering near qz = 0 is not attenuated or otherwise differentially affected. Since incoming X-rays must penetrate the substrate, the substrate had to be thinner than for the other experiments; we used a 35 μm thick silicon substrate which attenuates 10.5 keV X-rays by 20%. Scattering intensity on the CCD was converted to scattering q space using a well established procedure.17,18 Background scattering for tWAXS was collected by replacing the sample with a bare Si wafer. Also, we did not use the silicon monochromator for this experiment. Nevertheless, the results of the two experiments were complementary as seen in Fig. 3.
Fig. 3.
Both GIWAXS (left) and tWAXS (right) show two Bragg rods (I and II) with centers indicated by the yellow arrows. The GIWAXS exposure has a streak of artifactual Yoneda scattering near qz = 0 which is absent in the tWAXS data. Formulas for conversion of tWAXS data to q-space are given in Section S1 of SI.
3 Results
3.1 Low Angle X-ray Scattering
Our X-ray beam illuminates an area of sample that is 0.2 mm wide by 5 mm along the y-axis in Fig. 1. As is clear from electron and surface probe microscopy,19,20 an area as large as the footprint of our beam includes many domains that have random directions of the local ripple. Therefore, the data on the CCD represents an in-plane powder average and the Bragg condition for all non-extinct reflections is met by some domain for the angular range used in Fig. 2. As is well known3,4,21,22 and as is shown in Fig. 2, the data can be indexed (h,k) to a two-dimensional oblique unit cell, h indexing a lamellar repeat spacing D in the z direction, k indexing the ripple wavelength λr in the lateral direction, and the oblique angle γ accounts for the breaking of the symmetry between positive and negative k. (Details of the analysis of the unit cell are given in Section S2.1.) The best previous data set was obtained from unoriented multilamellar vesicles (MLV) and had D = 58 Å, λr = 141.7 Å and γ = 98.4°.22 Because we wished to compare to those data to test our ability to obtain structure from oriented samples, we tuned the chamber humidity to achieve a similar D = 57.8 A, for which we determined λr = 145.0 Å and γ = 98.2°.
To obtain the electron density map within each unit cell, we first calculated the absolute values |Fhk| of the form factors (usually called structure factors in crystallography) from the integrated intensities of the reflections. This was straightforward for unoriented MLV samples for which there is only a simple Lorentz correction. For oriented samples, the Lorentz correction is less simple, and there are also non-trivial absorption and mosaic spread corrections. (Derivations of these corrections and a table of their values are given in Sections S2.2–S2.5.) The importance of these corrections is emphasized by their reducing the intensity of the (1,0) reflection by a factor of 0.394 whereas they increased the (1,3) intensity by 145. With these corrections, the values of |Fhk|, given in Tables S3 and S4, agree reasonably well with the 17 reflections with h greater than 0 that were reported for the comparable MLV sample.22 However, we believe that our |Fhk| are more accurate because the MLV data could only be obtained as a function of total q and there was considerable overlap of some pairs of reflections with very nearly the same q (Table S5). In contrast, in the oriented data shown in Fig. 2, those reflections are easily separated.
Although an electron density map can be produced by devising a model with parameters that can be fit to the absolute form factors, we have followed Sun et al. which used models only to obtain the crystallographic phase factors.3 Once the phase factors are obtained, the model is discarded, and the electron density map ρ(x,z) is produced by Fourier reconstruction,
| (1) |
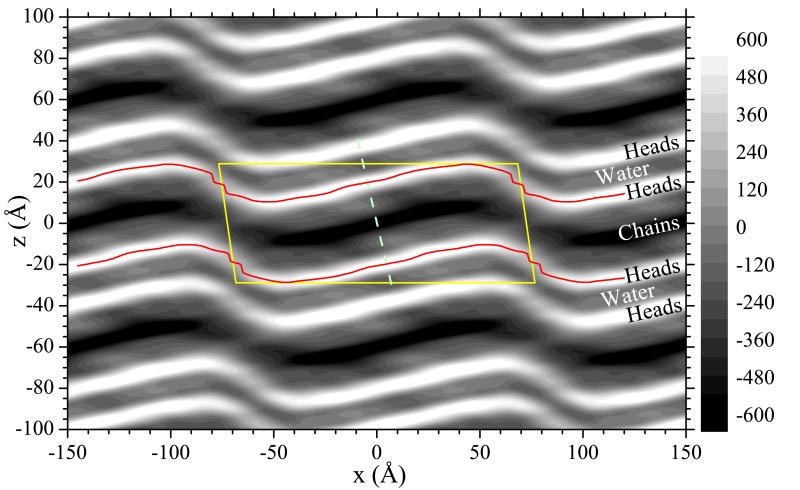
in which the form factors Fhk equal the experimental |Fhk| times the phase factor determined from the model. Sun et al. employed different models and found that all of them predicted the same phase factors for the observed 17 reflections. We found similar results using those same models for those reflections, but agreement for the higher h > 3 reflections was poor for the simplest of those models, as would be expected because they had too little detail to represent high resolution data. We have therefore improved our models by adding a second headgroup Gaussian to the transbilayer profile because that is needed to fit high resolution gel phase data23 and fluid phase data16 that also extend to comparably large q values. The electron density map using the phase factors for our best model and the experimental |Fhk| is shown in Fig. 4.
Fig. 4.
Unit cell is shown by yellow solid lines and the grayscale shows the electron density map (minus the average electron density) obtained from the experimental |Fhk| and the phase factors obtained from the best fitted model. The bright bands locate the electron dense headgroups and the thin red lines trace the local maxima in those bands. The darkest band locates the electron sparse terminal methyls on the hydrocarbon chains. The narrow band between the bright bands locates interlamellar water. The dashed line is drawn perpendicular to the major arm.
We have also found several distinct models that fit the data nearly equally well. As with Sun et al.,3 the phase factors agree for most of the reflections. The greatest disagreement is that the third best fitted model disagrees in the signs of all the h = 6 reflections. Nevertheless, its electron density map (Fig. S10) is quantitatively similar to Fig. 4. In particular, the locus of the maximum electron density (red line in Fig. 4) is nearly the same (Fig. S11). The ripple amplitude (difference in maximum and minimum z value of the red lines) is 18.2 Å for the phase factors in Fig. 4 and increases only by 0.3 Å for the other set of phases. Another comparison is the length of the major side, defined as the difference in the x values between the maximum and minimum z values; it is 97 Å in Fig. 4 and increases to 102 Å for the alternative set of phase factors.
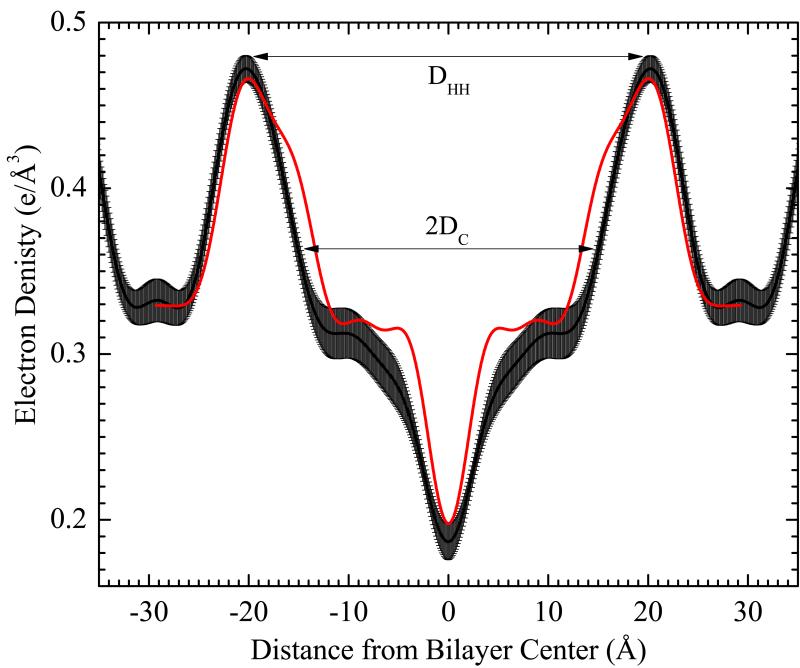
A very important quantity is the thickness of the major arm. Fig. 5 shows the average electron density profile perpendicular to the major arm. Defining DHH to be the distance between the maxima in Fig. 5, we obtain DHH = 40.6 Å from Fig. 4 and DHH = 41.8 Å from the alternative phase factors. By analogy to gel phase structure,23 the hydrocarbon thickness 2DC shown in Fig. 5 was obtained by subtracting 9.9 Å from DHH.
Fig. 5.
Electron density profile perpendicular to the major arm with error bands, obtained from averaging profiles at intervals of 10 Å in x. The dashed line in Fig. 4 shows the locus for the central profile. The red curve shows the corresponding higher resolution profile for DMPC gel phase at 10°c23 which we have used to scale the electron density axis for the ripple phase. The head-head thickness DHH = 40.6Å. The hydrocarbon thickness 2DC =30.7 Å.
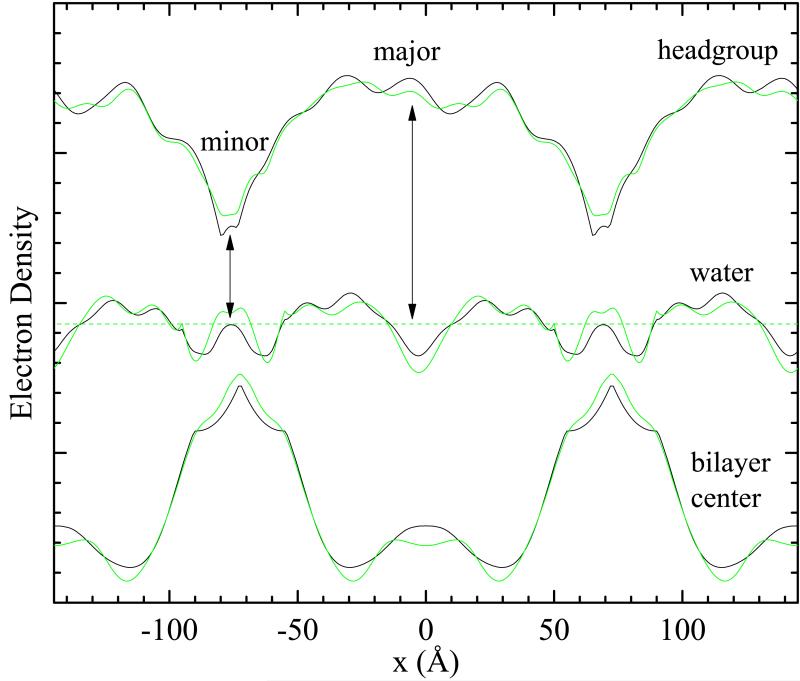
Other important quantities are profiles in the x direction in different regions of the bilayer. Fig. 6 shows profiles through the head, water, and center (terminal methyl) regions for the two sets of phases. As expected, the water profile is relatively constant; deviations could be due to imperfect phase factors, errors in the absolute form factors, as well as the inevitable Fourier wiggles that occur in Fourier reconstruction. An important result is the large difference in the headgroup and terminal methyl regions between the major and minor arms. The difference between the headgroup and water electron densities, indicated by the vertical arrows in Fig. 6, is closely related to the inverse of the area/lipid, requiring a much larger lipid area in the minor arm. In the gel phase the electron density of the chain methylenes is close to that of water but is only half as large for the terminal methyls and the localization of the terminal methyls in the bilayer center accounts for a deep methyl trough. The appearance of a methyl trough in Fig. 5 and the low electron density at the center of the major arm in Fig. 6 strongly supports the hypothesis of gel-like packing in the major arm. Surprisingly, the electron density at the center of the minor arm is much greater than occurs for the fluid phase.16
Fig. 6.
Relative electron density as a function of the ripple direction x for (top) the headgroup region along the red line in Fig. 4, (middle) along the water region and (bottom) in the center of the bilayer. The black lines are from Fig. 4 and the green lines are from the alternate set of phase factors. The horizontal dashed line suggests the electron density of water.
3.2 Wide Angle X-ray Scattering
Table 1 summarizes quantitatively the salient features shown in Fig. 3. These results indicate that Bragg rods I and II come from well ordered chains that are more like the gel phase than the fluid phase. The strongest indication comes from the small width Δqr of the rods in the in-plane direction which requires higher lateral positional order than is obtained in the fluid phase for which Δqr is ten times larger (see Table 1). However, the ripple I and II rods have a larger Δqr than the gel I (2,0) equatorial reflection; this could be due to increased conformational disorder or to finite size broadening because the size of the scattering domains is likely limited to the major arm with no coherence at the molecular level between adjacent major arms. Next, there is a difference in the total scattering angle for rod I and rod II as indicated by the difference in q. This is similar to, although only about half as large, as the difference for the gel phase, where the difference is ascribed to a small orthorhombic symmetry breaking of hexagonal chain packing. The average q for the two rods is smaller than for the gel phase, indicating looser chain packing, but this average is closer to the gel phase average q than to the broad single q in the fluid phase.
Table 1.
Wide angle quantities in Å−1 for the Bragg rods indicated by arrows I and II in Fig. 3 are given in the first two rows. The third row is for a broad underlying intensity not visible in Fig. 3. The remaining rows give results for the gel and fluid phases. The gel I width 0:014a is the limit of our instrumental resolution. Δqr is FWHM. Δqz is shown in Fig. 7.
| Rods | q | qr | qz | Δ qr | Δ qz |
|---|---|---|---|---|---|
| ripple I | 1.49 | 1.48 | 0.20 | 0.025 | 0.4 |
| ripple II | 1.46 | 1.46 | 0.12 | 0.025 | 0.4 |
| broader | 1.47 | 1.46 | 0.140 | ||
| gel I | 1.48 | 1.48 | 0 | 0.014a | 0.4 |
| gel II | 1.54 | 1.36 | 0.72 | ||
| fluid | 1.41 | 0.29 |
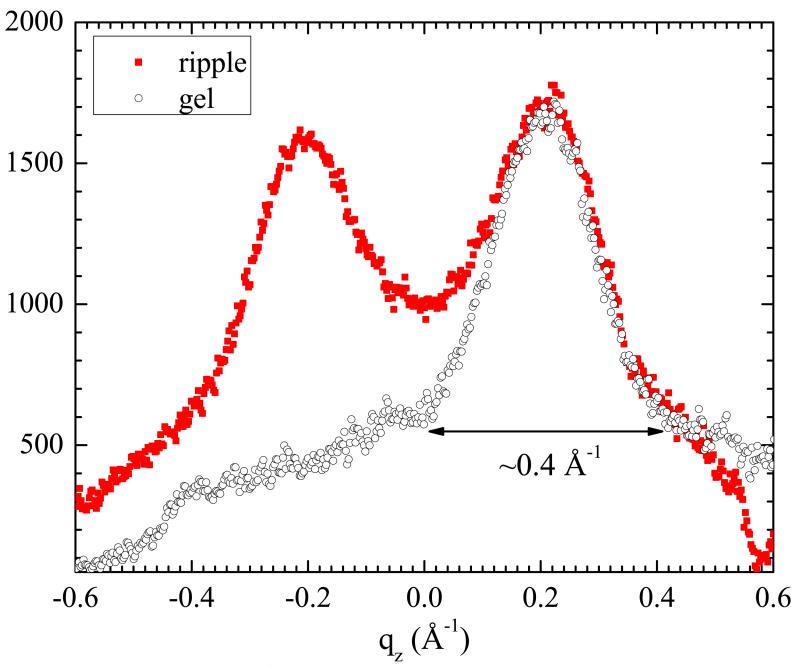
An important result is that the Bragg rods have a height Δqz very similar to that of the gel phase. This is emphasized in Fig. 7. The functional form for the intensity along Bragg rods is similar to sinc2 ((qz − qz,max)Lz/2) where the intensity is greatest at qz, max and Lz, is the height of the coherent scattering unit. This intensity is zero when (qz −qz,max)Lz/2 = ±π; these are the q values identified by the ends of the arrows in Fig. 7, giving Lz, = 10π Å. As each DMPC myristoyl chain is at most 17.8 Å long in the all-trans conformation and tilting only reduces this length, those chains responsible for the Bragg rods must be tilted coherently in the same direction in the two monolayers, as has been emphasized previously for the gel phase.17,24,25
Fig. 7.
Red: tWAXS intensity in the qz direction along Bragg red I in the ripple phase (red) showing the breaking of the (2,0) and (−2,0) symmetry. Black: (±2,0) gel phase with the qz = 0 at the maximum intensity scaled and displaced for comparison to the ripple width. The arrow shows the width Δqz used in the text and Table 1.
A major difference with the usual fully hydrated gel phase, emphasized in Table 1, is that both ripple rods are centered close to, but not on the qz = 0 equator whereas the fully hydrated gel phase has one rod centered on the equator and one rod centered far off the equator.24 To understand these WAXS results for Bragg rods I and II quantitatively we have developed models of tilted chains for the major arm of the ripple that are based on well known gel phase models. The left side of Fig. 8 shows the general model for chains in the gel phase tilted by θ with respect to the bilayer normal. The right hand side shows this unit cell tilted out of plane by the angle ξ. It might be supposed that the diffraction pattern would then be the same as for the gel phase with the chains tilted by θ + ξ but this would be a fundamental error because the operations of tilting and in-plane powder averaging do not commute. It is necessary first to tilt the gel phase q-space pattern and then to powder average it about the laboratory z-axis.26 Details of the derivation are given in SI Section S5. Table 2 shows the qz components of the central locations of the Bragg rods for the most important cases along with their gel phase counterparts. LβI is the fully hydrated gel phase of DMPC with the chains tilted toward nearest neighbors (ϕ = π/2). Upon partial dehydration, ϕ decreases culminating in the LβF phase in which chains are tilted toward next nearest neighbors (ϕ = 0).24 For both these gel phases, symmetry is further broken by the direction of tilt relative to the ripple axis which is modulated by the angle ζ. Table 2 shows how the Bragg rod centers are modified by the tilt angle ξ when ζ = 0 and ζ = π/2 for the corresponding phases.
Fig. 8.
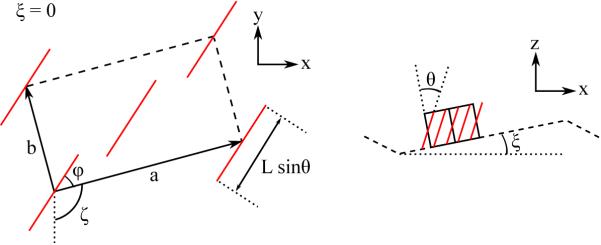
(left) Projection of the chain packing unit cell (a, b) on the laboratory xy-plane. The tilted chains are represented by red lines at the comers and in the center of the orthorhombic unit cell. The unit cell is rotated by ζ compared to a being parallel to y and the direction of chain tilt is rotated by ϕ from the a axis. (right) Without loss of generality, the ripple direction is shown along the x axis and the major side is tilted by ξ. Note the change of scale compared to the left side. Supposing that the chains are tilted in the x direction only, then the corresponding gel phase could be any LβL phase constrained only by ϕ + ζ = π/2,including the special LβL phase with ϕ = π/2 and ζ = 0 and the special LβF phase with ϕ = 0 and ζ = π/2.
Table 2.
Locations of centers divided by 2π/a where a is the long lattice constant and . Flat gel is indicated by L and ripple by P and β indicates tilt by angle θ relative to the bilayer normal. The major arm angle ξ and the orientation ζ of the unit cell are defined in Fig. 5 where the angle ϕ = 0 gives the F phase and ϕ = π/2 gives the I phase.
| (±2,0) | (±1,1) | (±1,−1) | |
| LβI | 0 | ||
| 0 | |||
| ±2sinξ | |||
| (±2,0) | (1,±1) | (−1,±1) | |
| LβF | ±2tanθ | tanθ | −tanθ |
Of the four cases for the ripple phase in Table 2, only is consistent with our WAXS data. Ithas the chains tilted toward next nearest neighbors and along the ripple direction. The ratio of qz for the two Bragg rod centers is 2, similar to the data. Given the LAXS results ξ = 10.5°, the model requires the chains to tilt relative to the normal to the bilayer by θ = −18.4° in order to match the experimental Δqz. The negative value of θ means that the chains are tilted with respect to the laboratory z axis by θ + ξ = −18.4+ 10.5 = −7.9°.
The case in Table 2 would have a rod centered at qz = 0, which our tWAXS data rule out Both the and the models would have chains tilted perpendicular to the ripple direction which is an unusually large additional symmetry breaking given that DMPC molecules have only one chiral atom. A more quantitative argument begins by noting that our LAXS result favors a non-zero value of θ (vide infra). Then, for both the and the models, the (±1, ±1) Bragg rods are split by the sin ξ terms so there would have to be more than two independent Bragg rods. However, the subsequent Bragg rods would substantially overlap, so separate rods would not be observable. If the rods are split and overlap broadly so that there is only one apparent rod, Δqz, for each of the split rods would be smaller than the observed 0.4Å−1; that would require a coherence height Lz even larger than for two chains which rules and . Nevertheless, it is possible that more general values of ϕ, corresponding to the gel LβL phase, and more general values of ζ, corresponding to breaking the symmetry of the unit cell orientation with respect to the ripple direction, might fit the WAXS data as well, but those variations would merely interpolate between the four primary cases listed in Table 2 and the best fit would be closest to .
3.3 Combined Structure
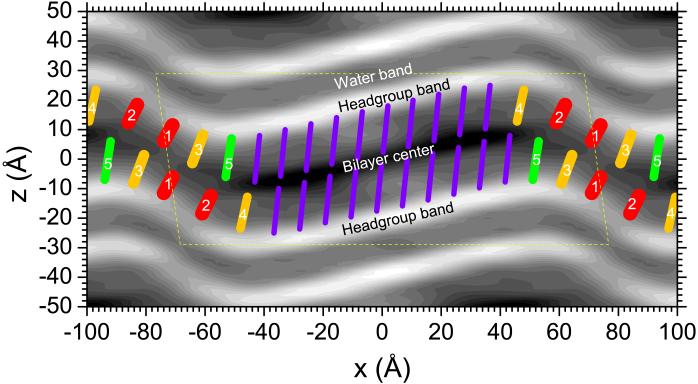
Figure 9 overlays our WAXS results for tilted chains in the major arm on our LAXS electron density map. The length of all-trans myristoyl chains, defined as the distance from halfway between the first and second carbon to the terminal methyl steric endcap, is 14 × 1.27 Å, so the length of two chains is 35.6 Å; this is greater than the hydrocarbon thickness 2Dc = 31.3 Å along the bilayer normal obtained from our LAXS results when averaged for the two sets of phase factors. Similarly to the gel phase, the chains tilt and our WAXS result θ = −18.4° predicts a hydrocarbon thickness 33.7 Å, closer to, although still larger, than our LAXS result for 2Dc as will be discussed.
Fig. 9.
Packing of chains (color) superimposed on the gray scale relative electron density map in Fig. 4. Gel-like chains (purple) in the major arm are longer and packed more closely for greater headgroup density. The lateral spacing of the gel-like chains is drawn to conform quantitatively to a slice through next nearest neighbors as in the LβF gel phase. Fluid-like chains (red, 1 and 2) in the minor arm are shorter and packed less densely. Orange (3 and 4) and green (5) chains have intermediate lengths and packing. The dashed yellow lines show the LAXS unit cell and should not imply coherence at the chain packing WAXS level between unit cells.
Our WAXS results provide only a little information about the other chains in the ripple. Table 1 notes that the intensity profile in the qr direction can be fit with a broader component in addition to the two Bragg rods (see Fig. S13) with a Δqr width that is five times larger than for the Bragg rods, and half as large as for the fluid phase, consistent with partially disordered, fluid-like chains. The most important information regarding the chain conformations in the minor arm comes from the electron density map. First, the much smaller electron density in the headgroup region, shown in the electron density map in Fig. 9, means that the interfacial area per chain is much larger in the minor arm than in the major arm, as shown in the chain overlay in Fig. 9. Second, the thickness of the hydrocarbon region, defined in the direction of local bilayer normal, becomes thinner. We therefore draw the minor arm chains shorter, consistent with more disordered, fluid-like chains. We also draw the minor arm chains wider because the chain volume is nearly constant, even increasing by about 6% upon melting from the gel to the fluid phase.27 We also draw the orientation of the most fluid chains, labeled 1 and 2 in Fig. 9, perpendicular to the local bilayer normal, consistent with the statistically averaged orientation in the fluid phase. The chains labelled 3, 4, and 5 are drawn with increasing length and increasing tilt with respect to the bilayer normal, so as to pack the available volume defined by the major arm chains and the electron density map.
4 Discussion
It has long been recognized that chain packing in the major arm of the ripple structure is likely to be similar to the gel phase. We were initially surprised that our WAXS analysis leads firmly to the chains being tilted toward next nearest neighbors as in the partially dehydrated LβF gel phase instead of the fully hydrated LβI gel phase. In retrospect, this makes sense because our ripple sample was also partially dehydrated, with a lamellar repeat spacing D = 57.8 Å compared to a fully hydrated ripple D = 66 Å,28 and this much decrease in D also converts the usual gel phase into the LβF phase. However, this does not necessarily imply that the fully hydrated ripple major arm is like the LβI gel phase as it was reported that the phase transition from the LβI gel phase in DL-DPPC went to a PβF phase at the same water content.26 We also took LAXS data up to D = 64 Å, but it is of lower quality, and we do not have accompanying WAXS data. Our choice of hydration and temperature was made to be able to compare our new data from oriented samples to the best previous LAXS data from unoriented samples. That comparison is good (Table S5) which validates our electron density map which is essential for obtaining the molecular level structure in the mimr arm shown in Fig. 9.
In passing, it is interesting to compare to results from surface probe microscopy. After discovery of artifacts in earlier papers, a freeze fracture STM study reported a sawtoothed ripple profile of DMPC at 23 °C with the major arm about 75% longer than the minor arm, with total ripple length λr = 110±10 Å and an amplitude of 24 Å.29 Curiously, the amplitude was reported to decrease to 11 Å at 20 °C and no amplitude could be found for 16 °C and 18 °C, contrary to our result. The suggestion that the ripple amplitude is so dependent on temperature was reported to be inconsistent with an AFM study, but that was for DPPC.30 Neither study indicated how the chains are packed.
Our chain packing structure shown in Fig. 9 differs from that shown for DLPC by Tardieu and Luzzati in which the chains in both the major and minor arms were drawn extended and oriented perpendicular to the minor arm.1 Our structure also differs from that shown for DMPC in the most recent X-ray experimental study4 in which the chains in both the major and minor arms were also drawn extended, but oriented perpendicular to the major arm. That orientation disagrees with the WAXS data, when properly interpreted. A natural misinterpretation is that Bragg rods centered at smaller qz means that the chains are tilted less with respect to the major arm bilayer normal.31 Contrarily, Table 2 shows that for the two cases with chains tilted by θ along the ripple direction, qz can be small when θ and ξ of the major arm have opposite sign.
Another problem with orienting the chains along the normal of the major arm4 is that it would require that the chains be considerably shorter than all-trans. However, while our tilt direction allows the chains to be longer, it still suggests that each chain is shorter than an all-trans chain by about 1.27 Å which happens to be the shortening of an all-trans chain when a gauche+ −trans −gauche− kink is inserted. This leads to an interesting correlation. In order to pack kinked chains together to minimize the energy, there must be a kink-block,32 in which the kink on neighboring chains are located on carbons j and j + 1 in order to pack the chains most closely. Such a kink-block has a natural in-plane length Rkink = ncrc where nc is related to the number of carbons/chain, and rc is the in-plane distance between the chains in the direction of the kink-block. Supposing that direction to be along the ripple direction for the PβF phase, rc = a is 8.9 Å as shown in Fig. 8. Subtracting 3 carbons unavailable for kinks at the chain ends, we use nc = 11 for a myristoyl chain, which gives Rkink = 98 Å; this is remarkably close to the length 97 Å of the major arm. This leads to the speculation that the length of the major arm might be the travel distance of a single kink-block because starting a new kink-block leads to inefficient, high energy chain packing. This may also be related to the single discordant note in our proposed chain packing in the major arm, namely, for chains modeled as thin straight rods, the Bragg rod with the smaller qz should be twice as intense as the one with twice the qz value. Such a factor is already modified when partial rotational order about the long axis is considered,33,34 and the disorder associated with kinks could change it further.
An additional reason our minor arm chain conformation in Fig. 9 seems more realistic than the extended conformations previously proposed from diffraction studies1,4 is that the ripple phase is heterogeneous, with some lipids being more fluid than the gel phase,35,36 consistent with adding enthalpy at the gel to ripple phase transition,37,38 and our structure includes conformationally disordered, partially melted chains. However, a noteworthy alternative for the minor side chain packing has been repeatedly proposed from MD simulations, in which there was chain interdigitation in the minor arms.11–13 Inter-digitation would account for a thinner minor arm as well as a lower electron density in the headgroup region and a larger electron density in the center that is shown in Fig. 6. However, such a substructure would scatter into Bragg rods centered at larger qz values where we did not observe any well defined WAXS, although any interdigitated region is small at least in the ripple direction, so there could be considerable broadening of the diffraction rendering it too weak to detect. However, there is also another problem with packing interdigitated chains in the electron density map. For bilayers with interdigitated lipids with two chains, there is little headgroup strain that causes chain tilt, so the chains are perpendicular to the bilayer surface. Therefore, the upper monolayer that has low electron density in the headgroup region is located opposite the lower monolayer. That can not be the case for the electron density map in Fig. 9 because the thinnest, highly disordered, parts of the opposing monolayers in the bilayer are staggered in x. The simulations also have staggered monolayers, although they become registered at the interdigitated part and the staggered part is in the sections with large concave curvature where the simulated chains are highly disordered which would lead to small headgroup intensity, contrary to the electron density map in Fig. 9. The ratio of major to minor arm is also too small in the simulation. Interestingly, our Fig. 9 could be made to look more like the simulations by making the minor arm longer and by sliding the lower monolayer to more positive x, as shown in Fig. S14.
A popular type of theory postulates continuum Landau-Ginzburg free energy functionals to produce modulated phases in many different kinds of soft matter systems. A notable example employed 6 phenomenological parameters including a term that depended on chiral lipids.9 Only when the chiral term was included did the theory produce an asymmetric sawtooth profile which led to criticism based on the experimental result that racemic mixtures have the asymmetric profile.31 The most recent theory,10 by employing 18 phenomenological parameters, produced a structure, shown in their Fig. 5, that has some of the same features as in our Fig. 9. Most importantly, although it is not mentioned that it disagrees with the previous experimental structure,4 the theory has major arm chains also tilted by a negative angle with respect to the local bilayer normal. Their minor arm chains are also disordered; although their schematic has the headgroups too close together in the minor arm, that is not part of the model. However, by only having bilayer order parameters, the model forces the two monolayers to be in register in x. The staggering clearly present in the electron density profiles would require order parameters for both monolayers individually. One study has considered this, but the model was not developed to the point where comparisons to experiment can be made.14 We suggest that models including separate order parameters for the monolayers would be a way forward for Landau-Ginzburg type theory, possibly even allowing that model with fewer phenomenological parameters9 to agree with experiment. On the other hand, continuum theories of the Landau-Ginzburg type, while good at producing modulation generally, might not allow sufficient molecular specificity to obtain quantitative agreement with ripple phase structure. Possibly, theories that include more molecular details,5–8 when combined and improved, would be helpful. Likewise, experimental data at more temperatures and hydration levels would be illuminating.
Supplementary Material
Acknowledgements
X-ray scattering data were taken at the Cornell High Energy Synchrotron Source (CHESS), which is supported by the National Science Foundation and the National Institutes of Health/National Institute of General Medical Sciences under National Science Foundation Award DMR-0225180. We thank Arthur Woll for providing a suitable beam, including installation of the Si monochromator for high resolution WAXS data. KA was supported in part by Grant No. GM 44976 from NIGMS/NIH; the content is solely the responsibility of the authors and does not necessarily represent the official views of the National Institutes of Health.
Footnotes
Electronic Supplementary Information (ESI) available: [See http://lipid.phys.cmu.edu].
References
- 1.Tardieu A, Luzzati V, Reman F. Journal of Molecular Biology. 1973;75:711–733. doi: 10.1016/0022-2836(73)90303-3. [DOI] [PubMed] [Google Scholar]
- 2.Zasadzinski J, Schneider M. Journal de Physique. 1987;48:2001–2011. [Google Scholar]
- 3.Sun WJ, Tristram-Nagle S, Suter RM, Nagle JF. Proceedings of the National Academy of Sciences. 1996;93:7008–7012. doi: 10.1073/pnas.93.14.7008. [DOI] [PMC free article] [PubMed] [Google Scholar]
- 4.Sengupta K, Raghunathan VA, Katsaras J. Physical Review E. 2003;68:031710. doi: 10.1103/PhysRevE.68.031710. [DOI] [PubMed] [Google Scholar]
- 5.Scott HL, McCullough WS. International journal of Modem Physics B. 1991;5:2479–2497. [Google Scholar]
- 6.Hawton MH, Keeler WJ. Physical Review A. 1986;33:3333. doi: 10.1103/physreva.33.3333. [DOI] [PubMed] [Google Scholar]
- 7.Doniach S. The Journal of Chemical Physics. 1979;70:4587–4596. [Google Scholar]
- 8.Carlson JM, Sethna JP. Physical Review A. 1987;36:3359. doi: 10.1103/physreva.36.3359. [DOI] [PubMed] [Google Scholar]
- 9.Chen CM, Lubensky TC. F. C. MacKintosh, Physical Review E. 1995;51:504. doi: 10.1103/physreve.51.504. [DOI] [PubMed] [Google Scholar]
- 10.Kamal MA, Pal A, Raghunathan VA, Rao M. Europhysics Letters. 2011;95:48004. [Google Scholar]
- 11.de Vries AH, Yefimov S, Mark AE, Marrink SJ. Proceedings of the National Academy of Sciences. 2005;102:5392–5396. doi: 10.1073/pnas.0408249102. [DOI] [PMC free article] [PubMed] [Google Scholar]
- 12.Lenz O, Schmid F. Physical Review Letters. 2007;98:058104. doi: 10.1103/PhysRevLett.98.058104. [DOI] [PubMed] [Google Scholar]
- 13.Debnath A, Thakkar FM, Maiti PK, Kumaran V, Ayappa KG. Soft Matter. 2014;10:7630–7637. doi: 10.1039/c4sm01031k. [DOI] [PubMed] [Google Scholar]
- 14.Seifert U, Shillcock J, Nelson P. Phys. Rev. Lett. 1996;77:5237–5240. doi: 10.1103/PhysRevLett.77.5237. [DOI] [PubMed] [Google Scholar]
- 15.Tristram-Nagle SA. Methods of Molecular Biology. 2007;400:63–75. doi: 10.1007/978-1-59745-519-0_5. [DOI] [PMC free article] [PubMed] [Google Scholar]
- 16.Kučerka N, Liu YF, Chu NJ, Petrache HI, Tristram-Nagle ST, Nagle JF. Biophysical Journal. 2005;88:2626–2637. doi: 10.1529/biophysj.104.056606. [DOI] [PMC free article] [PubMed] [Google Scholar]
- 17.Tristram-Nagle S, Zhang R, Suter RM, Worthington CR, Sun WJ, Nagle JF. Biophysical Journal. 1993;64:1097–1109. doi: 10.1016/S0006-3495(93)81475-9. [DOI] [PMC free article] [PubMed] [Google Scholar]
- 18.Mills TT, Toombes GE, Tristram-Nagle S, Smilgies D-M, Feigenson GW, Nagle JF. Biophysical Journal. 2008;95:669–681. doi: 10.1529/biophysj.107.127845. [DOI] [PMC free article] [PubMed] [Google Scholar]
- 19.Woodward J, IV, Zasadzinski J. Physical Review E. 1996;53:R3044. doi: 10.1103/physreve.53.r3044. [DOI] [PubMed] [Google Scholar]
- 20.Copeland BR, McConnell HM. Biochimica et Biophysica Acta (BBA) - Biomembranes. 1980;599:95–109. doi: 10.1016/0005-2736(80)90059-0. [DOI] [PubMed] [Google Scholar]
- 21.Janiak MJ, Small DM, Shipley GG. Journal of Biological Chemistry. 1979;254:6068–6078. [PubMed] [Google Scholar]
- 22.Wack DC, Webb WW. Physical Review A. 1989;40:2712–2730. doi: 10.1103/physreva.40.2712. [DOI] [PubMed] [Google Scholar]
- 23.Tristram-Nagle S, Liu Y, Legleiter J, Nagle JF. Biophysical Journal. 2002;83:3324–3335. doi: 10.1016/S0006-3495(02)75333-2. [DOI] [PMC free article] [PubMed] [Google Scholar]
- 24.Smith GS, Sirota EB, Safinya CR, Plano RJ, Clark NA. The Journal of Chemical Physics. 1990;92:4519–4529. [Google Scholar]
- 25.Sun WJ, Suter RM, Knewtson MA, Worthington CR, Tristram-Nagle S, Zhang R, Nagle JF. Physical Review E. 1994;49:4665–4676. doi: 10.1103/physreve.49.4665. [DOI] [PubMed] [Google Scholar]
- 26.Hentschel MP, Rustichelli F. Physical Review Letters. 1991;66:903–906. doi: 10.1103/PhysRevLett.66.903. [DOI] [PubMed] [Google Scholar]
- 27.Nagle JF, Wilkinson DA. Biophysical Journal. 1978;23:159–175. doi: 10.1016/S0006-3495(78)85441-1. [DOI] [PMC free article] [PubMed] [Google Scholar]
- 28.Chu N, Kueerka N, Liu YF, Tristram-Nagle S, Nagle JF. Physical Review E. 2005;71:041904. doi: 10.1103/PhysRevE.71.041904. [DOI] [PubMed] [Google Scholar]
- 29.Woodward J, IV, Zasadzinski J. Biophysical Journal. 1997;72:964–976. doi: 10.1016/s0006-3495(97)78731-9. [DOI] [PMC free article] [PubMed] [Google Scholar]
- 30.Kaasgaard T, Leidy C, Crowe JH, Mouritsen OG, Jørgensen K. Biophysical Journal. 2003;85:350–360. doi: 10.1016/S0006-3495(03)74479-8. [DOI] [PMC free article] [PubMed] [Google Scholar]
- 31.Katsaras J, Raghunathan VA. Physical Review Letters. 1995;74:2022–2025. doi: 10.1103/PhysRevLett.74.2022. [DOI] [PubMed] [Google Scholar]
- 32.Träuble H, Haynes DH. Chemistry and Physics of Lipids. 1971;7:324–335. [Google Scholar]
- 33.Watkins EB, Miller CE, Liao W-P, Kuhl TL. ACS Nano. 2014;8:3181–3191. doi: 10.1021/nn4052953. [DOI] [PubMed] [Google Scholar]
- 34.Akabori K, Nagle JF. ACS Nano. 2014;8:3123–3127. doi: 10.1021/nn501499t. [DOI] [PMC free article] [PubMed] [Google Scholar]
- 35.Wittebort R, Schmidt C, Griffin R. Biochemistry. 1981;20:4223–4228. doi: 10.1021/bi00517a042. [DOI] [PubMed] [Google Scholar]
- 36.Schneider MB, Chan WK, Webb WW. Biophysical Journal. 1983;43:157–165. doi: 10.1016/S0006-3495(83)84336-7. [DOI] [PMC free article] [PubMed] [Google Scholar]
- 37.Chapman D, Williams RM, Ladbrooke BD. Chemistry and Physics of Lipids. 1967;1:445–475. [Google Scholar]
- 38.Riske KA, Barroso RP, Vequi-Suplicy CC, Germano R, Henriques VB, Lamy MT. Biochimica et Biophysica Acta (BBA) - Biomembranes. 2009;1788:954–963. doi: 10.1016/j.bbamem.2009.01.007. [DOI] [PubMed] [Google Scholar]
Associated Data
This section collects any data citations, data availability statements, or supplementary materials included in this article.


