Abstract
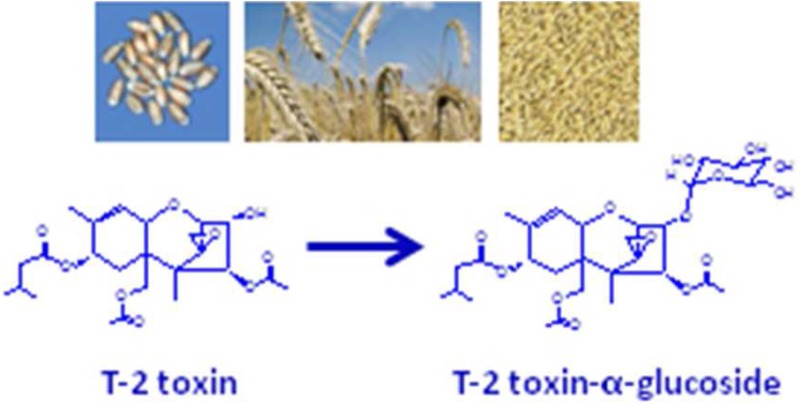
T-2 toxin is a trichothecene mycotoxin produced when Fusarium fungi infect grains, especially oats and wheat. Ingestion of T-2 toxin contaminated grain can cause diarrhea, hemorrhaging, and feed refusal in livestock. Cereal crops infected with mycotoxin-producing fungi form toxin glycosides, sometimes called masked mycotoxins, which are a potential food safety concern because they are not detectable by standard approaches and may be converted back to the parent toxin during digestion or food processing. The work reported here addresses four aspects of T-2 toxin-glucosides: phytotoxicity, stability after ingestion, antibody detection, and the anomericity of the naturally occurring T-2 toxin-glucoside found in cereal plants. T-2 toxin-β-glucoside was chemically synthesized and compared to T-2 toxin-α-glucoside prepared with Blastobotrys muscicola cultures and the T-2 toxin-glucoside found in naturally contaminated oats and wheat. The anomeric forms were separated chromatographically and differ in both NMR and mass spectrometry. Both anomers were significantly degraded to T-2 toxin and HT-2 toxin under conditions that mimic human digestion, but with different kinetics and metabolic end products. The naturally occurring T-2 toxin-glucoside from plants was found to be identical to T-2 toxin-α-glucoside prepared with B. muscicola. An antibody test for the detection of T-2 toxin was not effective for the detection of T-2 toxin-α-glucoside. This anomer was produced in sufficient quantity to assess its animal toxicity.
Keywords: mycotoxins, trichothecene, masked mycotoxins, ELISA, T-2 toxin, T-2 toxin-glucoside
Introduction
Species of the genus Fusarium are among the most destructive fungal plant pathogens known and are responsible for major yield losses during cultivation of wheat, maize, barley, and soybeans.1−4 Many species of Fusarium produce mycotoxins as they grow parasitically within the plant, and ingestion of contaminated grain and food products processed from this grain causes acute and chronic health problems for both humans and animals.5,6 Some species of Fusarium produce trichothecenes, sesquiterpenoid mycotoxins that inhibit eukaryotic protein synthesis and other cellular functions in animals that ingest contaminated feed.7 Type A trichothecenes (e.g., T-2 toxin, HT-2 toxin, diacetoxyscirpenol) are of particular concern because they are considerably more toxic than the type B group (e.g., deoxynivalenol and nivalenol). As part of their defense response to xenobiotics, plants can modify the structure of several mycotoxins, including trichothecenes, by conjugation to sugars, organic acids, or sulfates, which reduce their phytotoxicity and may facilitate their sequestration.8−12 Whereas conjugation to sugars may protect plants from the ill effects of the toxins,13 these so-called “masked mycotoxins” present a potential food safety concern because, although toxicological data are scarce, several studies highlight the potential threat to consumer safety from these substances.9,14−17 In particular, the possible hydrolysis of masked mycotoxins back to their toxic parents during mammalian digestion is of considerable concern.
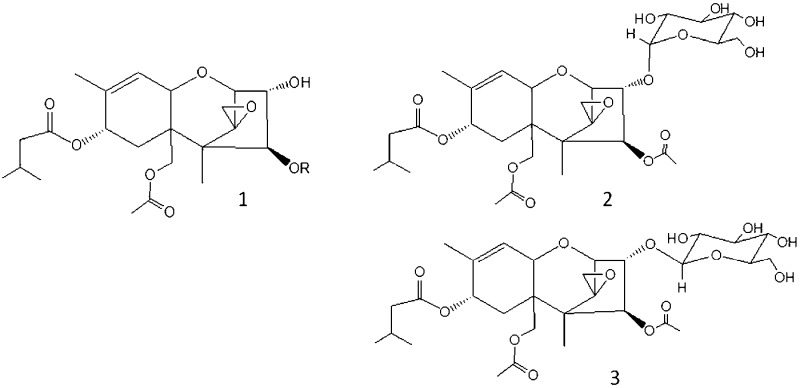
Structurally T-2 toxin, 1, R = Ac (Figure 1) is (2α,3α,4β,8α)-4,15-bis(acetyloxy)-3-hydroxy-12,13-epoxytrichothec-9-en-8-yl 3-methylbutanoate, which in animals is known to be predominantly metabolized to the 4-O-deacetylated form known as HT-2 toxin, 1, R = H (Figure 1).10,11 Glucoside conjugates of T-2 toxin have been reported in Fusarium-infected grain and Fusarium culture material,10,11 although to date the anomericity of the 3-O-linked glucosyl group is unknown. T-2 toxin-α-glucoside, 2, and T-2 toxin-β-glucoside, 3 (Figure 1), are anticipated to have very different physical properties. More importantly, the relative toxicities of the two anomers are as yet unknown, and the ability to test the naturally occurring form needs to be addressed.
Figure 1.
Structures of T-2 toxin, 1 (R = Ac), HT-2 toxin, 1 (R = H), T-2 toxin-α-glucoside, 2, and T-2 toxin-β-glucoside, 3.
One of the most studied masked trichothecenes is deoxynivalenol-3-glucoside, which has been reported from contaminated cereal crops18 and in food products derived from these crops.19 Nuclear magnetic resonance (NMR) studies have shown that the naturally occurring glucoside is deoxynivalenol-3-β-glucoside.8,20 Plant glucosyltransferase genes that control the conversion of deoxynivalenol to deoxynivalenol-3-β-glucoside have been identified,21−23 and a barley glucosyltransferase gene has been engineered into wheat to improve resistance to Fusarium head scab. In addition, a deoxynivalenol glucosyltransferase gene has been cloned and expressed in yeast.21 As a result, deoxynivalenol-3-β-glucoside has been prepared using yeast expression and has been available for studies on its stability during food processing and the digestive fate of this masked mycotoxin.17,24
Although initial studies reported that deoxynivalenol-3-β-glucoside is relatively stable to gastric conditions,17,24,25 it was recently reported that masked mycotoxins can be deconjugated by human colon microbiota, thus releasing their parent forms.14,26 Because parent toxins may be absorbed in the intestine, this cleavage should be considered of toxicological relevance depending on the colonic absorption of the target compound.14
We have recently shown that three species of Blastobotrys are able to biotransform T-2 toxin to T-2 toxin-α-glucoside, 2 (Figure 1),27 and these yeast species appeared to provide an efficient way to produce the material necessary to study the digestive fate or animal toxicity of T-2 toxin-glucoside and related compounds,27 as well as develop methods for their detection.28 It was first important to determine which anomeric form of T-2 toxin-glucoside was produced in Fusarium-contaminated cereals before proceeding with larger scale studies using the yeast biotransformation product. For this reason, T-2 toxin-β-glucoside, 3 (Figure 1), was chemically synthesized, and along with T-2 toxin-α-glucoside, 2 (Figure 1), the yeast biotransformation product, compared to the T-2 toxin-glucoside found in contaminated grain. We present here a comparison of the chromatographic and spectroscopic properties of the two anomeric forms, their relative reactivities to antibodies prepared with T-2 toxin-α-glucoside28 or T-2 toxin, their relative phytotoxicities, the stabilities and bioavailabilities of these masked mycotoxins after ingestion, and the anomeric form of the naturally occurring T-2 toxin-glucoside. These results become particularly relevant if international standards are developed for the detection and quantitation of T-2 toxin and T-2 toxin-glucoside in cereal grains and products made from them.
Materials and Methods
NMR Spectroscopy
NMR experiments were performed with acetone-d6 as the solvent on a Bruker Avance AMX 500 spectrometer (Bruker BioSpin Corp., Billerica, MA, USA) operating at 500.11 MHz using a standard 5 mm z-gradient BBI probe at 27 °C. Chemical shifts are reported as parts per million from tetramethylsilane calculated from the lock solvent. The deuterated solvents used were obtained from Cambridge Isotope Laboratories (Andover, MA, USA). The pulse sequences used were those supplied by Bruker, and processing was done with the Bruker TOPSPIN software package (v. 1.3). Additional NMR experiments with tetra-O-TIPS-β-glucosyl T-2 toxin, 6, and T-2 toxin-β-glucoside, 3, were performed on an Agilent 600 MHz NMR spectrometer (Agilent, Santa Clara, CA, USA).
Naturally Contaminated Cereal Samples
One wheat and one oat sample were extracted for comparison with T-2 toxin-glucoside standards. Samples were finely ground with a Tecator Cyclotec 1093 (International PBI, Milan, Italy) laboratory mill equipped with a 500 mm sieve. Ten grams of each ground sample was extracted with 30 mL of acetonitrile/water (84:16 v/v) by orbital shaking for 2 h. After filtration through filter paper, 10 mL of extract was cleaned with a Mycosep 227 column (Romer Laboratories, Union, MO, USA). Purified extract (6 mL, equivalent to 2 g of sample) was dried under an air stream at 50 °C.
Liquid Chromatography–Mass Spectrometry (LC-MS) Analysis
Extracts of naturally contaminated cereals or T-2 toxin-glucoside standards were analyzed by LC coupled to tandem mass spectrometry (MS/MS) as previously described.10,11 LC-MS/MS analyses were performed by a QTrap MS/MS system, from Applied Biosystems (Foster City, CA, USA) equipped with an electrospray ionization (ESI) interface and an 1100 series micro-LC system comprising a binary pump and a microautosampler from Agilent Technologies (Waldbronn, Germany). The column used was a 150 × 3 mm i.d., 4 μm, Synergi Hydro, with a 4 mm × 2 mm i.d., 10 μm, Aqua C18 guard column (Phenomenex, Torrance, CA, USA). The flow rate of the mobile phase was 200 μL/min, whereas the injection volume was 20 μL. Eluent A was water and eluent B was methanol, both containing 5 mM ammonium acetate. The elution was performed by changing the mobile phase composition as follows. Eluent B was increased from 20 to 40% in 3 min, then increased to 63% in 35 min, and kept constant for 9 min. For column re-equilibration, eluent B was decreased to 20% in 1 min and kept constant for 9 min. For MS analyses, the ESI interface was used with the following settings: temperature, 350 °C; curtain gas, nitrogen, 30 psi; nebulizer gas, air, 10 psi; auxiliary gas, air, 30 psi; ion spray voltage, +4500 V, positive ion mode.
The MS was operated in enhanced product ion (EPI) mode, applying a collision energy (CE) for stimulation of ion fragmentation of 10, or multiple reaction monitoring (MRM) mode to observe several distinctive ions produced upon fragmentation of the toxin with ammonium adduct [M + NH4]+ ion. For T-2 toxin-glucoside, the parent ion (m/z 646) and fragment ions were monitored to observe elution of the separated T-2 toxin conjugates. Operation of the LC-MS/MS instrument and interpretation of the acquired data were done utilizing the Analyst (ABSCIEX) software provided by the MS instrument manufacturer.
Preparation of T-2 Toxin-glucosides
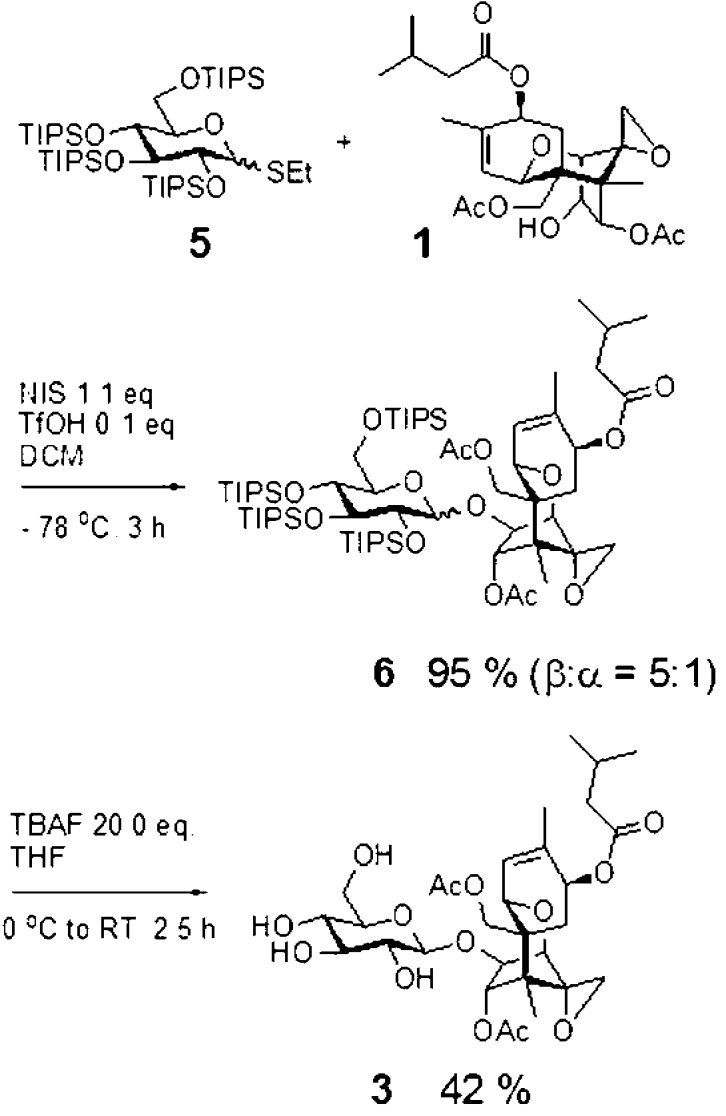
T-2 toxin-glucosides were prepared using T-2 toxin that had been isolated and purified from liquid cultures of Fusarium sporotrichioides strain 5493cos9-1#11 as described previously.27 T-2 toxin-α-glucoside, 2 (optical rotation, [α]D20 = +79.74, c 0.153, CH3OH), was prepared by feeding T-2 toxin to Blastobotrys muscicola cultures as described previously.27 T-2 toxin-β-glucoside, 3, was synthesized as described below (Figure 2).
Figure 2.
Synthesis of T-2 toxin-β-glucoside, 3.
Ethyl 2,3,4,6-Tetra-O-acetyl-1-thio-d-glucopyranoside, 429
Pentaacetyl-β-glucopyranose (1.0 g, 2.56 mmol) was dissolved in dichloromethane (20 mL), and ethanethiol (220 μL, 3.07 mmol) was added followed by BF3OEt (1.6 mL, 12.8 mmol) at ambient temperature under an argon atmosphere. After 2 h, the reaction mixture was diluted with dichloromethane and washed with saturated sodium bicarbonate. The aqueous phase was extracted with dichloromethane, and the combined organic phase was washed with brine and dried over sodium sulfate. The filtrate was concentrated, and the residue was purified by column chromatography over silica gel (hexane/ethyl acetate, 1:1), giving 660 mg (67%) of a colorless oil in the form of a 1:1 α,β-mixture.
Ethyl 2,3,4,6-Tetra-O-triisopropylsilyl-1-thio-d-glucopyranoside, 530
To a solution of 4 (660 mg, 1.68 mmol) in methanol (16.5 mL) was added sodium methoxide (10 mg, 0.17 mmol) at ambient temperature. After 1 h, the reaction mixture was neutralized with Amberlite 120. The resin was filtered off, and the filtrate was concentrated to give a colorless oil (340 mg),31 which was dissolved in 2,6-lutidine (15 mL) (Sigma-Aldrich, St. Louis, MO, USA) and treated with triisopropylsilyl trifluoromethanesulfonate (2 mL, 4.9 mmol) (Sigma-Aldrich). The reaction mixture was heated to 130 °C, and after 1.5 h, further triisopropylsilyl trifluoromethanesulfonate (2 mL, 4.9 mmol) was added. The reaction mixture was maintained at 130 °C for 2 h, then further triisopropylsilyl trifluoromethanesulfonate (2 mL, 4.9 mmol) was added. After 2 h, the reaction mixture was cooled to room temperature, diluted with hexane, and washed with 0.1 M HCl until the water phase remained acidic. The organic layer was washed with brine and dried over sodium sulfate. The filtrate was concentrated and purified by column chromatography over silica gel eluting with hexane, a colorless oil (680 mg, 53%) as a 1:1 mixture of α,β-isomers.
Tetra-O-TIPS-β-glucosyl T-2 Toxin, 6
A solution of 5 (110 mg, 0.13 mmol) and T-2 toxin (40 mg, 0.086 mmol) was dissolved in dry dichloromethane (0.4 mL) with 3 Å acid-washed molecular sieves (Alfa Aesar, Ward Hill, MA, USA). The reaction mixture was cooled to −78 °C under an argon atmosphere, and then N-iodosuccinimide (26 mg, 0.15 mmol) (Chem-Impex Int. Inc., Wood Dale, IL, USA) was added. After 0.5 h, trifluoromethanesulfonic acid (2.3 μL, 0.04 mmol) (Sigma-Aldrich) was added to the cold solution. After 3 h, the reaction mixture was quenched with triethylamine (EMD, Philadelphia, PA, USA), and the molecular sieves were filtered off. The filtrate was concentrated and purified by column chromatography over silica gel (eluent, hexane/ethyl acetate 4:1) to give a colorless oil (100 mg, 95%) as a 1:5 mixture of α,β-isomers.
1H NMR (600 MHz in CDCl3) for β-isomer: δ 5.66 (d, J = 3.3 Hz, 1H, H-4), 5.63 (d, J = 5.9 Hz, 1H, H-10), 5.27 (d, J = 5.5 Hz, 1H, H-8), 4.91 (d, J = 5.9 Hz, 1H, H-26), 4.31 (d, J = 12.1 Hz, 1H, H-15a), 4.27 (dd, J = 4.8, 3.67 Hz, 1H, H-3), 4.10 (d, J = 5.5 Hz, 1H, H-11), 4.08 (overlapped with H-15b, 1H, H-28), 4.07 (d, J = 12.5 Hz, 1H, H-15b), 3.95 (d, J = 2.9 Hz, 1H, H-29), 3.90 (d, J = 5.9 Hz, 1H, H-27), 3.89 (d, J = 5.8 Hz, 1H, H-30), 3.84 (d, J = 5.1 Hz, 2H, H-31a,b), 3.73 (d, J = 4.8 Hz, 1H, H-2), 2.92 (d, J = 4.0 Hz, 1H, H-13a), 2.75 (d, J = 4.0 Hz, 1H, H-13b), 2.29 (dd, J = 15.0, 5.9 Hz, 1H, H-7a), 2.09 (m, 1H, H-18), 2.07 (s, 1H, H-23), 2.05 (m, 1H, H-19), 2.00 (s, H-25), 1.99 (overlapped with H-25, 1H, H-7b), 1.72 (s, H-16), 0.95 (d, J = 6.2 or 5.1 Hz, 1H, H-20), 0.94 (d, J = 6.2 or 5.1 Hz, 1H, H-21), 0.67 (s, H-14); 13C NMR (150 MHz in CD2Cl3) δ 172.4 (C-17), 170.2 (C-22), 169.8 (C-24), 135.1 (C-9), 124.1 (C-10), 103.4 (C-26), 83.5 (C-30), 82.8 (C-3), 80.6 (C-4), 79.5 (C-2), 78.0 (C-28), 77.3 (C-27), 71.1 (C-29), 68.0 (C-8), 66.8 (C-11), 65.7 (C-31), 64.3 (C-15), 64.1 (C-12), 48.5 (C-5), 46.7 (C-13), 43.4 (C-18), 43.0 (C-6), 26.9 (C-7), 25.7 (C-19), 22.1 (C-20), 22.1 (C-21), 20.9 (C-25), 20.6 (C-23), 20.1 (C-16), 6.2 (C-14); HRMS-ESI (m/z) [M + Na]+ calcd for C66H124O14Si4Na 1275.7966, found 1275.7947.
T-2 Toxin-β-glucoside, 3
The above α,β-mixture of 6 (100 mg, 0.08 mmol) was dissolved in THF (1.0 mL) and treated at 0 °C with tetrabutylammonium fluoride (1.6 mL, 1.6 mmol) (Acros-Thermo Fisher Scientific Inc., Waltham, MA, USA). The reaction mixture was allowed to warm to room temperature and stirred for 2.5 h, after which it was concentrated and purified by column chromatography over silica gel (eluent, chloroform/methanol, 8:1) to give a colorless oil (42 mg, 84%) of a 1:5 α,β-mixture. Further purification of this mixture by C18 HPLC (water–acetonitrile 25–40%) and freeze-drying gave 21 mg (42%) of the pure β-isomer, 3, as a white amorphous powder.
1H NMR (600 MHz in CD3OD) δ 5.96 (d, J = 3.0 Hz, 1H, H-4), 5.77 (d, J = 6.00 Hz, 1H, H-10), 5.31 (d, J = 5.6 Hz, 1H, H-8), 4.46 (dd, J = 4.9, 3.2 Hz, 1H, H-3), 4.43 (d, J = 7.7 Hz, 1H, H-26), 4.37 (d, J = 6.2 Hz, 1H, H-11), 4.36 (d, J = 12.7 Hz, 1H, H-15a), 4.08 (d, J = 12.5 Hz, 1H, H-15b), 3.81 (dd, J = 12.0, 2.2 Hz, 1H, H-31a), 3.70 (d, J = 5.0 Hz, 1H, H-2), 3.63 (dd, J = 12.0, 5.8 Hz, 1H, H-31b), 3.34 (t, J = 9.0, 8.9 Hz, 1H, H-28), 3.28 (t, J = 9.0, 9.0 Hz, 1H, H-29), 3.24 (dd, J = 9.0, 7.8 Hz, 1H, H-27), 3.19 (ddd, J = 9.6, 5.8, 2.2 Hz, 1H, H-30), 3.03 (d, J = 3.8 Hz, 1H, H-13a), 2.85 (d, J = 3.9 Hz, 1H, H-13b), 2.36 (dd, J = 15.2, 6.0 Hz, 1H, H-7a), 2.14 (dd, J = 7.6, 2.4 Hz, 1H, H-18), 2.07 (s, H-23), 2.05 (s, 1H, H-25), 2.05 (m, H-19), 1.92 (d, J = 15.2 Hz, 1H, H-7b), 1.73 (s, H-16), 0.95 (d, J = 6.6 Hz, 1H, H-20), 0.94 (d, J = 6.6 Hz, 1H, H-21), 0.72 (s, 1H, H-14); 13C NMR (150 MHz in CD2Cl3) δ 174.1 (C-17), 170.8 (C-24), 170.7 (C-22), 137.2 (C-9), 125.2 (C-10), 103.8 (C-26), 83.9 (C-3), 81.3 (C-4), 80.6 (C-2), 78.4 (C-30), 78.2 (C-28), 74.9 (C-27), 71.6 (C-29), 69.4 (C-8), 68.6 (C-11), 65.9 (C-15), 65.4 (C-12), 62.8 (C-31), 50.2 (C-5), 48.0 (C-13), 44.6 (C-18), 44.5 (C-6), 28.9 (C-7), 27.0 (C-19), 22.9 (C-20), 22.8 (C-21), 21.3 (C-25), 20.9 (C-23), 20.6 (C-16), 7.2 (C-14); HRMS-ESI (m/z) [M + Na]+ calcd for C30H44O14Na 651.2629, found 651.2618; optical rotation [α]D20 = +7.51 (c 0.080, CH3OH).
ELISA Tests
The responses of the T-2 glucoside anomers were evaluated in two immunoassay formats. The first of these was a competitive indirect enzyme-linked immunosorbent assay (CI-ELISA) based upon an antibody (Mab 2-13) developed against T-2 toxin-3-α-glucoside, conjugated to ovalbumin (e.g., T-2G–OVA), as described previously.28 The second immunoassay format was a commercial test kit previously validated to detect T-2 toxin and HT-2 toxin (Veratox for T-2/HT-2) (Neogen Corp., Lansing, MI, USA). Assays were performed as described in the test kit instructions. For consistency with the methanol content indicated in the test kit instructions, the T-2 toxin-glucoside standards were prepared in 35% (v/v) methanol/water.
Phytotoxicity
The single-celled alga Chlamydomonas reinhardtii was used to assess the relative phytotoxicity of T-2 toxin, T-2 toxin-α-glucoside, and T-2 toxin-β-glucoside, as described previously.27,32 Triplicate cultures (10 mL) were initiated with 105 cells/mL containing a 100 μM concentration of an individual trichothecene and grown for 6 days under fluorescent lights, with agitation of 200 rpm. Culture doublings were calculated as follows: (log of the final density – log of the initial cell density)/log 2.
Artificial Saliva Digestion Assay
The in vitro digestion experiment was performed as described previously.16 Briefly, the main digestive juices were prepared by mixing salts and enzymes33 and were preheated at 37 °C before use. A volume of 200 μL of a water/methanol (25:75, v/v) solution containing the target compounds was transferred in a 4 mL septum vial, and the solvent was evaporated under nitrogen. The in vitro digestion was started by adding 75 μL of artificial saliva to 200 μL of the water/methanol (25:75 v/v) solution containing the target analyte (500 μg/L). After 5 min of incubation at 37 °C, 150 μL of artificial gastric juice was added and the mixture was incubated again for 2 h. At the end of the gastric step, 25 μL of 1 M bicarbonate solution with 150 μL of artificial duodenal juice and 75 μL of artificial bile juice were added, and then a final incubation step of 2 h was performed. Finally, 25 μL of acetonitrile was added to stop the reactions, and the sample was centrifuged for 10 min at 10000 rpm, prior to direct LC-MS/MS analysis.
In Vitro Human Colonic Fermentation Assay
Human colonic fermentation of T-2 toxin-α-glucoside, T-2 toxin-β-glucoside, and T-2 toxin was carried out as described previously.14 Fresh feces were collected from three different healthy and nonsmoker donors. These samples were immediately placed in an anaerobic environment and then mixed and weighed to obtain a 10% fecal solution in a phosphate saline buffer (PBS). For each sample 1.8 mL of growth medium, prepared as described previously,14 and 1.8 mL of fecal solution were mixed and added to 0.4 mL of a toxin solution, at a final concentration of 500 μg/L. Each vial was then treated with a slight nitrogen flow to eliminate oxygen and perform fermentations under anaerobic condition. Samples were incubated in a water bath at 37 °C and shaken at a rate of 200 strokes/min. Fermentations were stopped immediately to have controls and then after 30 min and 24 h, by cooling samples to room temperature and adding 0.4 mL of acetonitrile. Samples were immediately centrifuged at 14000 rpm for 10 min and stored at −20 °C. At the same time, samples without added mycotoxin were prepared. All of the fermentations were performed in triplicate. Samples were diluted adding acetonitrile (1:2 v/v) and directly analyzed for T-2 toxin-glucoside, T-2 toxin, and HT-2 toxin by LC-MS/MS using MRM as described above.
Results and Discussion
NMR Analysis of T-2 Toxin-α-glucoside, 2, and T-2 Toxin-β-glucoside, 3
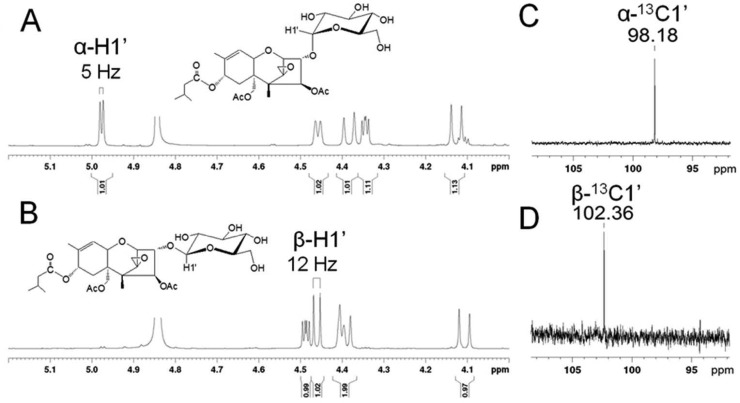
NMR spectra were recorded for T-2 toxin-α-glucoside, obtained by yeast biotransformation (Figure 3A,C) and for chemically synthesized T-2 toxin-β-glucoside (Figure 3B,D). Both compounds are characterized by two spin systems due to a single glucopyranosyl ring and the trichothecene aglycone. The anomeric linkages are characterized by proton signals in the 4.5–5.5 ppm range and the 13C signals by proton signals between 95 and 105 ppm. Consistent with expectations, T-2 toxin-α-glucoside gave a doublet at 4.98 ppm that integrates to a single proton (Figure 3A) and correlates to an adjacent 13C signal at 98.18 ppm (Figure 3C). The observed J1,2 coupling constant of 5 Hz is consistent with a small H1eq–H2ax dihedral angle that is characteristic for α anomers. The chemically synthesized T-2 toxin-β-glucoside is similarly characterized by a larger H1ax–H2ax bond angle, resulting in a definitive J1,2 coupling constant of 12 Hz for the β-anomeric proton at 4.46 ppm (Figure 3B). This H-1 proton correlates to the β-C1 13C NMR anomeric signal at 102.36 ppm (Figure 3D). Hence, the T-2 toxin-glucoside anomers are defined by the observed 1H and 13C chemical shifts and by the characteristic J1,2 coupling constants. These assignments were confirmed by HSQC and, together with HMBC, DEPT, COSY, and NOESY experiments, enable the complete NMR assignment of both epimers.
Figure 3.
Proton NMR spectra of (A) T-2 toxin-α-glucoside, (B) T-2 toxin-β-glucoside with signals for the H1 anomeric proton indicated and 13C NMR anomeric carbon signals of (C) T-2 toxin-α-glucoside (98.18 ppm) and (D) T-2 toxin-β-glucoside (102.36 ppm).
LC-MS Analysis of T-2 Toxin-α-glucoside and T-2 Toxin-β-glucoside Standards
The two epimeric standards, T-2 toxin-α-glucoside prepared with yeast and the synthetic T-2 toxin-β-glucoside, could be separated with LC (Figure 4). In EPI mode, T-2 toxin-α-glucoside and T-2 toxin-β-glucoside [M + NH4]+ ions were subjected to collision-induced dissociation. Under these conditions, T-2 toxin-α-glucoside more readily ionized to yield an [M + H]+ ion than the T-2 toxin β-glucoside, as shown by the relative intensities of the residual [M + NH4]+ and [M + H]+ ions (Figure 5). Other fragment ions were similar to those previously observed from Fusarium-infected grain.10,11
Figure 4.
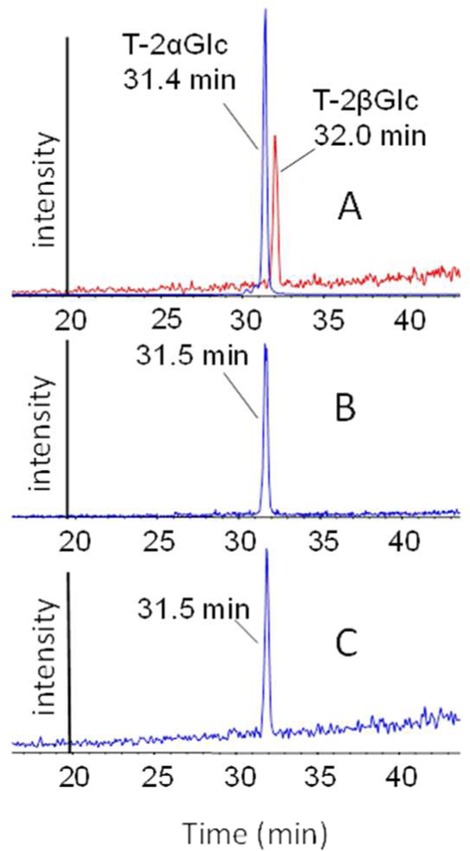
LC-MS/MS chromatograms of (A) T-2 toxin-α-glucoside (T-2αGlc) and T-2 toxin-β-glucoside (T-2βGlc) standards, (B) T-2 toxin-glucoside extracted from wheat, and (C) T-2 toxin-glucoside extracted from oats.
Figure 5.
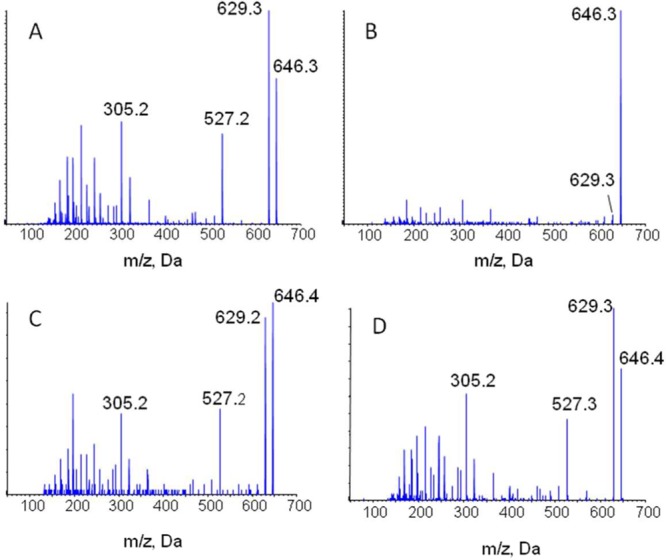
Tandem mass spectrum of the [M + NH4]+ ion of (A) T-2 toxin-α-glucoside, (B) T-2 toxin-β-glucoside, (C) T-2 toxin-glucoside from oats, and (D) T-2 toxin-glucoside from wheat.
LC-MS Analysis of Naturally Contaminated Cereals
To determine the form of T-2 toxin-glucoside present in contaminated oats and wheat, extracts were analyzed with LC-MS/MS and compared to the standard T-2 toxin-α-glucoside and T-2 toxin-β-glucoside (Figure 4). Under the conditions used, T-2 toxin-α-glucoside eluted at 31.4 min and T-2 toxin-β-glucoside at 32.0 min. T-2 toxin-glucoside was detected at 31.5 min in oat and wheat samples, consistent with T-2 toxin-α-glucoside (Figure 4). In addition, there were differences in the mass spectra of the two isomers, showing the same fragment ions but with different relative intensities. Similar to T-2 toxin-α-glucoside, the yeast biotransformation product, the T-2 toxin-glucoside from oats and wheat, had the prominent [M + H]+ product ion from the [M + NH4]+ ion (Figure 5).
Digestive Study on Anomeric Forms of T-2 Toxin-glucoside
In this study, the stability under in vitro gastrointestinal conditions and the catabolic fate of both T-2 toxin-α-glucoside and T-2 toxin-β-glucoside were tested in a human gut microbioma assay and compared to T-2 toxin. The simulated digestion assay used was developed to mimic the human gastrointestinal process.14,16
We found that the T-2 toxin-glucosides were unchanged after incubation with human artificial saliva. These results are similar to those reported for deoxynivalenol glucoside and zearalenone glucoside14 and further demonstrate the stability of some α- and β-glucosidic bonds upon digestion.
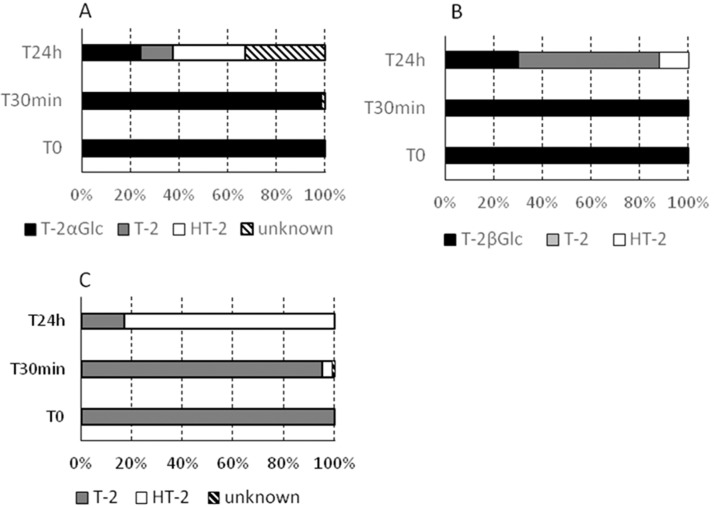
In contrast to zearalenone glucoside, which was hydrolyzed in the first 30 min of colonic fermentation,9 T-2 toxin and the T-2 toxin-glucosides were relatively stable for the first 30 min (Figure 6). There was significant degradation after 24 h (Figure 6). T-2 toxin was mainly transformed into its derivative HT-2 toxin (83% at t = 24 h). T-2 toxin-α-glucoside and T-2 toxin-β-glucoside were both strongly degraded after 24 h, with <30% of the starting material remaining. The degradation pathway is different between α- and β-forms. The latter was mainly cleaved to release its precursor T-2 toxin (58%) with a smaller percentage of HT-2 toxin (12%), whereas the former is converted into T-2 toxin (13%), HT-2 toxin (30%), and other metabolites of unknown structure and toxicity (33%).
Figure 6.
Degradation upon human colonic microbiota fermentation of (A) T-2 toxin-α-glucoside (T-2αGlc), (B) T-2 toxin-β-glucoside (T-2βGlc), and (C) T-2 toxin (T-2). HT-2 toxin (HT-2).
Because smaller amounts of T-2 toxin remained following colonic fermentation with T-2 toxin-α-glucoside, it may pose less of a risk than T-2 toxin-β-glucoside, which is not known to occur in crops. However, T-2 toxin-α-glucoside was also converted into other, as yet uncharacterized, compounds (Figure 6). In addition to T-2 toxin and HT-2 toxin, other possible products of T-2 toxin-glucoside include HT-2 toxin-glucoside, T-2 triol, and T-2 tetraol. It is important to consider the toxicity of all of the products when the risk posed by T-2 toxin-α-glucoside in grain is assessed.
Phytotoxicity
The relative toxicity of T-2 toxin and the T-2 toxin-glucosides was tested with C. reinhardtii cultures. Previous studies have shown that T-2 toxin is quite phytotoxic32 and T-2 toxin-α-glucoside is nontoxic.27 In this study, cultures grown in 100 μM T-2 had only a slight increase in the number of cells, with 0.6 doubling after 4 days. In contrast, neither T-2 toxin-α-glucoside nor T-2 toxin-β-glucoside was phytotoxic, with 5.4 and 5.5 doublings, respectively, which are similar to the 5.3 doublings observed for cultures treated with acetone alone.
Antibody Detection of T-2 Toxin and T-2 Toxin-glucosides with Two Immunoassays
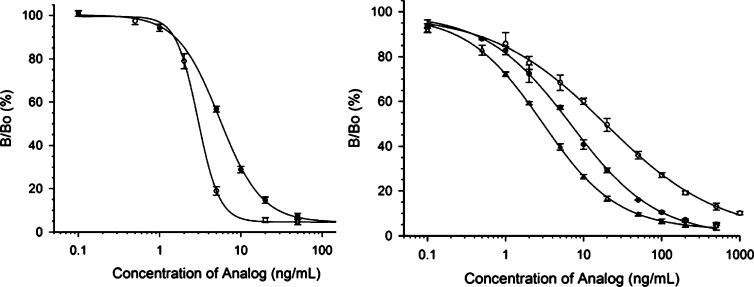
T-2 toxin-glucoside standards were each tested in two immunoassays. The first immunoassay was a competitive indirect ELISA format using Mab 2-13, an antibody developed with T-2 toxin-α-glucoside.28 Mab 2-13 recognized T-2 toxin α-glucoside slightly better than T-2 toxin (cross reaction 108%), whereas T-2 toxin-β-glucoside was recognized more poorly, at about 57% relative to T-2 toxin (Table 1; Figure 7A). This makes this antibody-based test suitable for the detection of both T-2 toxin and the naturally occurring T-2 toxin-α-glucoside.
Table 1. Cross-Reactivity of ELISA toward T-2 Toxin-α-glucoside and T-2 Toxin-β-glucoside.
| analogue | av IC50 ± 1 SD (ng/mL) | cross-reactivity (relative to T-2 toxin, %) |
|---|---|---|
| Mab 2-13 ELISA | ||
| T-2 toxina | 3.3 ± 0.1 | 100 |
| T-2 toxin-α-glucoside | 3.04 ± 0.16 | 108 ± 5.7 |
| T-2 toxin-β-glucoside | 5.80 ± 0.16 | 56.9 ± 1.6 |
| Commercial T-2 Toxin/HT-2 Toxin Kit | ||
| T-2 toxin | 3.03 ± 0.13 | 100 |
| T-2 toxin-α-glucoside | 18.9 ± 2.4 | 16.0 ± 2.0 |
| T-2 toxin-β-glucoside | 6.65 ± 0.58 | 45.5 ± 4.0 |
Data for T-2 toxin with this immunoassay are from Maragos et al.28
Figure 7.
ELISA responses. (A) CI-ELISA responses of T-2 toxin-α-glucoside (open circles) and T-2 toxin-β-glucoside (solid circles) with Mab 2-13. Data shown are the averages from four plates, with six replicates per toxin concentration per plate (n = 24), ± 1 standard deviation. Curves represent the fit of a logistic dose–response equation over the indicated concentration range (0.1–200 ng/mL). (B) ELISA responses of T-2 toxin (open triangles), T-2 toxin-α-glucoside (open circles), and T-2 toxin-β-glucoside (solid circles) to Neogen Veratox T-2/HT-2 antibody. Data shown are the averages from three plates per toxin, with four replicates per toxin concentration per plate (n = 12), ± 1 standard deviation. Curves represent the fit of a logistic dose–response equation over the indicated concentration range (0.1–1000 ng/mL).
The second immunoassay was a commercially available T-2/HT-2 kit. This kit was used to determine if an ELISA, developed before the glucosides of T-2 and HT-2 toxins were even discovered, could detect these “masked” mycotoxins. The commercial ELISA test kit for T-2 toxin and HT-2 toxin detection performed very well for detecting T-2 toxin with good sensitivity and good reproducibility. In addition, the kit cross-reacted fairly well with the T-2 toxin-β-glucoside, but poorly with the T-2 toxin-α-glucoside (Table 1; Figure 7B). However, given that T-2 toxin-α-glucoside is the form found in naturally contaminated samples and that the cross-reaction with this anomer was only about 16%, this test kit would not be recommended for the simultaneous screening of T-2 toxin and T-2 toxin-α-glucoside.
The ability of plants to form trichothecene glucosides can be seen as a detoxification mechanism that plants use when infected with trichothecene-producing fungi. Because trichothecenes can be virulence factors in plant disease,34 expression of trichothecene UGT genes in plants is a potential way to increase disease resistance to trichothecene-producing fungi. This approach may reduce disease and thereby decrease the amount of trichothecenes. However, both the trichothecenes and their masked forms need to be considered to accurately assess the risk to human and animal health posed by plant material contaminated with trichothecenes.
Sufficient amounts of T-2 toxin-glucoside are needed to determine the risk posed by the masked form of T-2 toxin in cereals, to develop reliable methods for their detection, and to study the stability, digestive fate, and toxicity of T-2 toxin-glucoside formed in plant materials. Whereas the synthesis of deoxynivalenol-glucoside is relatively straightforward,35 this method was not amenable to the preparation of T-2 toxin-glucosides because the isovaleryl and acetyl groups are labile during the synthesis. A synthesis employing a superarmed tetra-O-triisopropylsilyl protected donor36 offered a way to selectively remove the protecting groups from the sugar portion of the glucoside without disturbing the isovaleryl and acetyl groups of T-2 toxin, thus providing a means to synthesize T-2 toxin-β-glucoside. Microbial T-2 toxin-α-glucoside was prepared as a single anomer with B. muscicola yeast cultures,27 On the basis of LC and LC-MS chromatographic comparisons and MS/MS analyses, the T-2 toxin-glucoside occurring in contaminated wheat and oats was found to be identical to the yeast biotransformation product, T-2 toxin-α-glucoside.
It is notable that naturally occurring T-2 glucoside has an α-linked sugar, whereas naturally occurring deoxynivalenol glucoside has a β-linked sugar. Although β-linked sugars are more commonly found with xenobiotics and natural products including flavonoids,37 there is a report of Fusarium cultures producing an α-linked glycoside, 15-monoacetoxyscirpenol-4-α-glucoside.38 The Blastobotrys glucosyltransferase that converts T-2 toxin to T-2 toxin-α-glucoside has not been identified, but there may be substrate preferences between the UGT that lead to trichothecene α- or β-glucosides.
Although the focus of this study was the T-2 toxin-glucosides, HT-2 toxin-glucosides have also been reported in contaminated grain11 and in culture material.10 They may be formed either by hydrolysis of T-2 toxin-α-glucoside or by conversion of T-2 toxin to HT-2 toxin followed by glycosylation at C-3 or C-4. It is possible that the latter route may utilize different glucosyltransferases that result in a β orientation. To date, no plant UGT that converts T-2 toxin to T-2 toxin-α-glucoside has been identified. Numerous glucosyltransferases were screened to identify one that had good substrate specificity for deoxynivalenol.23 Although the T-2 toxin-glucoside found in naturally contaminated oats and wheat was identical to the T-2 toxin-α-glucoside prepared with yeast cultures,27 the anomericity of HT-2 toxin-glucosides has not been determined.
The present study has demonstrated that naturally occurring T-2 toxin-glucoside has an α-linked sugar and that T-2 toxin-α-glucoside can be prepared with B. muscicola in sufficient quantity to study its animal toxicity. The U.S. FDA has not provided guidance levels to the agricultural industry for T-2 toxin or related trichothecenes. The European Food Safety Authority (EFSA) established a group tolerable daily intake of 100 ng/kg body weight for T-2 and HT-2 toxins.39 However, at present it is not possible to perform a proper risk assessment for masked mycotoxins in food, due to the lack of data on exposure and toxic properties. Masked mycotoxins may elude analysis because of altered physical properties or because of modification of an epitope recognized by antibodies used for the detection, leading to an underestimation of the total mycotoxin load. Possible release during food processing is also a concern, and EFSA currently has a working group on the public health risk of masked mycotoxins in food and animal feed. Research on masked mycotoxins is hampered by the nonavailability of analytical standards or calibrants, and only one compound, deoxynivalenol-3-β-glucoside, is commercially available.
The occurrence of T-2 toxin-α-glucoside in wheat and oat samples, and its metabolism by microbes during digestion, suggests that there is a risk in underestimation of the total T-2 toxin load and a need to monitor both mycotoxins and their conjugated forms in cereals and food products. To promote research efforts in the area of masked mycotoxins, T-2 toxin-α-glucoside has now been made available to the scientific community by the authors.
Acknowledgments
We thank Karl Vermillion for NMR analyses and Jennifer Teresi for technical assistance with Chlamydomonas assays. D.C. thanks the NSF (MRI-084043) for funds to purchase the 600 MHz NMR spectrometer in the Lumigen Instrument Center at WSU.
Supporting Information Available
Figures S1–S11. This material is available free of charge via the Internet at http://pubs.acs.org.
D.C. thanks the NIH (GM62160) for support of the synthetic work.
The authors declare no competing financial interest.
Funding Statement
National Institutes of Health, United States
Supplementary Material
References
- Aoki T.; O’Donnell K.; Homma Y.; Lattanzi A. R. Sudden-death syndrome of soybean is caused by two morphologically and phylogenetically distinct speces with the Fusarium solani species complex, F. virguliforme in North America and F. tucumaniae in South America. Mycologia 2003, 95, 660–684. [PubMed] [Google Scholar]
- McMullen M.; Bergstrom G.; De Wolf E.; Dill-Macky R.; Hershman D.; Shaner G.; Van Sanford D. A unified effort to flight an enemy of wheat and barley: Fusarium head blight. Plant Dis. 2012, 96, 1712–1728. [DOI] [PubMed] [Google Scholar]
- McMullen M.; Jones R.; Gallenberg D. Scab of wheat and barley: a re-emerging disease of devastating impact. Plant Dis. 1997, 81, 1340–1348. [DOI] [PubMed] [Google Scholar]
- Mesterhazy A.; Lemmens M.; Reid L. M. Breeding for resistance to ear rots caused by Fusarium spp. in maize – a review. Plant Breed. 2012, 131, 1–19. [Google Scholar]
- Wu F.; Groopman J. D.; Pestka J. J. Public health impacts of foodborne mycotoxins. Annu. Rev. Food Sci. Technol. 2014, 5, 351–372. [DOI] [PubMed] [Google Scholar]
- Richard J. L. Some major mycotoxins and their mycotoxicoses – an overview. Int. J. Food Microbiol. 2007, 119, 3–10. [DOI] [PubMed] [Google Scholar]
- Rocha O.; Ansari K.; Doohan F. M. Effects of trichothecene mycotoxins on eukaryotic cells: a review. Food Addit.Contam. 2005, 22, 369–378. [DOI] [PubMed] [Google Scholar]
- Sewald N.; Lepschy von Gleissenthall J.; Schuster M.; Müller G.; Alpin R. T. Structure elucidation of a plant metabolite of 4-desoxynivalenol. Tetrahedron: Asymmetry 1992, 3, 953–960. [Google Scholar]
- Paris M. P. K.; Schweiger W.; Hametner C.; Stückler R.; Muehlbauer G. J.; Varga E.; Krska R.; Berthiller F.; Adam G. Zearalenone-16-O-glucoside: a new masked mycotoxin. J. Agric. Food Chem. 2014, 62, 1181–1189. [DOI] [PubMed] [Google Scholar]
- Busman M.; Poling S. M.; Maragos C. M. Observation of T-2 toxin and HT-2 toxin glucosides from Fusarium sporotrichioides by liquid chromatography coupled to tandem mass spectrometry (LC-MS/MS). Toxins 2011, 3, 1554–1568. [DOI] [PMC free article] [PubMed] [Google Scholar]
- Lattanzio V. M. T.; Visconti A.; Haidukowski M.; Pascale M. Identification and characterization of new Fusarium masked mycotoxins, T2 and HT2 glycosyl derivatives, in naturally contaminated wheat and oats by liquid chromatography-high resolution mass spectrometry. J. Mass Spectrom. 2011, 47, 466–475. [DOI] [PubMed] [Google Scholar]
- Berthiller F.; Crews C.; Dall-Asta C.; De Saeger S.; Haesaert G.; Karlovsky P.; Oswald I. P.; Seefelder W.; Speijers G.; Stroka J. Masked mycotoxins: a review. Mol. Nutr. Food Res. 2013, 57, 165–186. [DOI] [PMC free article] [PubMed] [Google Scholar]
- Shin S.; Torres-Acosta J. A.; Heinen S. J.; McCormick S.; Lemmens M.; Kovalsky Paris M. P.; Berthiller F.; Adam G.; Muehlbauer G. J. Transgenic Arabidopsis thaliana expressing a barley UDP-glucosyltransferase exhibit resistance to the mycotoxin deoxynivalenol. J. Exp. Bot. 2012, 63, 4731–4740. [DOI] [PMC free article] [PubMed] [Google Scholar]
- Dall-Erta A.; Cirlini M.; Dall-Aasta M.; Del Rio D.; Galaverna G.; Dall’Asta C. Masked mycotoxins are efficiently hydrolyzed by human colonic microbiota releasing their aglycones. Chem. Res. Toxicol. 2013, 25, 305–312. [DOI] [PubMed] [Google Scholar]
- De Angelis E.; Monaci L.; Pascale M.; Visconti A. Fate of deoxynivalenol, T-2 and HT-2 toxins and their glucoside conjugates from flour to bread: an investigation by high-performance liquid chromatography high-resolution mass spectrometry. Food Addit. Contam., Part A 2013, 30, 345–355. [DOI] [PubMed] [Google Scholar]
- Dall’Asta C.; Falavigna C.; Galaverna G.; Dossena A.; Marchelli R. In vitro digestion assay for determination of hidden fumonisins in maize. J. Agric. Food Chem. 2010, 58, 12042–12047. [DOI] [PubMed] [Google Scholar]
- Nagl V.; Schwarz H.; Krska R.; Moll W. D.; Knasmüller S.; Ritzmann M.; G A.; Berthiller F. Metabolism of the masked mycotoxin deoxynivalenol-3-glucoside in rats. Toxicol. Lett. 2012, 213, 367–373. [DOI] [PMC free article] [PubMed] [Google Scholar]
- Berthiller F.; Dall’Asta C.; Corrodini R.; Marchelli R.; Sulyok M.; Krska R.; Adam G.; Schuhmacher R. Occurrence of deoxynivalenol and its 3-β-d-glucoside in wheat and maize. Food Addit. Contam. 2009, 26, 507–511. [DOI] [PubMed] [Google Scholar]
- Kostelanska M.; Hajslova J.; Zachariasova M.; Malachova A.; Kalachova K.; Postka J.; Fiala J.; Scott P. M.; Berthiller F.; Krska R. Occurrence of deoxynivalenol and its major conjugate, deoxynivalenol-3-glucoside, in beer and some brewing intermediates. J. Agric. Food Chem. 2009, 57, 3187–3194. [DOI] [PubMed] [Google Scholar]
- Berthiller F.; Dall’Asta C.; Schuhmacher R.; Lemmens M.; Adam G.; Krska R. Masked mycotoxins: determination of a deoxynivalenol glucoside in artificially and naturally contaminated wheat by liquid chromatography-tandem mass spectrometry. J. Agric. Food Chem. 2005, 3421–3425. [DOI] [PubMed] [Google Scholar]
- Schweiger W.; Boddu J.; Shin S.; Poppenberger B.; Berthiller F.; Lemmens M.; Muehlbauer G. J.; Adam G. Validation of a candidate deoxynivalenol-inactivating UDP-glucosyltransferase from barley by heterologous expression in yeast. Mol. Plant–Microbe Interact. 2010, 23, 977–986. [DOI] [PubMed] [Google Scholar]
- Schweiger W.; Pasquel J.-C.; Nussbaumer T.; Kovalsky Paris M. P.; Wiesenberger G.; Macadré C.; Ametz C.; Berthiller F.; Lemmens M.; Saindrenan P.; Mewes H.-W.; Mayer K. F. X.; Dufresne M.; Adam G. Functional characterization of two clusters of Brachypodium distachyon UDP-glycosyltransferases encoding putative deoxynivalenol detoxification genes. Mol. Plant–Microbe Interact. 2013, 26, 781–792. [DOI] [PubMed] [Google Scholar]
- Schweiger W.; Steiner B.; Limmongkon A.; Brunner K. Cloning and heterologous expression of candidate DON-inactivating UDP-glucosyltransferases from rice and wheat in yeast. Plant Breed. Seed Sci. 2011, 64, 105–111. [Google Scholar]
- Berthiller F.; Krska R.; Domig K. J.; Kneifel W.; Juge N.; Schuhmacher R.; Adam G. Hydrolytic fate of deoxynivalenol-3-glucoside during digestion. Toxicol. Lett. 2011, 206, 264–267. [DOI] [PMC free article] [PubMed] [Google Scholar]
- De Nijs M.; Van den Top H. J.; Portier L.; Oegema G.; Kramer E.; Can Egmond H. P.; Hoogenboom L. A. P. Digestibility and absorption of deoxynivalenol 3-β-glucoside in in vitro models. World Mycotox. J. 2012, 5, 325–334. [Google Scholar]
- Gratz S. W.; Duncan G.; Richardson A. J. The human fecal microbiotia metabolizes deoxynivalenol and deoxynivalenol-3-glucoside and may be responsible for urinary deepoxy-deoxynivalenol. Appl. Environ. Microbiol. 2013, 79, 1821–1825. [DOI] [PMC free article] [PubMed] [Google Scholar]
- McCormick S. P.; Price N. P. J.; Kurtzman C. P. Glucosylation and other biotransformations of T-2 toxin by yeasts of the Trichomonascus clade. Appl. Environ. Microbiol. 2012, 78, 8694–8702. [DOI] [PMC free article] [PubMed] [Google Scholar]
- Maragos C. M.; Kurtzman C.; Busman M.; Price N.; McCormick S. Development and evaluation of monoclonal antibodies for the glucoside of T-2 toxin (T2-Glc). Toxins 2013, 5, 1299–1313. [DOI] [PMC free article] [PubMed] [Google Scholar]
- Samhueza C. A.; Dorta R. L.; Vázquez J. T. Involvement of the S-aglycon in the conformational preferences of thioglucosides. Tetrahedron: Asymmetry 2008, 19, 258–264. [Google Scholar]
- Okada Y.; Mukae T.; Okajima K.; Taira M.; Fujita M.; Yamada H. Highly β-selective O-glucosidation due to the restricted twist-boat conformation. Org. Lett. 2007, 9, 1573–1576. [DOI] [PubMed] [Google Scholar]
- Vic G.; Hasting J. J.; Howarth O. W.; Crout D. H. G. Chemoenzymatic synthesis of ethyl 1-thio-(β-d-galactopyranosyl)-O-[O-β-d-glycopyranosyl disaccharides using the β-galactosidase from Bacillus circulans. Tetrahedron: Asymmetry 1996, 7, 709–720. [Google Scholar]
- Alexander N. J.; McCormick S. P.; Ziegenhorn S. L. Phytotoxicity of selected trichothecenes using Chlamydomonas reinhardtii as a model system. Nat. Toxins 1999, 7, 265–269. [DOI] [PubMed] [Google Scholar]
- Versantvoort C. H. M.; Oomen A. G.; Van de Kamp E.; Rompelberg C. J. M.; Sips A. J. Applicability of an in vitro digestion model in assessing the bioaccessibility of mycotoxins from food. Food Chem. Toxicol. 2005, 43, 31–40. [DOI] [PubMed] [Google Scholar]
- Desjardins A. E.; Proctor R. H.; Bai G.; McCormick S. P.; Shaner G.; Beuchley G.; Hohn T. M. Reduced virulence of trichothecene-non-producing mutants of Gibberella zeae in wheat field tests. Mol. Plant–Microbe Interact. 1996, 9, 775–781. [Google Scholar]
- Savard M. E. Deoxynivalenol fatty acid and glucoside conjugates. J. Agric. Food Chem. 1991, 39, 570–574. [Google Scholar]
- Pedersen C. M.; Marinescu L. G.; Bols M. Glycosyl donors in “unusual” conformations – influence on reactivity and selectivity. C. R. Chim. 2011, 14, 17–43. [Google Scholar]
- Bowles D.; Isayenkova J.; Lim E.-K.; Poppenberger B. Glycosyltransferases: managers of small molecules. Curr. Opin. Plant Biol. 2005, 8, 254–263. [DOI] [PubMed] [Google Scholar]
- Gorst-Allman C. P.; Steyn P. S.; Vleggaar R. Structure elucidation of a novel trichothecene glucoside using 1H and 13C nuclear magnetic resonance spectroscopy. J. Chem. Soc., Perkin Trans. 1 1985, 1985, 1553–1555. [Google Scholar]
- European Food Safety Authority. Commision recommendation of 27 March 2013 on the presence of T-2 and HT-2 toxin in cereals and cereal products. Off. J. Eur. Union 2013, L91, 12–14. [Google Scholar]
Associated Data
This section collects any data citations, data availability statements, or supplementary materials included in this article.


