

Abstract
Human children possess the ability to approximate numerical quantity nonverbally from a young age. Over the course of early childhood, children develop increasingly precise representations of numerical values, including a symbolic number system that allows them to conceive of numerical information as Arabic numerals or number words. Functional brain imaging studies of adults report that activity in bilateral regions of the intraparietal sulcus (IPS) represents a key neural correlate of numerical cognition. Developmental neuroimaging studies indicate that the right IPS develops its number-related neural response profile more rapidly than the left IPS during early childhood. One prediction that can be derived from previous findings is that there is longitudinal continuity in the number-related neural responses of the right IPS over development while the development of the left IPS depends on the acquisition of numerical skills. We tested this hypothesis using fMRI in a longitudinal design with children ages 4 to 9. We found that neural responses in the right IPS are correlated over a 1-2 year period in young children whereas left IPS responses change systematically as a function of children’s numerical discrimination acuity. The data are consistent with the hypothesis that functional properties of the right IPS in numerical processing are stable over early childhood whereas the functions of the left IPS are dynamically modulated by the development of numerical skills.
INTRODUCTION
Children begin to show behavioral signatures of numerical processing in infancy, before they can talk. Six-month-old infants can discriminate a set of 6 dots from 12 dots, a sequence of 12 tones from 24 tones, and they recognize numerical equivalence between the number of individuals they see and the number of vocalizations they hear (Xu & Spelke, 2000; Lipton & Spelke, 2003; Jordan & Brannon, 2006). One- and two-year-old children can select the numerically larger of two food quantities or toy sets using approximation (Gelman, 1986; Brannon & Van de walle, 2001). Thus, infants and children can discriminate numerical quantities prior to the development of words or symbols for numbers. The ability to discriminate numerical values without words or symbols is limited, however, in that quantities can only be discriminated approximately. Substantial evidence indicates that infants represent numerical quantities as crude analogs of their objective numerical values, wherein the ability to discriminate any two values depends on the numerical ratio between them (Weber’s law; see Cordes & Brannon, 2008; Libertus & Brannon, 2009 for review). In the first several years of development, the ability to approximate numerical values improves as children refine their ability to make numerical discriminations over sets of objects (Halberda & Feigenson, 2008). Cognitive research with young children suggests that these approximate numerical abilities, emerging as early as infancy, ultimately form part of the foundation for the precise, symbolic numerical concepts that develop later in childhood, such as counting and arithmetic (Carey, 2009; Lipton & Spelke, 2005; Gilmore et al, 2007; Halberda, Mazzocco, & Feigenson, 2008).
Neural signatures of approximate numerical processing also emerge early in development. Neuroimaging studies with infants have found that regions of posterior parietal cortex emit a greater neural response to the numerical property of a stimulus compared to its shape or color. Electroencephalogram (EEG) data from infants between 3 and 7 months of age implicate a role for right parietal cortex in numerical processing. Izard et al. (2008) presented 3-month-old infants with a continuous visual stream of object arrays that occasionally varied by the number of objects, identity of objects, or both. They then compared the event-related potentials of “number” deviants to those elicited by “identity” deviants and found right parietal areas were more responsive to number changes than to identity changes. Similarly, Hyde et al (2010) used near infrared spectroscopy (NIRS) with a comparable experimental design to show that 6-month-old infants have a right lateralized parietal BOLD response to numerical changes in stimuli. Further research with 7-month-olds has shown neural responses in right parietal cortex that are modulated by numerical ratio (Libertus, Pruitt, Waldorff, & Brannon 2009). In their study, Libertus et al. collected EEG recordings as infants were familiarized with a series of dot arrays at a constant numerical value. Infants then were shown novel numerical values that varied by a 1:2 or 1:3 ratio from the original series. They found that the power of the alpha frequency band increased as the ratio between the numerical values increased, specifically in the right hemisphere at posterior electrodes. Together those studies support the claim that human infants engage neural processes in right parietal cortex during judgments of approximate numerical value.
The right parietal cortex also has been shown to play a more significant role in approximate numerical processing compared to the left parietal cortex during early childhood. Using fMRI, Cantlon et al. (2006) scanned adults and 4-year-old children as they viewed visual arrays of dots at a fixed numerical value with occasional deviant displays where either the number of dots was increased or decreased (by a 2:1 ratio), or the local element shape was altered (from dots to squares or triangles, holding number constant). In children, they found significantly greater activation in right parietal cortex when the displays changed in number compared to shape, and children’s right parietal activity overlapped in Talairach space with that of adults. However, in contrast to children, adults showed bilateral IPS activation for numerical deviants. Those data suggest that the right IPS might have a more significant number-related function in early childhood with bilateral patterns of activation emerging only later in development. Other fMRI studies have suggested a similar developmental shift from right lateralized to bilateral parietal activation for numerical processing (see Ansari, 2008 for review). A recent fMRI study with 4- to 10-year-old children (Cantlon & Li, 2013) showed that young children’s neural timecourses in number-responsive regions of the right IPS are more similar to those of adults (ie., more mature) than in the left IPS. Finally, early-developing mathematics impairments are associated with right-lateralized functional impairments in the IPS (Molko et al., 2003; Price et al., 2007).
In adulthood, bilateral regions of parietal cortex respond during both approximate numerical processing of non-symbolic stimuli such as visual arrays of objects or tone sequences and during the processing of number symbols such as Arabic numerals or number words (see Nieder & Dehaene, 2009 for review). However, it remains unclear at what point in development symbolic numerical processing elicits an adult-like pattern of bilateral parietal activation. There is some evidence that numerical processing in left parietal cortex correlates with measures of symbolic numerical development in children. Cross-sectional studies with 9- to 13-year-old children have reported correlations between neural activity and age or performance in the left parietal hemisphere for tasks that likely recruit precise, symbolic numerical competencies (eg., Ansari and Dhital, 2006; Bugden, Price, McLean, & Ansari, 2012; Rivera et al. 2005; Rosenberg-Lee, Barth, & Menon, 2011). Those data suggest that neural responses in the left parietal cortex could be more dependent on the acquisition of precise, symbolic numerical skills than neural responses in the right parietal cortex.
Some data from adults support the argument that the left IPS has an advantage over the right IPS for processing precise numerical quantity (see Ansari, 2008 for review; Ansari et al., 2005; Lyons & Ansari, 2009; Piazza et al., 2004; Piazza et al., 2006; Piazza et al., 2007; Pinel & Dehaene, 2010). In one fMRI study, Piazza et al (2004) habituated adult participants to arrays of dots of a constant numerical magnitude, interspersing arrays of novel numerical magnitudes. They showed that the change in the habituated responses of parietal cortex scaled with changes in the novel numerical values, consistent with Weber’s Law. Interestingly, they observed a smaller Weber fraction in the neural response profile of left IPS when compared to right IPS, suggesting that the left IPS is more sensitive to fine differences in numerical values. A left IPS advantage for processing fine differences in numerical value was also observed in a parallel study that tested both non-symbolic and symbolic numerical stimuli in an fMRI adaptation paradigm with adult subjects (Piazza et al., 2007; see also Cohen Kadosh et al, 2007). Similarly, using TMS, Andres et al (2005) stimulated the left and right parietal cortex while adult participants judged whether a numeral was larger or smaller than 5. They found that disrupting only the left parietal hemisphere significantly slowed participant’s judgments to values close to five, whereas bilateral parietal stimulation slowed judgments of values distant from 5. They concluded that neural processing of precise discriminations of numerical values requires the integrity of left parietal cortex.
Taken together, neuroimaging data from children and adults suggest the hypothesis that the right IPS emerges early in development as a source of numerical processing and that numerical processing in the left IPS emerges more slowly and contingent on numerical acuity. Prior studies provide suggestive evidence for developmental differences in the numerical processes of the left versus right IPS. Here, we test the stronger prediction that an individual child will show developmental continuity in their neural responses to numerical stimuli in the right IPS and acuity-dependent developmental change in their left IPS responses to numerical stimuli. We used fMRI to test for continuity versus change in children’s neural responses longitudinally, over a one- to two-year delay. In the first visit, children were scanned with fMRI as they completed a matching task with four categories of stimuli: faces, numbers, shapes, and words. Children returned for a second visit one to two years later to complete the same fMRI task again. We compared number-related neural responses of the right and left IPS between the two time points to assess the relative continuity of the IPS hemispheres over development.
Methods
Participants
Twenty-two typically developing children and twenty adults were tested on the full set of experimental conditions. Motion correction algorithms were applied to each functional scanning session in real time in order to abort scanning if excessive motion was detected and correct the data for minor movements. Five of the children were excluded due to excessive head movements in the fMRI paradigm (>5 mm), leaving seventeen children total (ages 4.47 to 9.08, mean age = 6.63 years, sd = 1.4). Average residual motion after online correction was 0.49 mm translation (σ = 0.50) and 0.50 degrees rotation (σ = .67) in year 1 and 0.44 mm translation (σ = 0.55) and 0.38 degrees rotation (σ = .60) in year 2-3. The average motion deviations in year 1 were not significantly different from their motion in year 2-3 for translation (t(16)=.82, p=.42) or rotation (t(16)=1.51, p=.14). Children’s motion estimates were not correlated between year 1 and year 2-3 for translation (r= .28, p=.27) or rotation (r= .26, p=.31) estimates. Mean motion deviations for adults were 0.06 mm translation (σ = 0.05) and 0.05 degrees rotation (σ = .06).
All participants had normal or corrected to normal vision with no history of neurological impairments or abnormalities. All guidelines and requirements of the University of Rochester’s Research Subjects Review Board were followed for participant recruitment and experimental procedures.
Prior to the MR scanning session, children were given a 10-30 minute training session in a mock scanner to practice the behavioral task, and to practice remaining motionless during scanning. In the actual MR scanner the children’s heads were secured with foam padding and medical tape. Adults were given verbal instructions and a brief practice session.
In a separate session, children were administered the TEMA-3 (H.P. Ginsburg 2003), which measures both formal (i.e. number facts, numeral literacy) and informal (i.e. relative magnitude) mathematics skills. All of the participants showed normal Math IQ, scoring within the range for typically developing children of their age. The TEMA-3 is standardized on a sample of 1,228 children across 15 U.S. states. Standardized scores for the TEMA-3 are presented with a mean of 100 and a standard deviation of 15. The average standardized score of our participants was 115, with a standard deviation of 12, with no child scoring below one standard deviation of the standardized mean.
fMRI Task
Children were asked to compare pairs of stimuli presented on a computer monitor and to report whether the stimuli were the same or different. The stimuli consisted of pairs of images (faces, numbers, words, or shapes) presented to the left and right of a central crosshair (see Figure 1). All stimulus pairs were randomized for side of presentation. Subjects were told to press a response button when the two stimuli in a pair matched. Number pairs were to be matched across notation: digits-to-dot arrays for numerical values ranging from one to nine. Non-matching number pairs were constructed with a difference in value between two and four. Face pairs were to be matched across orientation: one frontal and one at an oblique angle. Word pairs varied in case (upper or lowercase). Shapes were either identical or different. Each child completed two runs of twelve blocks with 36 trials per block. A single run contained three blocks per category, each block lasting twenty seconds, with one pair of stimuli presented every two seconds within a block, followed by a 2 seconds blank screen before the next trial. After each trial block, a fixation screen appeared for 8 seconds. Stimuli were presented as grey-scale (faces) or white images (letters, shapes, Arabic numerals/dot arrays) on a green background. When a pair of stimuli was presented, participants were instructed to press a response button only if the two stimuli matched. No response indicated a “non-match”. Fifty percent of the trials, distributed at random across each stimulus type, were “matches”, while the other 50% were “non-matches”. Accuracy and response time were measured.
Figure 1.
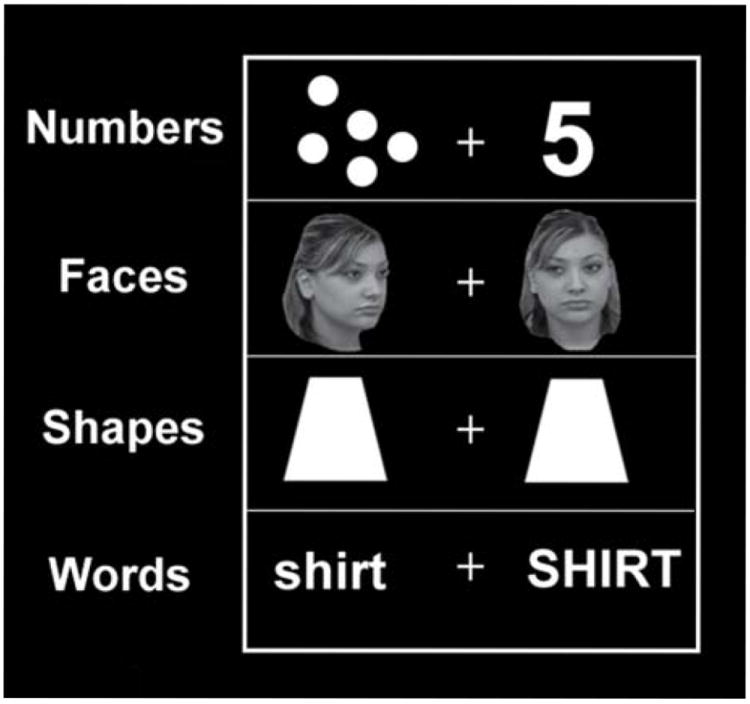
Examples of each of the four matching task conditions.
MR parameters
Whole brain BOLD imaging was conducted on a 3-Tesla Siemens MAGNETOM Trio scanner with a 12-channel head coil at the Rochester Center for Brain Imaging. High-resolution structural T1 contrast images were acquired using a magnetization prepared rapid gradient echo (MP-RAGE) pulse sequence at the start of each session [TR = 2530 ms, TE = 3.44 ms flip angle = 7 degrees, FOV = 256 mm, matrix = 256 × 256, 160 or 176 (depending on head size) 1×1×1mm sagittal left-to-right slices].
An echo-planar imaging pulse sequence with online motion correction was used for T2* contrast (TR = 2000 ms, TE = 30 ms, flip angle = 90 degrees, FOV = 256 mm, matrix 64 × 64, 30 sagittal left-to-right slices, voxel size = 4×4×4mm). The matching paradigm was conducted in 2 functional runs of 132 volumes each. Total scanning time was approximately 40 minutes.
Preprocessing
Data were processed using BrainVoyager QX 2.8 (Brain Innovation; Goebel et al. 2006), along with the BVQX Toolbox for MATLAB and in-house MATLAB scripts. The first 2 volumes from each run were removed to allow longitudinal magnetization to reach steady state. Functional data sets were then preprocessed; steps included rigid-body motion correction, slice scan timing correction, linear trend removal, and high pass filtering (cutoff = 3 cycles per series). Functional data were coregistered to high-resolution anatomical images, which were in turn normalized to Talairach space (Talairach & Tournoux 1988). Normalization was performed in 2 steps: images were first aligned with stereotactic axes and then transformed to the Talairach grid using a piecewise affine transformation based on manual identification of the anterior and posterior commissure and the edges of cortex along each axis. Subsequent analyses were performed on preprocessed data in a space of 4mm3 isovoxel resolution aligned with Talairach space.
ROI Definitions
A random effects general linear model (GLM) analysis was conducted on the adult functional data. The model included 11 parameters: 4 experimental parameters for the task categories (faces, numbers, shapes, and words), button presses, and 6 motion regressors as confounds. Each experimental parameter was convolved with a standard dual gamma hemodynamic response function. A GLM with a contrast of numbers greater than all other categories (Numbers > Faces, Words, & Shapes) at a FDR corrected threshold of q < .05 yielded five regions of interest. These regions included: (1) bilateral PFC/IFG/anterior Insula, corresponding to BA 47 /13; (2) bilateral IPS including BA 40, and (3) anterior cingulate. ROIs were labeled according to the Talairach and Tournoux (1988) atlas.
Behavioral Measures
Accuracy was calculated as the total number of correct matches plus the total number of correct rejections divided by the total trials. Mean RT was computed for correct matches. The numerical distance effect was computed by calculating, for each child, the area under the curve formed by their percentages of “same” responses to distances of 0 (same quantity), 2 (numerical distance of 2), 3, and 4. This measure assessed children’s numerical acuity.
RESULTS
Behavioral Results
Behavioral measures at Year 1(Time 1) and Year 2-3 (Time 2) included response time (RT) and accuracy on the matching task, which was calculated for each of the four categories (Figure 2). RT and accuracy were compared across categories as well as across time points in a 4 × 2 repeated measures ANOVA. Posthoc tests were conducted to compare between-category and between-time point effects. We further calculated the numerical distance effect for each of the children, by estimating the area under the curve of their numerical matching performance function.
Figure 2.
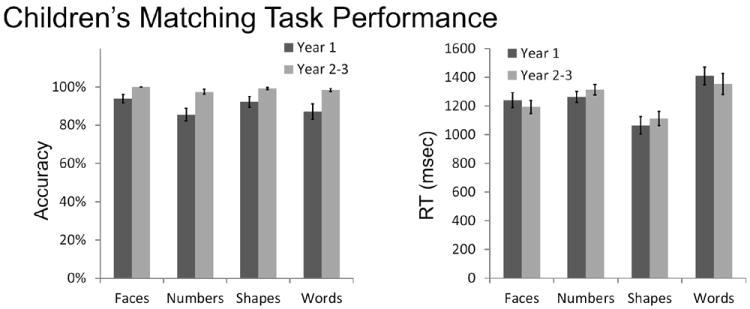
Children’s average Accuracy (left) and Reaction Time (right) on each category of the matching task in Year 1 and Year 2-3.
For RT, there was a marginally significant main effect of category (F(3,14=2.47, p=.07) and no main effect of Year(F(1,16)=.68, p=.42). At Year 1, responses to numbers (mean=1193 ms) were intermediate among categories: they were significantly faster than responses to words (mean=1243 ms, p=.05), significantly slower than responses to shapes (mean=1064 ms, p=.008), and no different from responses to faces (mean=1240 ms, p=.72). At Year 2-3, the average RT to numbers (mean= 1313 ms) was again intermediate: significantly slower than to faces (mean= 1193ms, p = .046) and shapes (mean= 1113ms, p=.002), but not significantly different than responses to words (mean=1273ms, p=.63).
For Accuracy, there was a main effect of both category (F(3,14_=4.36, p=.009) and Time (F(1,16=14.01, p=.002), but no interaction (F(3,14)=1.91, p=.14). For Year 1 and Year 2, accuracy for face matching was significantly better than accuracy for number matching (T1: p= .048, T2: p=.047), but no other significant differences in accuracy were observed between the numerical category and any other category (all p>.14).
These analyses of accuracy and RT show that the number category exhibited neither the slowest/fastest response nor the greatest/least difficulty among the four task categories tested. Thus, the children’s behavioral data do not support an argument that the numerical task recruits greater/less general cognitive or response-related resources compared to the other categories.
Adults performed at ceiling accuracy (99%) and showed no significant differences in accuracy among categories (One-way ANOVA: F(3,79) = 0.51, p = 0.68). Adults responded rapidly across categories (845ms) and the only significant difference among categories was significantly faster RTs on the shape category compared to all other categories (Post-hoc tests; Shape (664ms) vs Faces (822ms), p < .05; Shape (664ms) vs Number (947ms), p < .001; Shape (664ms) vs Words (945ms), p < .001; all other p’s > .11). Children’s response times in year 1 (mean=1244ms) and year 2-3 (mean = 1243ms) were significantly slower than adults (mean = 845ms, p<.001) and children were significantly less accurate than adults across categories in year 1 (mean= 89.6%, p <.01), but not in year 2-3 (mean =98.7%, p=.57). Adults represent the developmental endpoint for these cognitive tasks by performing with rapid response times and ceiling accuracy.
Both RT and accuracy correlated with age in children. In all categories, RT decreased with age (all r’s <-.38, all p’s <.05). Accuracy increased with age for all categories (all r’s >.46, all p’s <.01) except faces (r=.26, p=. 14). Children performed close to ceiling on the face-matching task from the first behavioral measurement. Figure 3 shows the relationship between age and accuracy for each category in the matching task.
Figure 3.
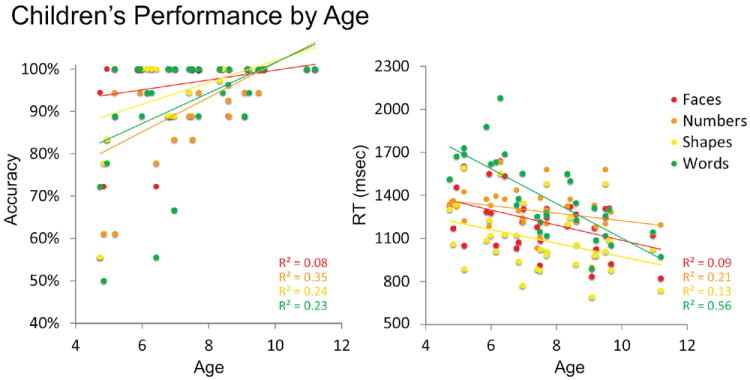
Accuracy (left) and Reaction Time (right) generally improved with age for each category.
The numerical distance effect was calculated for each child at Time 1 and Time 2. As described in Methods, the area under the numerical matching curve was calculated for each child as a measure of the numerical distance effect (Figure 4). As expected, we observed a significant decrease in children’s distance effect from time 1 to time 2 (t(16)=2.82, p=.012), indicating a sharpening of numerical acuity over development.
Figure 4.
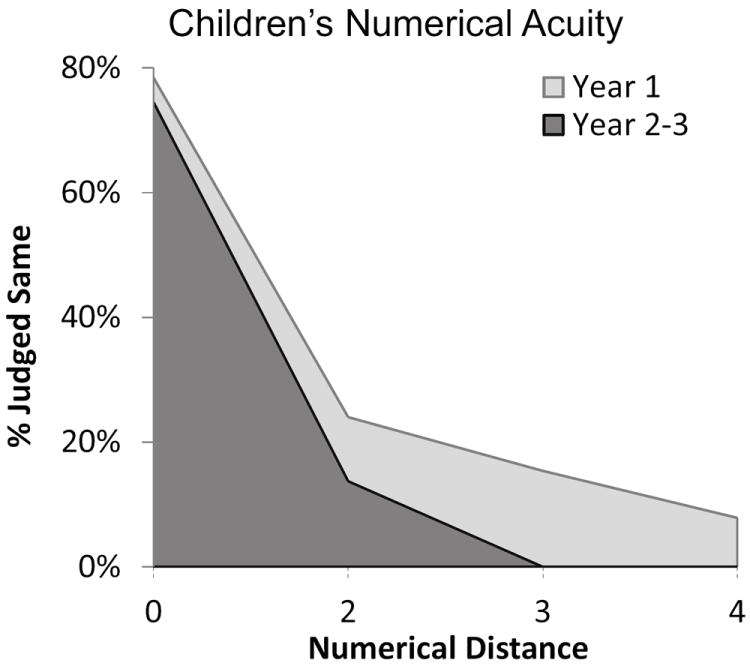
Children’s numerical acuity increased between Year 1 and Year 2-3.
fMRI Results
We used the fMRI data collected during the matching task to localize areas of the brain that showed category-selectivity for numbers in adults (Numbers > Faces, Words, and Shapes, at an FDR corrected threshold of p < .05). The analysis revealed a network of number-selective regions in frontal and parietal cortices for adults (Figure 5). Number-selective activations included bilateral IPS, anterior cingulate cortex (ACC), and inferior frontal gyrus and contiguous insular cortex bilaterally (IFG/Insula), as shown in Figure 5. Table 1 presents the peak coordinates of these number-related activation sites from adults.
Figure 5.
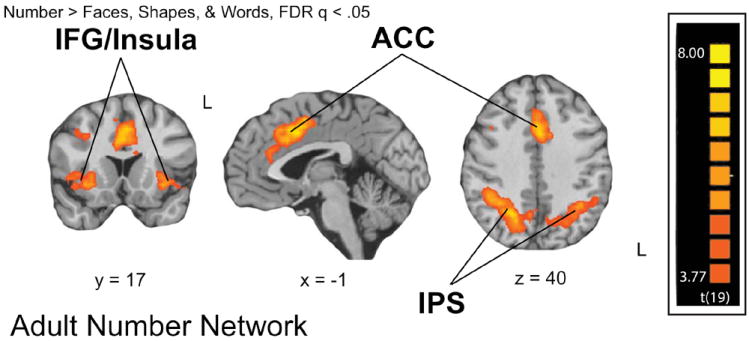
Adult Number-related Network revealed by the contrast Numbers > Faces, Words, and Shapes.
Table 1.
Peak coordinates of Adult number-related activation locii and their corresponding Brodmann areas.
| Area of Activation | Cluster size (mm3) | Peak X | Peak Y | Peak Z | Brodmann Area | t |
|---|---|---|---|---|---|---|
| Right Intra-Parietal Sulcus | 12057 | 29 | -56 | 36 | 40 | 9.86 |
| Left PFC: IFG/Insula | 890 | -34 | 15 | -3 | 47,13 | 6.79 |
| Left Intra-Parietal Sulcus | 6308 | -32 | -57 | 35 | 40 | 7.25 |
| Right PFC: IFG/Insula | 838 | 32 | 17 | -3 | 47,13 | 6.40 |
| Anterior Cingulate | 8879 | -1 | 18 | 36 | 32,6 | 9.06 |
Prior studies have suggested that number-selective activation could be related to general task difficulty and response selection (e.g., Gobel, Johansen-Berg, Behrens, & Rushworth, 2004). In order to test whether number-selective activation was related to general difficulty and response selection, we compared activation related to response time with activation related to numerical processing. We conducted a whole-brain analysis on the child and adult data to identify regions where neural responses correlated with the duration of RTs across the four categories of the matching task. We tested a model that included the duration of subjects’ RTs on each trial of the fMRI matching task as a regressor across all conditions (faces, numbers, words, and shapes). We then tested for positive RT-modulation across the whole brain. The analysis revealed RT-modulated regions in frontal and parietal cortices in adults and children (Figure 6). The general RT-related activations overlapped number-selective activations in frontal cortex (~33.8% of the number-selective activation was inside the RT-related activation). However, general RT-related activation did not overlap number-selective activation in parietal cortex (~0.2% proportion of the number-selective activation was inside the RT-related activation). These results suggest that frontal and anterior cingulate activations from the numerical matching task could be related to general functions that are modulated by overall difficulty and response duration. In contrast, number-selective parietal activations (after subtraction of face-, word-, and shape-related activity) do not exhibit a profile of general difficulty and response selection (see also Emerson & Cantlon, 2012).
Figure 6.
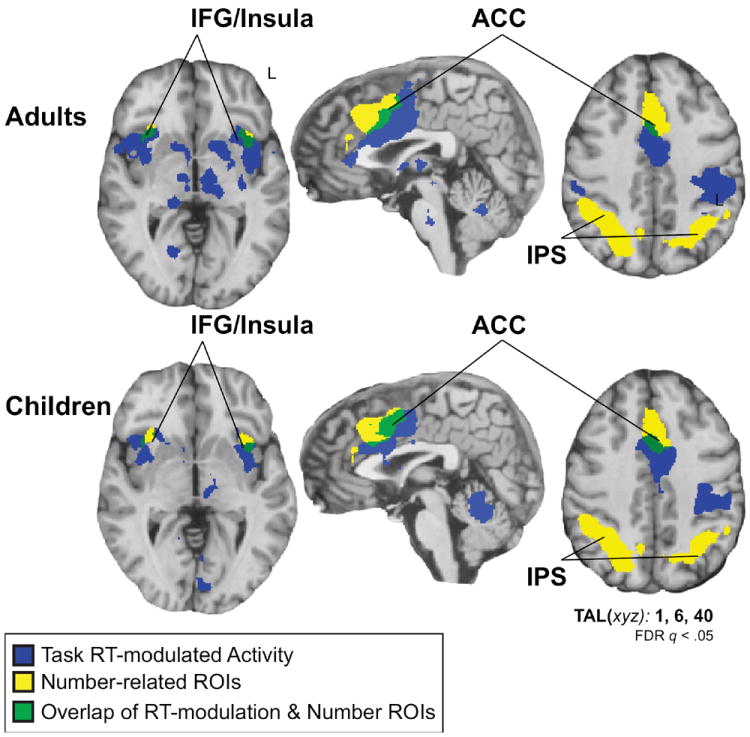
Networks that are modulated by task reaction time, number stimuli, and their overlap in children and adults.
In order to assess the maturity of children’s neural responses, we tested for longitudinal changes in children’s neural activity within the number-selective regions defined by adult activation. Using adult activation as the localizer allowed us to examine the maturation of children’s neural responses relative to the outcome of development (i.e., the adult neural pattern).
Children, as a group, exhibited a number-selective neural response within all of the adult number-selective regions at both Year 1 and Year 2-3. Children’s mean neural response amplitudes (beta values) for each of the matching task categories are shown in Figure 7 for each timepoint. Children showed significantly greater responses during the numerical task compared to the faces, shapes, and words tasks throughout the adult number-selective regions (all p’s < .01). The mean number-related response amplitudes significantly increased from Time 1 to Time 2 in the right IPS (t(16) = 4.02, p < .01) and left IPS (t(16)=4.39, p<.01). The right and left IPS also showed increased responses between Time 1 and Time 2 to the non-numerical categories. However, the increases in number-related responses were significantly greater than the mean neural response changes to the non-numerical categories in the right IPS (t(16) = 2.47, p = .024) and left IPS (t(16)=2.65, p=.017). This result suggests number-specific increases in IPS responses during in early childhood. Non-Parietal number-selective regions displayed a similar increase in number-related response amplitudes from Time 1 to Time 2 in the right IFG/Insula (t(16) = 2.74, p = .015), left IFG/Insula (t(16) = 2.51, p = .023), and the ACC (t(16) = 4.39, p < .01). Like the IPS, the ACC showed number-related increases that were significantly greater than the mean response changes to other categories (t(16)=2.33, p=.032). Longitudinal increases in the IFG/Insula were not greater for the numerical category compared to the non-numerical categories (right IFG/Insula (t(16)=.97, p=.35); left IFG/Insula (t(16)=1.12, p=.28). Children’s initial age did not predict the amount of change in number-related neural activity in any ROI (0.0004 < R2 < .09).
Figure 7.
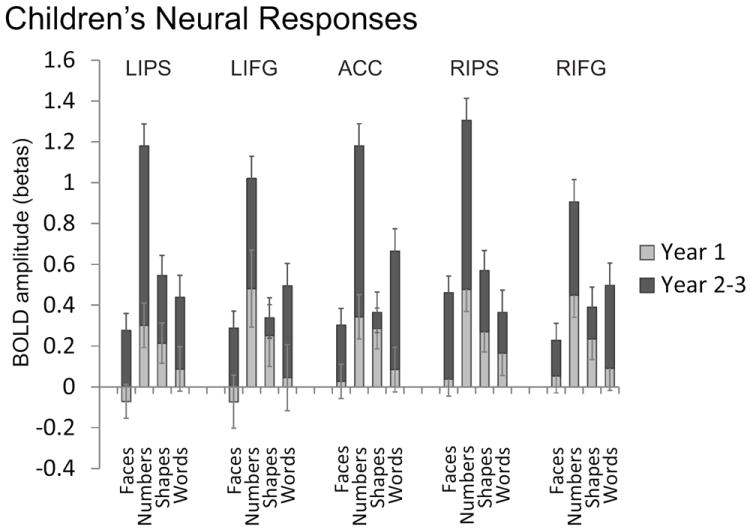
Children’s mean neural response amplitudes (beta values) for each category in Year 1 and Year 2-3 from ROIs independently defined by the Adult data for Number > Other.
To further investigate the longitudinal profile of children’s neural responses, we tested for continuity in the neural responses to numerical stimuli. We tested whether children’s neural responses at Year 1 predicted their neural responses at Year 2-3 for each category in the matching task, and for each brain region that showed a number-related neural response in adults. Only the right IPS showed continuity in the neural response between Year 1 and Year 2-3 and only for the numerical category. The neural response amplitude to number stimuli significantly correlated between Year 1 and Year 2-3 exclusively in the right IPS (r=.67, p<.01). Importantly, no other category showed a similar longitudinal correlation in the right IPS (all p’s > .60 for faces, shapes, and words)(Figure 8). Moreover, no other brain region showed a significant correlation between Year 1 and Year 2-3 in neural responses for the numerical category (all p’s > .13 for ACC, IFG/Insula, and Left IPS). Finally, the right IPS correlation between the number-related neural responses at Year 1 and Year 2-3 remained significant after controlling for age (ρr=.60, p =.01) and the signal-to-noise ratio (ρr=.63, p<.01) in partial correlations. The finding that only the right IPS shows neural continuity for the numerical category during early childhood suggests that this brain region has a uniquely stable role in numerical development.
Figure 8.
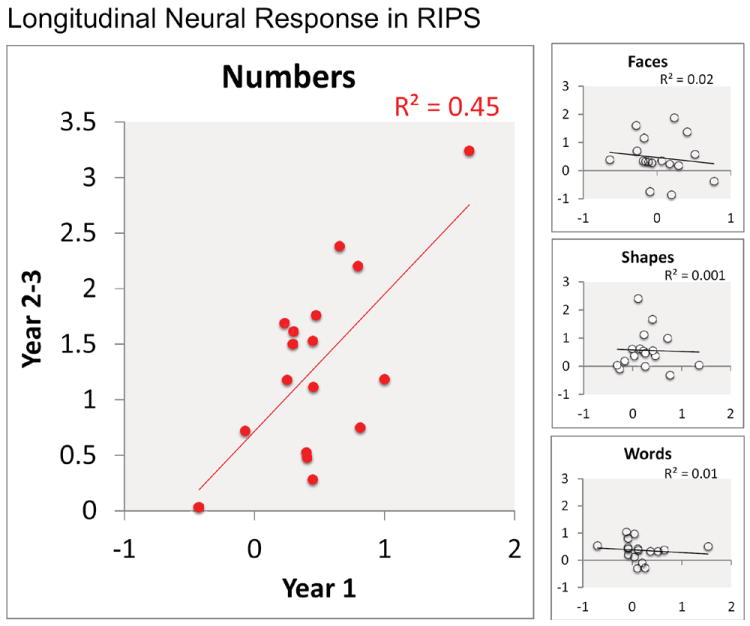
Children showed correlated neural responses to number stimuli between Year 1 and Year 2-3 in the right IPS (left) but not to other categories (right panel; faces, shapes, and words).
As described in the Introduction, number-related neural responses in the left IPS have been hypothesized to emerge more gradually over development than those of the right IPS and to depend on number skill acquisition. We tested for longitudinal performance-related changes in children’s neural responses in the left and right IPS. We performed a set of regression analyses to assess the relationship between children’s neural responses to numbers in the IPS and their numerical acuity as measured by the numerical distance effect. With children’s numerical distance effect at Year 2-3 as the dependent variable, we conducted a forced-entry hierarchical regression that included their initial age and initial behavioral distance effect in the first step, and the change in IPS activity between Year 1 and Year 2-3 in each hemisphere as a second step (Table 2). Because initial age and initial behavioral distance effect were regressed out in the first step, this model effectively tests whether the change in numerical acuity between Year 1 and Year 2-3 is related to the change in the neural responses of the left and right IPS between Year 1 and Year 2-3. We found that this model significantly predicted children’s individual distance related performance in Year 2-3 (R2=.56, F(4,13)=3.79, p=.03). As expected, Initial Age (ρr2=.16, p=.05) and numerical distance effect in Year 1(ρr2=.26, p=.02) made significant contributions to the model. In terms of neural variables, the developmental change in number-related neural activity of left IPS made a significant contribution to the model that was independent of age and initial distance effect (ρr2=.16, p=.05), but developmental changes in right IPS number-related activity did not (ρr2=.05, p=.24). The significant contribution of the left IPS over the right IPS is not likely explained by collinearity between the left and right IPS since the variance inflation factor (VIF) is low (< 2.3).
Table 2.
Analysis of Relation between Change in Numerical Acuity and Change in Neural Activity. Children’s numerical distance effect at Year 2-3 is the dependent variable. Step One included children’s initial age, behavioral distance effect at Year 1. Step Two included the change in IPS activity between Year 1 and Year 2-3 in each hemisphere. Changes in parietal activation contributed significantly to the model, with left IPS surfacing as the prominent predictor.
| β | p-value | Partial | |
|---|---|---|---|
|
| |||
| Step One: | |||
|
|
|||
| Constant | 2.27 | ||
| Age | -0.19 | 0.048 | .211* |
| Distance effect at Time 1 | -0.25 | 0.017 | .328* |
| R2=.371, p=.039 | |||
|
| |||
| Step Two: | |||
|
|
|||
| Constant | 2.86 | ||
| Age | -0.21 | 0.026 | .195* |
| Distance Effect at T1 | -0.23 | 0.01 | .279* |
| Change in LIPS | -0.28 | 0.037 | .167* |
| Change in RIPS | 0.07 | 0.691 | 0.005 |
| ΔR2= .262, p=.038 | |||
In this regression analysis, a large part of the variance in number acuity (~16%) was predicted by age with greater number acuity associated with greater age. This suggests that some of the observed behavioral differences are due to differences in age. As in prior longitudinal studies (Dumontheil & Klingberg, 2012), our analysis controls for age and initial performance levels to estimate the statistically independent contribution of the change in neural activity. The results of this analysis indicate that developmental changes in number-related neural activity in the left IPS play a unique role in the development of children’s numerical acuity compared to the right IPS, above and beyond general age-related maturation.
Next, we supplemented our hypothesis-driven ROI analyses with whole-brain analyses. In one whole-brain analysis we tested for regions that show a correlation in number-related neural responses between Year 1 and Year 2-3 across children. In the second whole-brain analysis we tested for regions that show a correlation between the difference in numerical acuity between timepoints and the difference in number-related neural responses between timepoints, controlling for initial age and initial behavioral distance effect. The results of these analyses are shown in Figure 9a and 9b, respectively. The black outline projected onto each brain image represents our number-related IPS ROIs derived from the adult neural data. The whole-brain analyses confirmed our conclusion from the hypothesis-driven ROI analyses. The right IPS (peak voxel: 26, -62,45) shows a correlation in children’s neural response levels across timepoints (while the left IPS does not) and the left IPS (peak voxel: -38, -62, 45) shows a relationship with developments in children’s numerical acuity (while the right IPS does not). Other regions that emerged from these analyses but for which we had no a priori predictions, and for which we did not impose the statistical precondition of number-selectivity are reported in Table 3.
Figure 9.
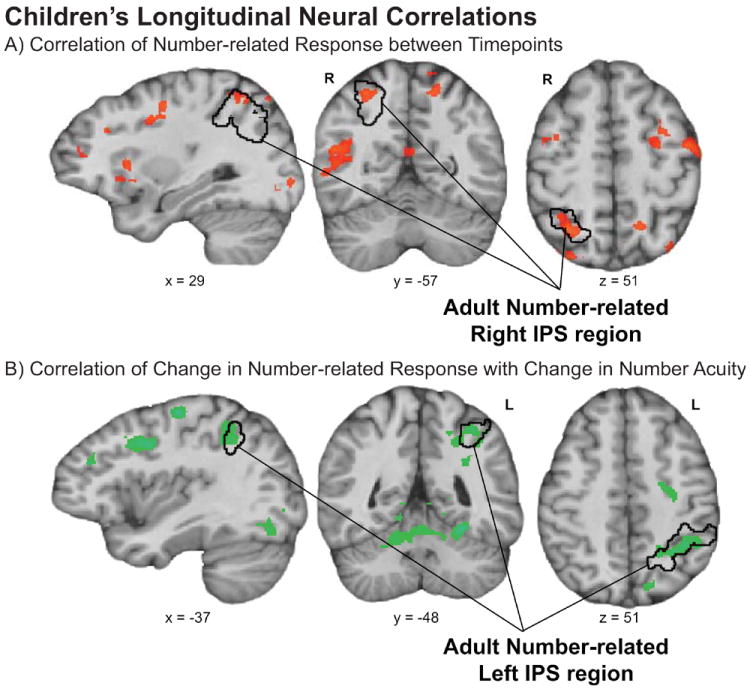
Whole-brain analyses of a) the correlation in number-related neural response amplitude between Year 1 and Year 2-3 and b) a partial regression of change in number acuity predicted by change in number-related neural response amplitude, controlling for initial age and initial number acuity. The black outline represents the number-related IPS ROIs that were derived from adult data and used in ROI analyses of children’s longitudinal data.
Table 3.
Non-IPS Regions that Emerged Whole-Brain Analyses of Longitudinal Data from Children
| Whole-Brain Correlation in Number-related Response Between Year 1 and Year 2-3
| |||||||
|---|---|---|---|---|---|---|---|
| Area of Activation | mm3 | Talairach
|
r | p | |||
| Peak X | Peak Y | Peak Z | |||||
| Right | Middle Temporal Gyrus | 241 | 41 | -59 | 15 | 0.75 | 0.0003 |
| Right | Superior Temporal Gyrus | 117 | 44 | -32 | 9 | 0.70 | 0.0012 |
| Right | Insula | 250 | 35 | 19 | 0 | 0.83 | 0.0000 |
| Right | Insula | 114 | 26 | 16 | 6 | 0.70 | 0.0013 |
| Right | Middle Frontal Gyrus | 166 | 26 | -11 | 45 | 0.80 | 0.0001 |
| Right | Precuneus | 190 | 26 | -56 | 51 | 0.81 | 0.0001 |
| Left | Cingulate Gyrus | 673 | -1 | -38 | 33 | 0.81 | 0.0000 |
| Left | Cingulate Gyrus | 245 | -7 | 34 | 27 | 0.78 | 0.0002 |
| Left | Superior Parietal Lobule | 326 | -16 | -68 | 57 | 0.85 | 0.0000 |
| Left | Middle Frontal Gyrus | 168 | -25 | 49 | 9 | 0.78 | 0.0001 |
| Left | Middle Frontal Gyrus | 189 | -25 | -5 | 48 | 0.72 | 0.0008 |
| Left | Precentral Gyrus | 183 | -37 | -5 | 36 | 0.71 | 0.0010 |
| Left | Precentral Gyrus | 174 | -37 | 7 | 33 | 0.71 | 0.0009 |
| Left | Precentral Gyrus | 496 | -43 | -8 | 51 | 0.80 | 0.0001 |
| Left | Postcentral Gyrus | 138 | -55 | -8 | 18 | 0.72 | 0.0008 |
|
| |||||||
| Whole-Brain Regression of Change in Number Acuity with Change in Neural Response Controlling for Initial Age and Initial Distance Effect
| |||||||
| Area of Activation | mm3 | Talairach
|
r | p | |||
| Peak X | Peak Y | Peak Z | |||||
|
| |||||||
| Right | Insula | 3029 | 23 | 16 | 12 | 0.81 | 0.0001 |
| Left | Middle Occipital Gyrus | 17560 | -7 | -62 | -3 | 0.87 | 0.0000 |
| Left | Middle Occipital Gyrus | 1100 | -25 | -80 | 6 | 0.69 | 0.0016 |
| Left | Precuneus | 1894 | -22 | -68 | 30 | 0.77 | 0.0002 |
| Left | Middle Frontal Gyrus | 1720 | -25 | -8 | 51 | 0.83 | 0.0000 |
| Left | Inferior Parietal Lobule | 915 | -34 | -47 | 45 | 0.68 | 0.0018 |
| Left | Precentral Gyrus | 1267 | -31 | 4 | 33 | 0.78 | 0.0002 |
| Left | Insula | 907 | -28 | 13 | 15 | 0.76 | 0.0003 |
DISCUSSION
Four- to nine-year-old children exhibit number-selective neural responses in the network of brain regions that is engaged during numerical processing in adults, including the right and left IPS. Our data show that developmental increases in the neural responses of the right IPS during numerical processing are largely stable during early childhood: children’s neural response amplitude during basic numerical comparisons at one time point predicts the amplitude of their neural response to those numerical stimuli one to two years later. We showed that this developmental pattern is specific to the numerical category and unique to the right IPS. In contrast, the left IPS does not show the same continuity over development in that its number-related response amplitudes are not correlated over time. Instead, the development of the left IPS shows a dependence on changes in children’s numerical performance. We found that the acuity of children’s numerical discrimination performance is related to changes in the amplitude of the left IPS response.
Our data are consistent with the hypothesis that functional properties of the right IPS are established early in development and conserved over time. In the right IPS, there was a correlation in number-related neural responses over time that was not observed for any other category or brain region. The longitudinal continuity in children’s right IPS responses during numerical processing suggests a fundamental role for the IPS in numerical cognition. As described in the Introduction, cross-sectional neuroimaging studies with human infants suggest the possibility of neural continuity in the approximate numerical processes of the right IPS extending as far back as infancy (Libertus et al, 2008; Izard et al. 2008; Hyde et al 2010). Moreover, research on the neural basis of numerical processing in non-human animals has revealed evidence of an evolutionarily primitive origin for approximate numerical processing in parietal cortex (see Cantlon, 2012 for review). Like human infants, children, and adults, non-human primates can approximate numerical values and show evidence of number-selective neural responses in the IPS (Neider and Miller 2004). Monkey IPS neurons exhibit distance-dependent neural firing rates to non-symbolic numerical stimuli such as arrays of dots or sequences of tones. Those data suggest that the IPS has a primitive role in numerical processing. Consistent with this argument, individuals with genetically determined mathematics impairments, such as Turner’s syndrome, exhibit selective structural and functional abnormalities in the IPS (Molko et al., 2003). Our finding that children show developmental continuity in the right IPS activity that is related to basic numerical processing is consistent with arguments for an evolutionarily and ontogenetically fundamental basis for numerical processing in the human IPS. Developmental neuroimaging data from humans are beginning to converge on the conclusion that fundamental numerical processes in the IPS are right lateralized (Ansari, 2008; Cantlon et al., 2006; Piazza et al., 2007; Price et al., 2007).
In contrast to the neural continuity observed in the right IPS, we observed a performance-dependent profile of developmental change in the number-related neural responses of the left IPS. Children’s neural responses in the left IPS during basic numerical judgments were not correlated over testing sessions. Number-related neural responses in the left IPS previously had been shown to exhibit a different profile in adults compared to children. For example, adults show greater activation of the left IPS during numerical tasks than do children, resulting in a more bilateral activation pattern for adults compared to children (Cantlon et al., 2006). Left parietal activation also shows increases with age and numerical skill in children (Ansari & Dhital, 2006; Cantlon & Li, 2013; Rivera et al., 2005; Rosenberg-Lee, Barth, & Menon, 2011). Finally, adults exhibit neural responses to finer numerical discriminations in the left IPS compared to the right IPS (Piazza et al., 2007). Together, the existing data suggest that the left IPS plays a unique role in the acquisition of precise, symbolic numbers. Children show increasing numerical acuity over development and they gradually become fluent with numerical symbols during the first several years of childhood (Halberda & Feigenson, 2008). The precision of the approximate number representation nearly doubles between 3 and 6 years of age and nearly doubles again between 6 years of age and adulthood. Our longitudinal data show that the neural response amplitude in the left IPS is uniquely associated with developments in numerical acuity during early childhood. The relationship between numerical acuity and left IPS activity could be driven by a sharpening of the approximate representation of number, a sharpening of the symbolic representation of number, a more precise mapping between approximate and symbolic numerical representations, or a combination of these factors. The left hemisphere bias of the numerical acuity effect suggests that symbolic processing could be an important catalyst in the effect. The relationship between numerical acuity and left IPS activity could be driven by interactions with the verbal code for number within the language-dominant left hemisphere (Cohen Kadosh et al., 2007; Dehaene & Cohen, 1995) or by a unique role for the left IPS in the semantic mapping of numerical symbols over development (Lyons & Ansari, 2009; Piazza et al., 2007).
Our data indicate that developmental changes in left IPS activity are specifically related to number representation as opposed to more general task functions. Some regions of parietal cortex such as the angular gyrus and supramarginal gyrus have been shown to respond selectively during cross-modal processing, such as during rhyming tasks with visual inputs (eg. Booth, Burman, Meyer, Gitelman, Parrish, & Mesulam, 2002). If it were the case that the observed number-related left IPS activity was related more generally to the cross-format nature of the numerical task, we would expect that longitudinal changes in overall accuracy on the number task would explain the variation in the neural data as well as the longitudinal changes in the numerical acuity. To test this hypothesis, we modeled the longitudinal changes in overall number task accuracy in the same manner as we modeled the numerical distance effect in Results. When controlling for age, we found that overall accuracy on the number task was not significantly predicted by children’s longitudinal changes in left or right IPS number-related activity (F(3,13)= 1.72, p =.21). Instead, changes in left IPS activity over development were related to the numerical distance effect, as shown in Results. This result suggests that the observed developmental changes in the left IPS are related to number representation and not the general characteristics of the number task.
Among the regions we examined (IPS, ACC, and IFG/Insula), the right and left IPS showed the clearest relationship with children’s numerical development. In addition to the IPS, we observed number-related activity in the anterior cingulate (ACC) and the prefrontal cortex (IFG/Insula). Neither of those regions showed a profile of longitudinal number-related activity that was similar to either the right or left IPS. Unlike the IPS, the IFG/Insula did not show number-specific developmental increases in activity over time but instead showed similar developmental increases across categories. Moreover, the IFG/Insula regions were modulated by trial-to-trial fluctuations in response time across categories whereas the IPS regions were not. Thus, the IFG/Insula did not show the same degree of number-specific longitudinal change as the IPS. The ACC profile was also distinct from the profile of the IPS. Unlike the right IPS, number-related neural activity in the ACC was not correlated between time 1 and time 2 in children. And, unlike the left IPS, activity in the ACC did not show a relationship to developmental changes in numerical acuity. A hierarchical regression analysis with the numerical distance effect at time 2 as the dependent variable, controlling for initial age and initial numerical distance effect, with change in number-related ACC activity as the predictor revealed no independent contribution of ACC activity (ρr2= .02, p= .49). This result contrasts with our finding from a parallel analysis with IPS activity as the predictor, which yielded a significant relationship between changes in left IPS activity and the numerical distance effect. Thus, the ACC does not show a pattern of number-related continuity or number-related change in our study. Instead we observed that neural responses in regions of the ACC were related to general fluctuations response time across the face, number, shape, and word conditions in children and adults (Figure 6). The IFG/Insula and ACC thus have a less specialized role in children’s numerical development compared to the IPS.
The functions of the ACC and IFG/Insula in numerical processing are not clear. ACC and IFG/Insula activity has been reported previously in studies of numerical cognition (eg., Emerson & Cantlon, 2012; Piazza et al., 2007). General functions that have been attributed to the ACC and IFG/Insula include cognitive control, rule representation, response conflict monitoring and error detection, and attention (Medford & Critchley, 2010; Shenhav et al, 2013; Gasquoine, 2013; Weston, 2012). There is no evidence in our data that general functions are asymmetrically recruited during numerical processing compared to word, face, or shape processing. The numerical condition was not the slowest or most difficult condition in the matching task. Moreover, adults showed greater IFG/Insula and ACC activity during numerical processing compared to the other conditions despite being at ceiling performance on all tasks. In short, our data point to functional differences between the ACC and IFG/Insula versus the IPS over development but the precise nature of those differences remains undetermined.
Evidence that the IPS plays a specialized role in basic numerical processing has implications for mathematics education and math-related developmental disorders. Behavioral studies have shown that preschool children with deficient approximate number skills are at heightened risk for mathematics learning deficits (MLD) when they enter school (Mazzocco, Feigenson, & Halberda, 2011b). Our data contribute to accumulating evidence that a possible neural marker for this relationship could be the strength of the number-related neural response in the IPS during early childhood. An important endeavor for future research is to investigate the consequences of longitudinal neural continuity versus change for children’s developing number competence. For example, if children’s number-related right IPS responses are stable over early childhood, then the strength of their early childhood right IPS response could make early predictions of their future numerical abilities. A low number-related right IPS amplitude in early childhood could signal impending mathematics impairment. This suggestion assumes that IPS responses are causally related to numerical development. Recent studies have linked impaired neural responses in the right parietal cortex to developmental dyscalculia (Price et al., 2007) and mathematics disorders with a genetic origin (Molko et al., 2003). Those data provide suggestive evidence of a causal relation between IPS functions and numerical development. Longitudinal data beginning in early childhood are needed to provide more conclusive evidence about the origins of the disorders.
In summary, our data show distinct longitudinal patterns of neural development in the number-related responses of the right versus left IPS. The right IPS exhibits a profile of continuity over development whereas the left IPS exhibits a pattern of performance-dependent developmental change. As children develop precise representations of numerical values, the strength of their left IPS response during basic number comparison increases. In contrast, the right IPS exhibits developmentally stable increases in basic number-related neural activity that are predictable from early childhood. This developmental pattern is consistent with the conclusion that the right IPS plays a developmentally conservative role in basic numerical processing while the left IPS is more plastic and can be influenced by the culturally-driven acquisition of precise numerical representations.
Research Highlights.
Children show number-selective responses across development in the intraparietal sulcus (IPS).
Longitudinal increases in IPS responses are number-selective.
The right IPS shows longitudinal continuity in its responses to numbers.
Longitudinal changes in the left IPS are related to the acuity of children’s number skill.
Acknowledgments
The authors thank the CAOS Lab, especially Vy Vo and Courtney Lussier. Funding was provided by NIH R01 HD064636 to JFC, the James S. McDonnell Foundation, and Alfred P. Sloan Foundation.
References
- Andres M, Seron X, Olivier E. Hemispheric lateralization of number comparison. Cognitive Brain Research. 2005;25(1):283–90. doi: 10.1016/j.cogbrainres.2005.06.002. [DOI] [PubMed] [Google Scholar]
- Ansari D. Effects of development and enculturation on number representation in the brain. Nature Reviews Neuroscience. 2008;9(4):278–91. doi: 10.1038/nrn2334. [DOI] [PubMed] [Google Scholar]
- Ansari D, Dhital B. Age-related changes in the activation of the intraparietal sulcus during nonsymbolic magnitude processing : An event-related functional magnetic resonance imaging study. Journal of Cognitive Neuroscience. 2006;18(11):1820–1828. doi: 10.1162/jocn.2006.18.11.1820. [DOI] [PubMed] [Google Scholar]
- Booth JR, Burman DD, Meyer JR, Gitelman DR, Parrish TB, Mesulam M. Functional anatomy of intra-and cross-modal lexical tasks. Neuroimage. 2002;16(1):7–22. doi: 10.1006/nimg.2002.1081. [DOI] [PubMed] [Google Scholar]
- Brannon EM, Van de Walle Ga. The development of ordinal numerical competence in young children. Cognitive Psychology. 2001;43(1):53–81. doi: 10.1006/cogp.2001.0756. [DOI] [PubMed] [Google Scholar]
- Bugden S, Price GR, McLean DA, Ansari D. The role of the left intraparietal sulcus in the relationship between symbolic number processing and children’s arithmetic competence. Developmental Cognitive Neuroscience. 2012;2(4):448–57. doi: 10.1016/j.dcn.2012.04.001. [DOI] [PMC free article] [PubMed] [Google Scholar]
- Cantlon JF. Math, monkeys, and the developing brain. Proceedings of the National Academy of Sciences of the United States of America. 2012;109(Suppl):10725–32. doi: 10.1073/pnas.1201893109. [DOI] [PMC free article] [PubMed] [Google Scholar]
- Cantlon JF, Brannon EM, Carter EJ, Pelphrey Ka. Functional imaging of numerical processing in adults and 4-y-old children. PLoS Biology. 2006;4(5):e125. doi: 10.1371/journal.pbio.0040125. [DOI] [PMC free article] [PubMed] [Google Scholar]
- Cantlon JF, Li R. Neural Activity during natural viewing of Sesame Street statistically predicts test scores in early childhood. PLoS Biology. 2013;11(1):e1001462. doi: 10.1371/journal.pbio.1001462. [DOI] [PMC free article] [PubMed] [Google Scholar]
- Cantlon JF, Libertus ME, Pinel P, Dehaene S, Brannon EM, Pelphrey KA. The neural development of an abstract concept of number. Journal of Cognitive Neuroscience. 2008;21(11):2217–29. doi: 10.1162/jocn.2008.21159. [DOI] [PMC free article] [PubMed] [Google Scholar]
- Carey S. The Origin of Concepts. Oxford University Press; New York: 2009. [Google Scholar]
- Cohen Kadosh R, Cohen Kadosh K, Kaas A, Henik A, Goebel R. Notation-dependent and -independent representations of numbers in the parietal lobes. Neuron. 2007;53(2):307–14. doi: 10.1016/j.neuron.2006.12.025. [DOI] [PubMed] [Google Scholar]
- Cordes S, Brannon EM. Quantitative competencies in infancy. Developmental Science. 2008;11(6):803–8. doi: 10.1111/j.1467-7687.2008.00770.x. [DOI] [PubMed] [Google Scholar]
- Dehaene S, Cohen L. Towards an anatomical and functional model of number processing. Math Cognition. 1995;1:83–120. [Google Scholar]
- Dumontheil I, Klingberg T. Brain activity during a visuospatial working memory task predicts arithmetical performance 2 years later. Cerebral Cortex. 2012;22(5):1078–1085. doi: 10.1093/cercor/bhr175. [DOI] [PubMed] [Google Scholar]
- Eger E, Sterzer P, Russ MO, Giraud A-L, Kleinschmidt A. A supramodal number representation in human intraparietal cortex. Neuron. 2003;37(4):719–25. doi: 10.1016/s0896-6273(03)00036-9. [DOI] [PubMed] [Google Scholar]
- Emerson RW, Cantlon JF. Early math achievement and functional connectivity in the frontoparietal network. Developmental Cognitive Neuroscience. 2012;2(S1):S139–S151. doi: 10.1016/j.dcn.2011.11.003. [DOI] [PMC free article] [PubMed] [Google Scholar]
- Gasquoine PG. Localization of function in anterior cingulate cortex: from psychosurgery to functional neuroimaging. Neuroscience and Biobehavioral Reviews. 2013;37(3):340–8. doi: 10.1016/j.neubiorev.2013.01.002. [DOI] [PubMed] [Google Scholar]
- Geary DC. Early foundations for mathematics learning and their relations to learning Disabilities. Current Directions in Psychological Science. 2013;22(1):23–27. doi: 10.1177/0963721412469398. [DOI] [PMC free article] [PubMed] [Google Scholar]
- Gelman R. The child’s understanding of number. Harvard University Press; 1986. [Google Scholar]
- Gilmore CK, McCarthy SE, Spelke ES. Symbolic arithmetic knowledge without instruction. Nature. 2007;447(7144):589–91. doi: 10.1038/nature05850. [DOI] [PubMed] [Google Scholar]
- Göbel SM, Johansen-Berg H, Behrens T, Rushworth MFS. Response-selection-related parietal activation during number comparison. Journal of Cognitive Neuroscience. 2004;16(9):1536–51. doi: 10.1162/0898929042568442. [DOI] [PubMed] [Google Scholar]
- Goebel R, Esposito F, Formisano E. Analysis of functional image analysis contest (FIAC) data with Brainvoyager QX: From single-subject to cortically aligned group general linear model analysis and self-organizing group independent component analysis. Human Brain Mapping. 2006;27:392–401. doi: 10.1002/hbm.20249. [DOI] [PMC free article] [PubMed] [Google Scholar]
- Halberda J, Feigenson L. Developmental change in the acuity of the “Number Sense”: The approximate number system in 3-, 4-, 5-, and 6-year-olds and adults. Developmental Psychology. 2008;44(5):1457–65. doi: 10.1037/a0012682. [DOI] [PubMed] [Google Scholar]
- Halberda J, Mazzocco MMM, Feigenson L. Individual differences in non-verbal number acuity correlate with maths achievement. Nature. 2008;455(7213):665–8. doi: 10.1038/nature07246. [DOI] [PubMed] [Google Scholar]
- Hyde DC, Boas Da, Blair C, Carey S. Near-infrared spectroscopy shows right parietal specialization for number in pre-verbal infants. NeuroImage. 2010;53(2):647–52. doi: 10.1016/j.neuroimage.2010.06.030. [DOI] [PMC free article] [PubMed] [Google Scholar]
- Izard V, Dehaene-Lambertz G, Dehaene S. Distinct cerebral pathways for object identity and number in human infants. PLoS Biology. 2008;6(2):e11. doi: 10.1371/journal.pbio.0060011. [DOI] [PMC free article] [PubMed] [Google Scholar]
- Jordan KE, Brannon EM. The multisensory representation of number in infancy. Proceedings of the National Academy of Sciences of the United States of America. 2006;103(9):3486–9. doi: 10.1073/pnas.0508107103. [DOI] [PMC free article] [PubMed] [Google Scholar]
- Libertus ME, Brannon EM. Behavioral and neural basis of number sense in infancy. Current Directions in Psychological Science. 2009;18(6):346–351. doi: 10.1111/j.1467-8721.2009.01665.x. [DOI] [PMC free article] [PubMed] [Google Scholar]
- Libertus ME, Pruitt LB, Woldorff MG, Brannon EM. Induced alpha-band oscillations reflect ratio-dependent number discrimination in the infant brain. Journal of Cognitive Neuroscience. 2009;21(12):2398–406. doi: 10.1162/jocn.2008.21162. [DOI] [PubMed] [Google Scholar]
- Lipton JS, Spelke ES. Preschool children ’ s mapping of number words to nonsymbolic numerosities. Child Development. 2005;76(5):978–988. doi: 10.1111/j.1467-8624.2005.00891.x. [DOI] [PubMed] [Google Scholar]
- Lyons IM, Ansari D. The cerebral basis of mapping nonsymbolic numerical quantities onto abstract symbols: an fMRI training study. Journal of Cognitive Neuroscience. 2009;21(9):1720–35. doi: 10.1162/jocn.2009.21124. [DOI] [PubMed] [Google Scholar]
- Mazzocco MMM, Feigenson L, Halberda J. Impaired acuity of the approximate number system underlies mathematical learning disability (dyscalculia) Child Development. 2011;82(4):1224–37. doi: 10.1111/j.1467-8624.2011.01608.x. [DOI] [PMC free article] [PubMed] [Google Scholar]
- Medford N, Critchley HD. Conjoint activity of anterior insular and anterior cingulate cortex: awareness and response. Brain Structure & Function. 2010;214(5-6):535–49. doi: 10.1007/s00429-010-0265-x. [DOI] [PMC free article] [PubMed] [Google Scholar]
- Molko N, Cachia A, Rivière D, Mangin JF, Bruandet M, Le Bihan D, Cohen L, et al. Functional and structural alterations of the intraparietal sulcus in a developmental dyscalculia of genetic origin. Neuron. 2003;40(4):847–58. doi: 10.1016/s0896-6273(03)00670-6. [DOI] [PubMed] [Google Scholar]
- Nieder A, Dehaene S. Representation of number in the brain. Annual Review of Neuroscience. 2009;32:185–208. doi: 10.1146/annurev.neuro.051508.135550. [DOI] [PubMed] [Google Scholar]
- Nieder A, Miller EK. A parieto-frontal network for visual numerical information in the monkey. Proceedings of the National Academy of Sciences of the United States of America. 2004;101(19):7457–62. doi: 10.1073/pnas.0402239101. [DOI] [PMC free article] [PubMed] [Google Scholar]
- Piazza M, Pinel P, Le Bihan D, Dehaene S, Cedex O. Tuning curves for approximate numerosity in the human intraparietal sulcus. Neuron. 2004;44:547–555. doi: 10.1016/j.neuron.2004.10.014. [DOI] [PubMed] [Google Scholar]
- Piazza M, Mechelli A, Price CJ, Butterworth B. Exact and approximate judgments of visual and auditory numerosity: an fMRI study. Brain Research. 2006;1106(1):177–88. doi: 10.1016/j.brainres.2006.05.104. [DOI] [PubMed] [Google Scholar]
- Piazza M, Pinel P, Le Bihan D, Dehaene S. A magnitude code common to numerosities and number symbols in human intraparietal cortex. Neuron. 2007;53(2):293–305. doi: 10.1016/j.neuron.2006.11.022. [DOI] [PubMed] [Google Scholar]
- Pinel P, Dehaene S, Rivière D, LeBihan D. Modulation of parietal activation by semantic distance in a number comparison task. NeuroImage. 2001;14(5):1013–26. doi: 10.1006/nimg.2001.0913. [DOI] [PubMed] [Google Scholar]
- Pinel P, Dehaene S. Beyond hemispheric dominance: brain regions underlying the joint lateralization of language and arithmetic to the left hemisphere. Journal of Cognitive Neuroscience. 2010;22(1):48–66. doi: 10.1162/jocn.2009.21184. [DOI] [PubMed] [Google Scholar]
- Price GR, Holloway I, Räsänen P, Vesterinen M, Ansari D. Impaired parietal magnitude processing in developmental dyscalculia. Current Biology. 2007;17(24):R1042–3. doi: 10.1016/j.cub.2007.10.013. [DOI] [PubMed] [Google Scholar]
- Rivera SM, Reiss aL, Eckert Ma, Menon V. Developmental changes in mental arithmetic: evidence for increased functional specialization in the left inferior parietal cortex. Cerebral Cortex. 2005;15(11):1779–90. doi: 10.1093/cercor/bhi055. [DOI] [PubMed] [Google Scholar]
- Shenhav A, Botvinick MM, Cohen JD. The expected value of control: an integrative theory of anterior cingulate cortex function. Neuron. 2013;79(2):217–40. doi: 10.1016/j.neuron.2013.07.007. [DOI] [PMC free article] [PubMed] [Google Scholar]
- Rosenberg-Lee M, Barth M, Menon V. What difference does a year of schooling make?: Maturation of brain response and connectivity between 2nd and 3rd grades during arithmetic problem solving. NeuroImage. 2011;57(3):796–808. doi: 10.1016/j.neuroimage.2011.05.013. [DOI] [PMC free article] [PubMed] [Google Scholar]
- Talairach J, Tournoux P. A Co-Planar Stereotactic Atlas of the Human Brain. Thieme Medical; New York: 1988. [Google Scholar]
- Weston CSE. Another major function of the anterior cingulate cortex: the representation of requirements. Neuroscience and Biobehavioral Reviews. 2012;36(1):90–110. doi: 10.1016/j.neubiorev.2011.04.014. [DOI] [PubMed] [Google Scholar]