Abstract
Collaborative information systems (CIS) enable users to coordinate efficiently over shared tasks. T hey are often deployed in complex dynamic systems that provide users with broad access privileges, but also leave the system vulnerable to various attacks. Techniques to detect threats originating from beyond the system are relatively mature, but methods to detect insider threats are still evolving. A promising class of insider threat detection models for CIS focus on the communities that manifest between users based on the usage of common subjects in the system. However, current methods detect only when a user’s aggregate behavior is intruding, not when specific actions have deviated from expectation. In this paper, we introduce a method called specialized network anomaly detection (SNAD) to detect such events. SNAD assembles the community of users that access a particular subject and assesses if similarities of the community with and without a certain user are sufficiently different. We present a theoretical basis and perform an extensive empirical evaluation with the access logs of two distinct environments: those of a large electronic health record system (6,015 users, 130,457 patients and 1,327,500 accesses) and the editing logs of Wikipedia (2,388,955 revisors, 55,200 articles and 6,482,780 revisions). We compare SNAD with several competing methods and demonstrate it is significantly more effective: on average it achieves 20–30% greater area under an ROC curve.
I. Introduction
The popularity of collaborative information systems (CIS) has exploded over the past decade, such that they are now critical in a wide-range of domains. For instance, CIS are utilized in popular Web 2.0 environments, such as wikis, dynamic bookmarking, social networking, and groupware [9]. At the same time, CIS have become central to environments that handle personal or strategic knowledge, such as healthcare operations [10] and intelligence-related activities [26].
In essence, CIS provide for several major benefits in comparison to their predecessors. First, they can increase the efficiency of completing a task [7]. Second, they can improve the quality of the work produced in the system [11]. These benefits are realized because CIS facilitate flexible participation and coordination between disparate users over common tasks.
Unfortunately, the flexible nature that provides CIS with enhanced service capabilities leaves it vulnerable to various information security threats. This is due, in part, to the fact that the environments in which CIS are deployed are inherently dynamic and complex. They often consist of a large number of users, permissions or functions, and ad hoc relationships between users and data elements, all of which fluctuate over time. The consequence of such complexity is that CIS are subject to misuse and abuse, which can ultimately corrupt or expose sensitive information [5]. This is particularly a concern in CIS that manage sensitive information, such as electronic health records (EHRs), where misuse of the system can lead to the exploitation of private medical information [15].
The insider threat has long been recognized as a challenging problem in information systems security [19], [4]. With respect to CIS, the past decade has produced various models to prevent the threat, such as the application of formal access control frameworks (e.g., [2], [23], [27]) and role mining (e.g., [17], [25], [28]) to appropriately tune permission assignments. Access control primarily relies on protection by appropriately defining roles and permissions of users to prevent illicit accesses from unauthorized users. Notably, certain access control frameworks address team [8] and context scenarios [2], [12]. However, in a CIS, users’ roles and permissions are dynamic. As a result, it is difficult to differentiate between “normal” and “abnormal” accesses based on roles and permissions alone.
Acknowledging that access control is necessary, but insufficient, to guarantee protection, various approaches based on anomaly detection methods have been proposed as supplements. In the context of collaborative environments, certain data structures and theories rooted on behavior modeling, such as graph-based decompositions [6], [16] and community detection techniques [3], [22], [20] have shown promise.
However, the existing set of approaches are limited in that they are designed to detect if a user is behaving in an anomalous manner in general. They are not oriented to determine if a user’s particular action is anomalous and thus are more useful when a user’s account has been compromised or the user is performing a significant number of actions beyond their normal routine. Yet, such techniques are not adept at determining if an authenticated user is committing more subtle illicit actions, such as the access (or amendment) of a single subject in the CIS.
In this paper, we focus on the detection of specific anomalous accesses. To address the variable nature of users, we leverage dynamic social network analysis. Our approach builds a model for each subject that is accessed (e.g., patient’s medical record) in the form of a network of users (i.e., the set of authenticated healthcare workers). We hypothesize that if a user is a threat, the similarity between this user to the network will be lower than that among the remaining users. Under this hypothesis, our model assesses if the similarity of the network with and without the user are sufficiently different. We defer the detailed presentation of how similarity is defined until Section II-A3.
Beyond developing the model, we perform an empirical investigation with the access logs of two distinct CIS. The first consists of the access logs from a large restricted-access EHR system. The second consists of the editing logs from a publicly-accessible online wiki, Wikipedia. In the context of these real domains, we simulate intruding behavior in several manners that are indicative of various known illicit actions. Our results illustrate that when an access network is intruded upon, the similarity of the network is sufficiently lower to detect the intrusion. Additionally, and perhaps more importantly, we demonstrate that relatively simple data mining techniques are more effective than complex network decomposition methods for this specific detection problem.
II. Intruding Access Detection Model
This section introduces the detection model, which we call specialized network anomaly detection (SNAD). The approach is dubbed “specialized” because it focuses on a local view of the information system, conditioned on specific subjects. We begin with a high-level overview of SNAD and then delve into the details of the particular methods it incorporates.
SNAD functions under the premise that normal and abnormal accesses will have sufficiently different influence on the similarity of the users in an access network. As depicted in Figure 1, SNAD can be represented as two general components: 1) Similarity Measurement (SNAD-SM), which feeds into 2) Anomaly Evaluation (SNAD-AE).
Fig. 1.
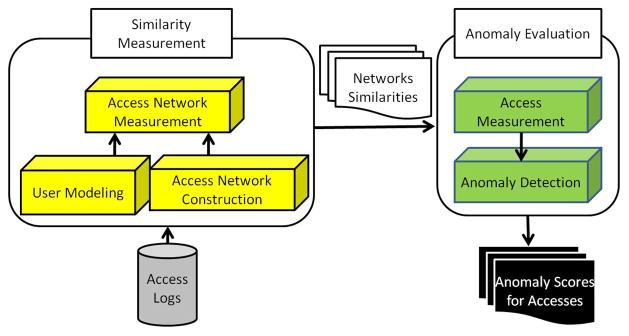
The specialized network anomaly detection (SNAD) framework.
The SNAD-SM component extracts networks of users from access logs. More specifically, this component constructs a local access network for each subject. It then calculates the similarity of the users’ access patterns in the network. Rather than focus on the individual features of the users or the subjects, SNAD aims for a more general representation to model the social behavior in the system by constructing and measuring the similarity of users’ access networks.
The SNAD-AE component evaluates each access by comparing the similarity of an access network to its subnetwork. More specifically, SNAD-AE measures the similarity of the users that access a particular subject. This network is then compared to the similarity of a subnetwork that suppresses one of the network’s users. If the similarity between the network and subnetwork are sufficiently different, then SNAD claims the suppressed user’s access was an anomaly.
A. SNAD Similarity Measurement
1) Access Network Construction
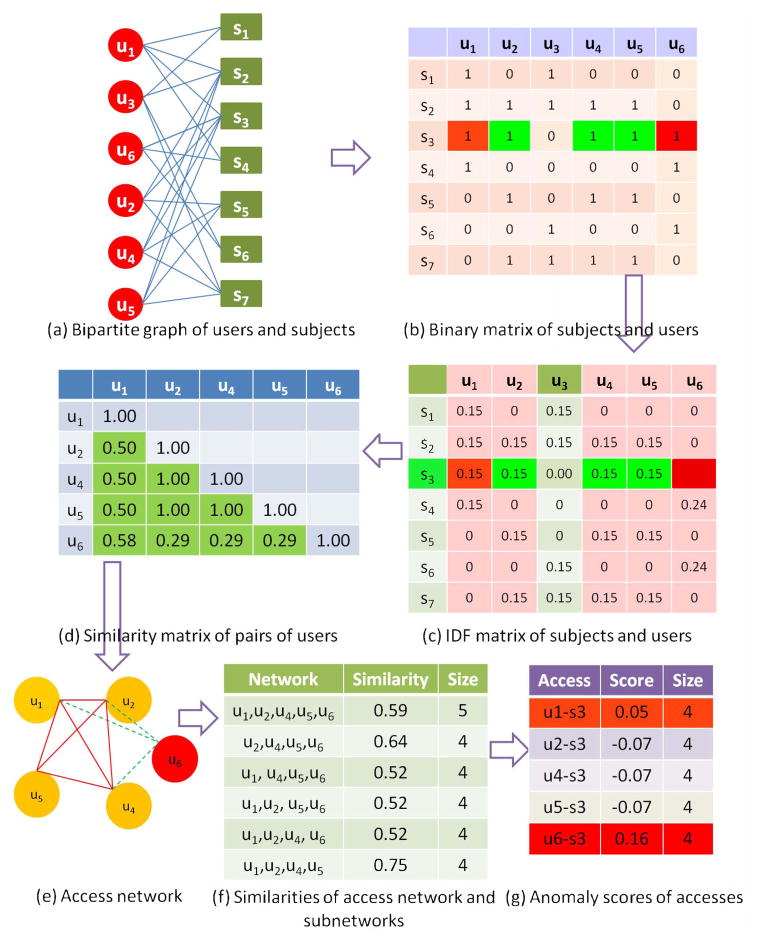
The SNAD-SM component transforms the CIS access logs into networks. The transformation begins by constructing a bipartite graph of the users and subjects that interact during a particular time period. Figure 2(a) depicts an example with six users and seven subjects modeled as vertices. Note, an edge represents a user accessed the subject’s record.
Fig. 2.
An illustrative example for the SNAD model.
Based on the graph, we define a local access network as follows. Let S = {s1, … , sm} and U = {u1, … , un} be the set of subjects and users, respectively. We define USi as the set of users that accessed si in a certain time period, such as one day. And, we define N etsi is a complete graph of Usi, where the weight between a user pair is their similarity (defined below). For simplicity, we use cardinality |·| to represent the number of elements in a set. For instance, in Figure 2(a), Us3 = {u1, u2, u4, u5, u6} and N ets3, depicted in Figure 2(e), is a complete graph.
2) User Modeling
Initially, we represent the subject-user bipartite graph as a binary matrix SU, as depicted in Figure 2(b). SU(i, j) = 1, if user uj accesses subject si, and 0 otherwise. For reference, we represent ui as the column vector of subject accesses, denoted Ui.
Prior research in social network analysis (e.g. [1]) suggests, it is important to represent the affinity that a user has toward a particular subject when assessing the similarity of users. There are several aspects of user’s relationships to subjects that could be leveraged for similarity. First, users may access a subject multiple times during their interaction with a CIS. However, users have different system access rates, and considering the frequency of their access may skew the similarity analysis. Thus, we focus more on the number of subjects a user accessed. Specifically, we utilize the inverse document frequency (IDF) model, a statistical measure popularized by information retrieval systems shown to be effective for weighting the affinity of individuals to subjects in friendship networks [1]. In effect, IDF models the affinity of a user to a subject relative to all subjects in the system. As such, the IDF transformation is defined as:
| (1) |
where S = [1, 1, … , 1] and has the same number of dimensions as Ui. Figure 2(c) provides an example of this transformation.
Relationships, or similarity, between pairs of users can be mined from their access vectors. Cosine similarity [18] is a particular measure that has successfully been applied in various domains to measure the similarity of vectors. We compute the similarity of users ui, uj via the cosine of their IDF-transformed vectors:
| (2) |
Figure 2(d) is an example of user pair similarities.
3) Access Network Measurement
We hypothesize that if an insider wanders into a network, its similarity will decrease. However, to investigate this hypothesis we need to develop an appropriate similarity measure for an access network.
Different subjects have distinct local access networks. In order to compare similarities of these networks from a global perspective, we define the similarity of an access network as the average similarity of all user pairs:
| (3) |
where |Usk| is the number of users in N etsk. When this value is high, the users are close to each other, such that have a strong collaborative relationship with respect to subject sk.
SNAD-SM provides a measure of similarity for an access network. However, to leverage such measures for anomaly detection, we need a formal approach to determine when a particular access is anomalous in the access network.
4) Access Measurement
SNAD-AE evaluates each user’s access in a network by calculating how the similarity of the network changes after the suppression of the user. SNAD-AE assumes that intruding accesses will lower the similarity of a network at a greater rate than a typical access.
To evaluate the access uj → si, we compare the similarity of the network with and without the user:
| (4) |
where N etsij is the network with user uj suppressed. As an example, N ets3 in Figure 2(e) consists of five users who accessed s3. In N ets3, the expectation is that if uj → s3 is an intrusion, Score(uj → s3) will be larger than the subnetwork sans a typical user. Similarities of access network and its subnetworks are depicted in Figure 2(f).
5) Anomaly Detection
In Figure 2(g), SNAD-AE calculated the scores of all accesses involved with subject s3. These scores were calculated based on access network N ets3 which consists of five users u1, u2, u4, u5 and u6. SNAD-AE computes a score for each access using Equation 4.
The larger the score, the greater the probability the access is an intrusion. For the five accesses associated with network N ets3, u1 and u6 have scores larger than u2, u4 and u5; 0.05 and 0.16, respectively. If we rank the scores and claim the highest as an anomaly, u6 → s3 will be implicated by SNAD. Turning outåttention back to the SU matrix, it can be seen that u2, u4, and u5 access common subjects, whereas u6 only has s3 in common. Except for s2, s3 and s6, u1 has no common subjects with u2, u4 and u5.
B. Spectral Anomaly Detection Model
Though SNAD may appear to be a simplistic model, we find it is more appropriate for access-level insider threat detection in CIS than more sophisticated competitors. As evidence, we compare SNAD to a well-regarded competitor, spectral anomaly detection [21]. This model calculates the distance of each user to the principal components of the SU matrix:
| (5) |
where and PCki is the distance of ui to kth principal component. Next, the average distance of an access network is defined as:
| (6) |
where sizesi is the size of access network N etsi.
Then, similar to SNAD, the spectral model computes an access score for each user by measuring the change of distance in the access network after suppressing the user. As an example, access u6 → u3 is scored by the spectral model as: Score(u6 → s3) = DIS(N ets3,6) − DIS(N ets3).
We apply the spectral anomaly detection model on both the pre- and post-IDF transformed SU matrix and refer to these models as Spectral-Binary and Spectral-IDF, respectively.
III. EXPERIMENTS AND RESULTS
A. Datasets
For evaluation, we utilize datasets from CIS in two distinct domains: healthcare and online wiki’s. The first dataset corresponds to the real access logs of the Vanderbilt University Medical Center (VUMC) EHR system. This system has been in application for over a decade and is well-ingrained in healthcare operations [14]. The logs document when an authenticated VUMC employee accessed a patient’s record. The second dataset corresponds corresponds to the publicly available revision logs of Wikipedia [13].1 We analyze the accesses collected over 30 weeks during the year 2006 in the EHR dataset and the revisions documented over 50 weeks during the year 2007 in the Wiki dataset.
In the EHR dataset, we refer to patient records as subjects, and user views of the records as accesses. Similarly, in the Wiki dataset, we refer to articles as subjects and user revisions as accesses. Certain summary information regarding the two datasets can be found in Table I.
TABLE I.
Statistics of EHR and Wiki datasets.
| Dataset | Weeks | Users/week | Subjects/week | Accesses/week |
|---|---|---|---|---|
| EHR | 30 | 2,281 | 13,148 | 44,250 |
| Wiki | 50 | 3,952 | 240 | 28,186 |
B. Experimental Design
The datasets do not document which (if any) accesses were intrusions. As such, to conduct a controlled evaluation, we injected simulated actions into the logs (i.e., changed 0’s to 1’s in the SU access matrix).
For this study, we use three scenarios to assess the intrusion detection rate under various settings:
Accesses Per User
We select a user at random, inject between 1 to 100 new subject accesses, and execute the detection model. This process is repeated 15 times per week.
User Per Access Load
We investigate how the number of intruding users influences the detection rate. We select a set of users to inject three intruding accesses into. We perform this analysis over the range of 2 to 20 intruding users.
Diverse Setting
We emulate a more realistic environment by allowing for a variety of simultaneous intruding users and actions. Specifically, we inject a set of random subject accesses, between 1 and 100, into a random set of users, between 1 and 20.
Each of these scenarios is simulated on a per week basis.
Detection Performance
We measure the performance of models using the receiver operating characteristic (ROC) curve. This is a characterization of the true positive rate versus the false positive rate for a binary classifier as its discrimination threshold is varied. The area under the ROC curve (AUC) reflects the relationship between sensitivity and specificity for a given test. A higher AUC indicates better performance. In the first two simulation settings, we report on the average AUC per simulation configuration.
C. Results and analysis
1) SNAD Scores Before Simulation
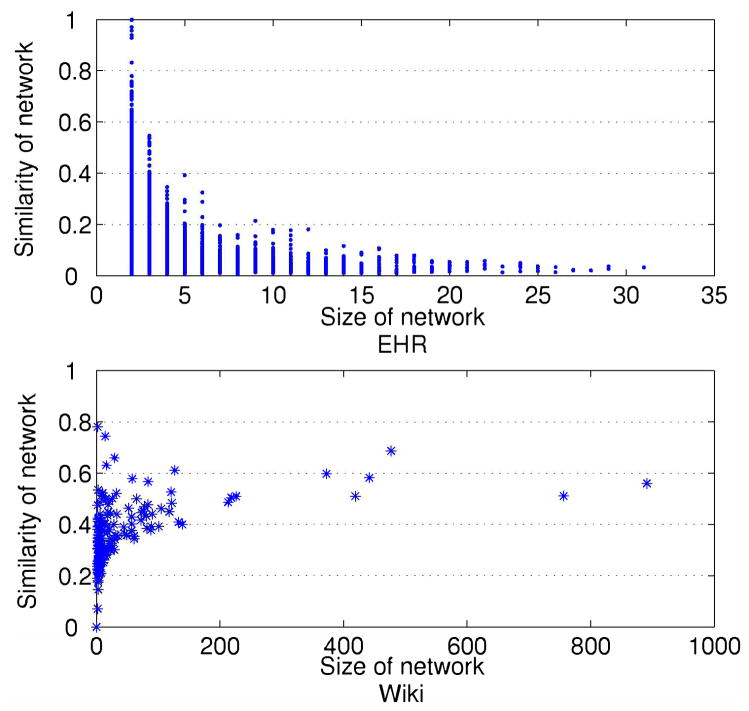
Figure 3 depicts the distributions of access network similarity in the EHR and Wiki datasets for an arbitrary week. Notably, these environments capture different social phenomena. For instance, in the EHR dataset, the majority of access networks are small in size. And, as shown in the upper plot of Figure 3 the similarity approaches zero as the network size grows. This demonstrates that when a user is suppressed from a network, the average similarity has little change. The main driving factor of this phenomenon is that large access networks in the EHR system tend to be varied in the user composition.
Fig. 3.
The distribution of similarity as a function of access network size.
In contrast, the lower plot of Figure 3 indicates that Wiki users in large access networks are relatively similar. This implies that when an intruder joins a network in Wikipedia, the average similarity will greatly decrease.
2) Accesses Per User
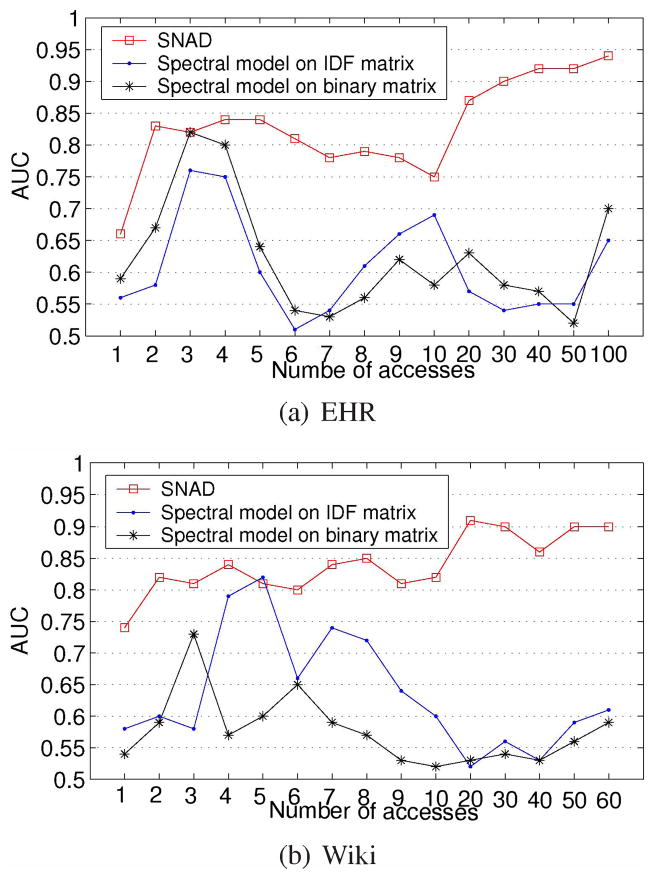
In the first experiment, we investigate how the number of intrusions committed by a single user influences detection. Figure 4 depicts the AUC of the detection models as a function of the number of simulated intrusions. It can be seen that SNAD has equal or larger AUC than both spectral models. We note there are only two points at which the spectral models and SNAD were equivalent (3 intruding accesses in the EHR dataset and 5 intruding accesses in the Wiki dataset). Additionally, unlike the spectral models, SNAD’s AUC tends to increase with the number of accesses. When the insider has only one simulated access, SNAD’s average AUC is nearly 0.65 compared to 0.59 of its nearest competitor, Spectral-Binary. When the number of simulated accesses is 30, SNAD’s AUC reaches 0.9, compared to
Fig. 4.
Average AUC of the detection models on varying quantities of simulated intrusions (one user intruding per simulation).
3) Users Per Access Load
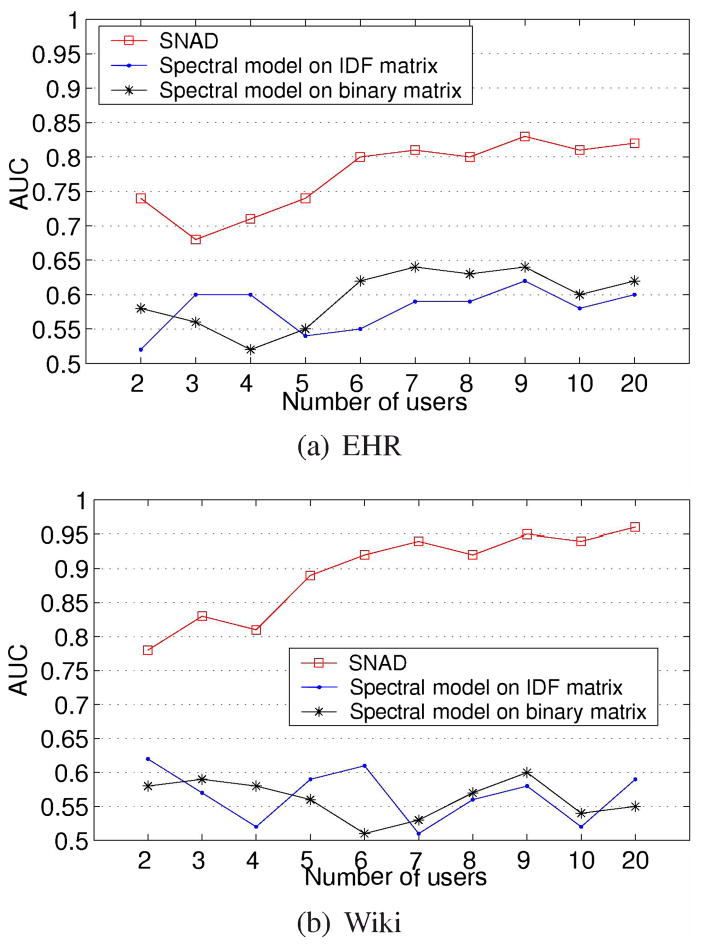
In this experiment, we investigate how the number of intruding insiders influences detection. We fix the number of simulated accesses to 3. The results are depicted in Figure 5, which demonstrates the AUC for all models increase with the number of accesses for the EHR dataset, but only SNAD’s AVC increases in the Wiki dataset. Nonetheless, SNAD greatly outperforms the spectral models at all evaluation points. This is because the insiders with simulated accesses greatly amend the local access network, but have little influence on the global network, which the spectral approach depends upon. The implication is that indirect relations, which are critical to discovery of intruding user behavior in general [3], [21], may be less important than the direct relations in the detection of specific intruding accesses. However, we recognize that a more a more detailed investigation, perhaps with more datasets, is necessary before such a conjecture can be confirmed.
Fig. 5.
Average AUC of the models when a different number of insiders are intruding. In this experiment, each insider issues threes intruding accesses.
Figure 5 demonstrates AVC increases with the number of intruding insiders. Here we see that SNAD exhibits an AVC that is 20–30% higher, on average, than the spectral models.
4) Diverse Insider Setting
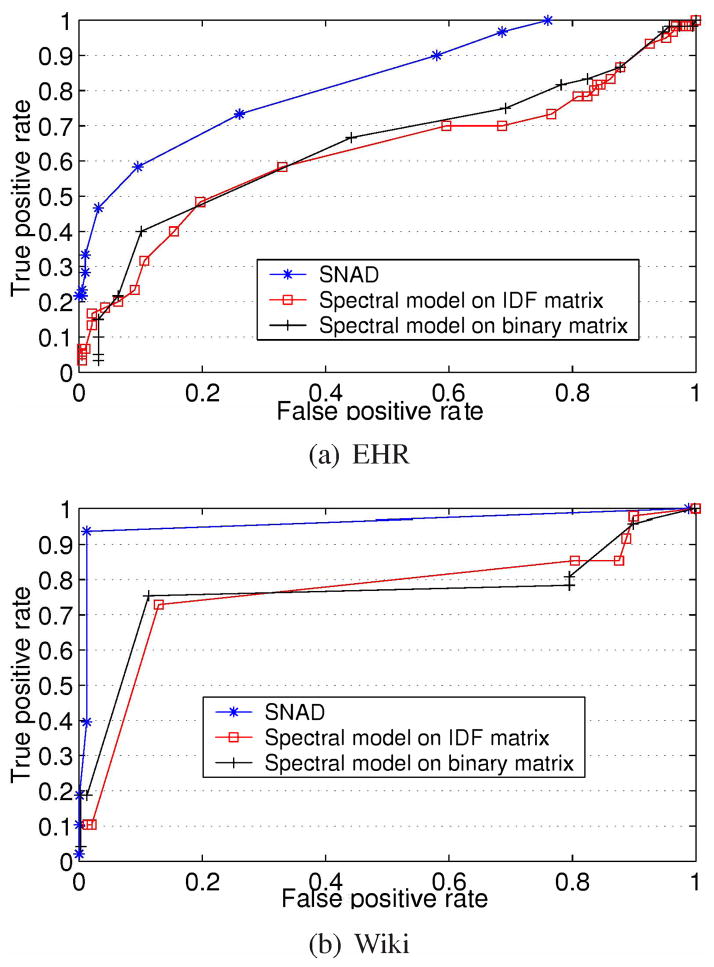
In the third experiment, we injected a random number of accesses into a random set of user vectors. Figure 6 provides a comparison of the ROC curves of the detection models for both datasets. It can be observed that SNAD has greater performance than the spectral models at every operating point.
Fig. 6.
ROC curves for detection models in a diverse setting, where the number of intruders and the quantity of intruding accesses are randomly generated.
Table II summarizes the average AVC scores of the detection models in this setting. The table indicates that SNAD achieves the highest AVC, 0.83 and 0.91 in the EHR and Wiki datasets, respectively. This translates into AVC scores that are 10–20% higher, on average, than the spectral models.
TABLE II.
AUC scores (+/− one standard deviation) of the detection models on the datasets.
| Dataset | SNAD | Spectral IDF | Spectral Binary |
|---|---|---|---|
| EHR | 0.83±0.03 | 0.74±0.06 | 0.69±0.05 |
| Wiki | 0.91±0.02 | 0.76±0.04 | 0.64±0.04 |
IV. Discussion and Conclusion
In this paper we proposed a “specialized” network anomaly detection model (SNAD) to discover anomalous actions in collaborative information systems (CIS). SNAD differs from existing insider threat detection techniques in that it is engineered to assess specific event-related actions as opposed to global patterns. The foundation of SNAD is an efficient unsupervised learning method, such that it can be deployed in real systems. We evaluated our technique against several competitors, based on spectral decomposition, with real EHR access and Wiki revision logs. The empirical results demonstrate that SNAD exhibits better performance than its competitors in almost every assessed scenario.
In addition, we believe SNAD is capable of detecting probabilistic mimicry attacks [24]. Imagine an adversary who games the system by imitating group behavior or the behavior of another user. Even though the imitating user exhibits normal behavior, if the user executes a single event-related action, it may be quickly identified by SNAD.
There are several limitations of the study that we wish to point out to serve as a guidebook for future research on this topic. First, our experiments suggest SNAD is appropriate in settings when access networks exhibit high similarity or there are a non-trivial number of illicit insiders. Large access networks with low network similarity tend to be varied in the user base and thus present low average similarity. In this case, the suppression of a user has little influence on the similarity of the access network. As a result, it appears that SNAD will not be appropriate for such larger networks.
Second, SNAD accounts for the relationship between users and subjects, but neglects the semantics of the relation. SNAD does not model the intention of a user while executing an action. Yet, in a CIS, the system is often mission-oriented, such that the semantics of the users and subjects are informative. For instance, in an EHR system, patients are assigned diagnoses and procedures, while users are affiliated with various departments and assigned certain roles within a healthcare organization. Rather than treat each user and patient equally, we believe that detection sensitivity could be improved by integrating such information into the network modeling process.
Finally, SNAD was evaluated on only one type of attack; i.e., when a user issues an intruding access randomly. Yet, in real systems, there may be many types of attacks, some which are more complex and require different simulation methods.
Acknowledgments
The authors thank D. Giuse for supplying the access logs, studied in this paper. The authors also thank E. Boczko, J. Denny, C. Gunter, D. Liebovitz, and the members of the Vanderbilt Health Information Privacy Laboratory for discussions. This research was sponsored by grants CCF-0424422 and CNS-0964063 from the National Science Foundation and 1R01LM010207 from the National Institutes of Health.
Footnotes
This dataset can be downloaded from the Stanford SNAP network repository. http://snap.stanford.edu/
Contributor Information
You Chen, Email: you.chen@vanderbilt.edu.
Steve Nyemba, Email: steve.l.nyemba@vanderbilt.edu.
Wen Zhang, Email: wen.zhang.l@vanderbilt.edu.
Bradley Malin, Email: b.malin@vanderbilt.edu.
References
- 1.Adamic LA, Adar E. Friends and neighbors on the web. Social Networks. 2003;25(3):211–230. [Google Scholar]
- 2.Byun J, Li N. Purpose based access control for privacy protection in relational database systems. VLDB. 2008;17:603–619. [Google Scholar]
- 3.Chen Y, Malin B. Detection of anomalous insiders in collaborative environments via relational analysis of access logs. CODASPY. 2011:63–74. doi: 10.1145/1943513.1943524. [DOI] [PMC free article] [PubMed] [Google Scholar]
- 4.Chen Y, Li Y, Cheng X, Guo L. Survey and taxonomy of feature selection algorithms in intrusion detection system. Inscrypt. 2006:153–167. [Google Scholar]
- 5.Doss G, Tejay G. Developing insider attack detection model: A grounded approach. ISI. 2009:107–112. [Google Scholar]
- 6.Eberle W, Holder L. Applying graph-based anomaly detection approaches to the discovery of insider threats. ISI. 2009:206–208. [Google Scholar]
- 7.Eldenburg L, Soderstrom N, Willis Y, Wu A. Behavioral changes following the collaborative development of an accounting information system. Accounting, Organizations and Society. 2010;35(2):222–237. [Google Scholar]
- 8.Georgiadis C, Mavridis I, Pangalos G, Thomas R. Flexible team-based access control using contexts. SACMAT. 2001:21–27. [Google Scholar]
- 9.Gruber T. Collective knowledge systems: where the social web meets the semantic web. Journal of Web Semantics. 2007;6(1):4–13. [Google Scholar]
- 10.Hillestad R, Bigelow J, Bower A, Girosi F, Melli R, Scoville R, Taylor R. Can electronic medical record systems transform health care? Health Affairs. 2005;24:1103–1107. doi: 10.1377/hlthaff.24.5.1103. [DOI] [PubMed] [Google Scholar]
- 11.Huang C, Li T, Wang H, Chang C. A collaborative support tool for creativity learning: Idea storming cube. ICALT. 2007:31–35. [Google Scholar]
- 12.Kulkarni D, Tripathi A. Context-aware role-based access control in pervasive computing systems. SACMAT. 2008:113–122. [Google Scholar]
- 13.Leskovec J, Huttenlocher D, Kleinberg J. Governance in social media: A case study of the Wikipedia promotion process. ICWSM. 2010 [Google Scholar]
- 14.Malin B, Nyemba S, Paulett J. Learning relational policies from electronic health record access logs. JBI. 2011 doi: 10.1016/j.jbi.2011.01.007. In Press. [DOI] [PMC free article] [PubMed] [Google Scholar]
- 15.Menachemi N, Brooks R. Reviewing the benefits and costs of electronic health records and associated patient safety technologies. Journal of Medical Systems. 2008;30(3):159–168. doi: 10.1007/s10916-005-7988-x. [DOI] [PubMed] [Google Scholar]
- 16.Noble CC, Cook DJ. Graph-based anomaly detection. SIGKDD. 2003:631–636. [Google Scholar]
- 17.Park J, Sandhu R, Ahn G. Role-based access control on the web. ACM Transactions on Information System Security. 2001;4(1):37–71. [Google Scholar]
- 18.Sarwar B, Karypis G, Konstan J, Riedl J. Item-based collaborative filtering recommendation algorithms. WWW. 2001:285–295. [Google Scholar]
- 19.Schultz E. A framework for understanding and predicting insider attacks. Computers and Security. 2002;21(6):526–531. [Google Scholar]
- 20.Shen H, Cheng X. Spectral methods for the detection of network community structure: A comparative analysis. Journal of Statistical Mechanics - Theory and Experiment P10020. 2010 [Google Scholar]
- 21.Shyu M, Chen S, Sarinnapakorn K, Chang L. A novel anomaly detection scheme based on principal component classifier. ICDM. 2003:172–179. [Google Scholar]
- 22.Sun J, Qu H, Chakrabarti D, Faloutsos C. Neighborhood formation and anomaly detection in bipartite graph. ICDM. 2005:418–425. [Google Scholar]
- 23.Thomas R, Sandhu S. Task-based authorization controls (tbac): A family of models for active and enterprise-oriented autorization management. IFIP ICDS. 1997:166–181. [Google Scholar]
- 24.Wagner D, Soto P. Mimicry attacks on host-based intrusion detection systems. CCS. 2002:255–264. [Google Scholar]
- 25.Wang X, Bayrak C. Injecting a permission-based delegation model to secure web-based workflow systems. ISI. 2009:101–106. [Google Scholar]
- 26.Westphal C. Data Mining for Intelligence, Fraud & Criminal Detection: Advanced Analytics & Information Sharing Technologies. CRC; 2008. [Google Scholar]
- 27.Seo YW, Sycara K. Cost-sensitive access control for illegitimate confidential access by insiders. ISI. 2006:117–128. [Google Scholar]
- 28.Zhang L, Ahn G, Chu B. A rule-based framework for role-based delegation and revocation. ACM Transactions on Information System Security. 2003;6(3):404–441. [Google Scholar]


