

Abstract
ShK is a 35-residue peptide that binds with high affinity to human voltage-gated potassium channels through a conserved K-Y dyad. Here we employ NMR measurements of backbone amide 15N spin relaxation rates to investigate motions of the ShK backbone. Although ShK is rigid on the ps-ns timescale, increased linewidths observed for eleven backbone amide 15N resonances identify chemical or conformational exchange contributions to spin relaxation. Relaxation dispersion profiles indicate that exchange between major and minor conformers occurs on the sub-millisecond timescale. Affected residues are mostly clustered around the central helix-kink-helix structure and the critical K22-Y23 motif. We suggest that the less structured minor conformer increases the exposure of Y23, known to contribute to binding affinity and selectivity, thereby facilitating its interaction with potassium channels. These findings have potential implications for the design of new channel blockers based on ShK.
Keywords: NMR spectroscopy, potassium channels blockers, structural biology, protein dynamics, relaxation dispersion
Introduction
The K+-channel blocker isolated from the Caribbean sea anemone Stichodactyla helianthus, ShK, is a 35-residue peptide stabilized by three disulfide bonds.[1] Its solution structure has been determined previously by NMR[2] and X-ray crystallography.[3] ShK adopts an extended conformation from residues 3-8, which are connected by a pair of interlocking turns to α-helical segments comprised of residues 14-19 and 21-24, with a distinct bend at residue 20. The C-terminal residues 31-34 form a turn-turn motif and the C-terminal residue C35 is linked by a disulfide bond to the N-terminal region (Figure 1). The ShK binding site that interacts with the vestibule of K+-channels has been well characterized by alanine scanning mutagenesis and synthetic mutants.[4] The conserved K22-Y23 dyad on the second helix plays a critical role in blocking voltage-gated potassium channels by inserting the positively-charged side chain of K22 into the ion conduction pathway and creating hydrophobic interactions between Y23 and aromatic channel residues.[5] Other residues involved in binding include R11, H19, S20 and R29, which together form a contiguous ShK binding surface.[6] These findings were supported by a model for ShK docked to the voltage-gated Kv1.3 channel, in which the structure of the mammalian channel was modeled by homology to the bacterial KcsA K+-channel.[7] Further studies of ShK-channel complexes have been hindered by the lack of mammalian channel structures, although recent attempts to model the turret region, including the channel pore helix, selectivity filter and adjacent residues, have shown success and agreed with experimental results.[8]
Figure 1. Structure of ShK.

Top, ribbon model (blue) of the ShK structure based upon PDB entry 1ROO[2a] with residue numbering showing the three cross-linking disulfide bonds (yellow) and the M21 (orange), K22 (blue) and Y23 (purple) side chains. The N- and C-termini are designated. Bottom, ShK amino acid sequence showing linked disulfide bonds.
ShK has been the focus of pharmaceutical interest because it blocks voltage-gated channels, in particular Kv1.3, with low picomolar Kd. Kv1.3 is upregulated during the activation of effector memory T cells (TEM), which are important in autoimmune diseases such as multiple sclerosis, rheumatoid arthritis and type I diabetes.[9] ShK analogs designed to selectively block the Kv1.3 channel over its Kv1.1 counterpart are currently being evaluated as therapeutics for these diseases.[2b, 10] An examination of the turret sequences of the two channels reveals that, in a 33-residue segment spanning the blocking site (residues 374-406, numbering based on the Drosophila Shaker channel), only six residues are not identical, and only four of these are non conservatively substituted. Therefore, Kv1.3-selectivity must be the result of subtle differences between the ShK interaction sites on various channels, underlining the importance of an accurate atomic-resolution mapping of the bound conformation adopted by the blocker when complexed with its target channel.
NMR is a powerful method for studying the structure and dynamics of polypeptides, and is particularly adept at investigating protein-protein complexes and the molecular factors contributing to binding affinity.[11] These capabilities have been greatly enhanced over the past two decades by the introduction of heteronuclear NMR methods in conjunction with isotopic labeling of proteins. Recently, an efficient system for expressing correctly folded and biologically active ShK in isotopically-labeled form has been developed.[12] Here we employ 15N-spin relaxation measurements to characterize structural dynamics of the ShK backbone. These data show that ShK behaves as a close-to-spherical polypeptide with a global tumbling time of 2.6 ns at 293 K, and exhibits backbone rigidity on the ps-ns timescale for residues 3-35. However, transverse 15N relaxation is affected by conformational or chemical exchange processes on µs-ms timescales, and we find compelling evidence for such slower motions in several ShK backbone amides surrounding the K+-channel binding site. We identify a major conformer and a less structured minor conformer in chemical equilibrium interchanging on the sub-millisecond scale, indicating that residues involved in interactions with the channel form a relatively flexible binding surface, which contrasts with the more rigid ShK scaffold. Establishing such flexibility in the ShK binding site has important implications for drug design efforts, and lays the foundation for improved structure-directed design of channel blockers based on ShK.
Results
Heteronuclear NMR structural characterization of ShK
The ability to produce ShK recombinantly provides several otherwise unavailable methods to characterize the structure and dynamics of the protein. Backbone 13C and 15N chemical shift assignments were obtained from HNCO, HNCOCACB and HNCACB spectra. The assignment was conducted at two different pH values: pH 5.4, which has been employed in previous structural studies of ShK,[2a, 13] and is preferable for relaxation studies, and the more biologically relevant pH 7.0. All expected cross-peaks were detected and well-resolved, with the exception of resonances from the first two amides, which were lost to solvent exchange, and overlapping cross peaks originating from residues I7 and K30. Chemical shifts have been deposited in the BioMagResBank under accession code 19990. A comparison of spectra at the two pH values reveals only minor chemical shift changes of residues in the vicinity of the imidazole ring of residue H19, which is the only ShK ionizable group expected to be affected by pH over this range[13] (Figure 2A). Secondary chemical shifts δ(δ13CO), δ(δ13Cα) and δ(δ13Cβ), defined as the difference between the chemical shift of a given nucleus and its expected value when in random coil conformation, and 2J- and 3J-coupling constants of backbone resonances exhibited negligible differences between samples at the two pH values. In both cases three short helical regions encompassing residues 14-18, 21-24 and 28-31 were identified by elevated δ(δ13CO) and δ(δ13Cα) values, lowered δ(δ13Cβ) values, and small (< 5 Hz) 3JHNHα couplings (Figure 2B). 2JCαN couplings (data not shown) further confirmed these results. TALOS+ analysis of secondary chemical shifts [14] afforded highly similar results at both pH values (Figure 2C-D). We conclude that changes in chemical shift observed in Figure 2A are due primarily to effects of the H19 ionization state. This justifies our investigation of ShK backbone motions at the lower pH which is beneficial for NMR relaxation measurements while maintaining biological relevance.
Figure 2. pH effects on ShK structure are negligible.

Left, overlay of 2D 1H-15N-HSQC spectra of ShK in 20 mM phosphate buffer, 10 mM NaCl, 7 % 2H2O, each acquired for 20 min at 16.4 T and 293 K, at pH 5.4 (filled contours) and 7.0 (single contours). Annotations are provided for the largest changes. Right, secondary chemical shifts for (A) 13CO, (B) 13Cα, (C) 13Cβ nuclei, and (D) the 3JHNHα scalar coupling. Values for pH 5.4 and 7.0 are shown in filled and empty bars, respectively. (E) TALOS+ analysis of secondary chemical shifts[14] showing the fraction of helical population along the ShK backbone at pH 5.4 (black) and pH 7.0 (grey). Data are unavailable for residues R1 and S2, whose amide protons rapidly exchange with solvent, and only partially available for the two overlapping residues I7 and K30.
Dynamics on the ps-ns timescale along the ShK backbone
Longitudinal and transverse relaxation rates (R1 and R2, respectively) and the heteronuclear {1H}-15N-nuclear Overhauser effect (hetNOE) were measured at static fields of 14.1 and 16.4 T for ShK at pH 5.4 and 293 K utilizing standard pulse programs.[15] The results of these measurements for the 30 detectable and non-overlapping ShK cross peaks are shown in Figure 3A-C. Relaxation rates were relatively uniform along the ShK backbone, with typical values at 293 K (excluding residue C3 close to the N-terminus) of 2.0-2.5 (2.0-2.4) s−1 for R1, 3.7-4.8 (4.0-5.2) s−1 for R2, and 0.58-0.70 (0.68-0.80) for the hetNOE at 14.1 (16.4) T. The similarity between R1 values at both fields is consistent with isotropic global motion with a correlation time meeting the condition τC ~ 1/ωN, or ca. 2.5 ns. This result was in excellent agreement with hydrodynamics calculations, which determined for ShK a radius of gyration of 13.7 Å, a rotational diffusion anisotropy of D∥/D⊥ = 1.3, where D∥ and D⊥ are the axial and radial diffusion constants, respectively, and a tumbling time of 2.6 ns.[16]
Figure 3. Backbone 15N relaxation in ShK.

Backbone 15N relaxation rates were measured at pH 5.4 and 293 K and the ensuing analysis was based on the model-free approach; results obtained at 16.4 and 14.1 T are shown in filled and open circles, respectively. (A) Longitudinal relaxation R1, (B) transverse relaxation R2, and (C) the heteronuclear NOE. Typical errors in relaxation rate measurements were 0.5-1.0% (omitted for clarity). (D) Squared generalized order parameters S2 and (E) fitted Rex term (at 14.1 T) derived from model free analysis of the relaxation parameters using the DYNAMICS suite.36 The Rex value at 16.4 is Rex (14.1)*(16.4/14.1)2. Rex is considered significant only when higher than 0.5 s−1.
Relaxation parameters were analyzed using the model-free approach (Figure 3D).[17] Overall, ShK was shown to be a rigid protein, with squared generalized order parameters in the 0.75-0.85 range throughout its sequence, without significant fast motions on the ps timescale. Exceptions to this general pattern of rigidity were residues K9, K18, H19, M21, L25, T31, G33 and T34, for which transverse relaxation could not be accounted for by global tumbling alone, indicating an significant exchange-related contribution, Rex > 1, to relaxation (Figure 3E). Significantly, for these residues, the R2/R1 ratio exceeded the trimmed average ratio (according to established criteria) by over three standard deviations. Although elevated R2/R1 ratios can occur for H-N bond-vectors aligned along the long axis in ellipsoid-shaped proteins, the structural anisotropy of ShK is insufficient to cause the observed effect. Thus, model-free analysis established an exchange-broadening contribution to 15N linewidths for several ShK residues.
Residues Q16, K18 and H19 exhibit a significant increase (> 4 s−1) in R2 (Figure S2, Supporting Information) as well as chemical shift changes (Figure 2) when ShK is exposed to the higher pH 7.0. This residue-specific increase in transverse relaxation rate for residues near H19 can be accounted for by a larger population of neutral histidine species at higher pH. The observation that only some exchange contributions to transverse relaxation are pH-dependent suggest that at least one additional exchange process affects ShK (vide infra).
Dynamics on the μs-ms timescale in ShK determined by relaxation dispersion
The observation of exchange broadening suggested rotating-frame (R1ρ) relaxation dispersion as an approach for characterizing slower backbone motions in ShK.[18] Relaxation of spin-locked transverse magnetization is governed by an effective magnetic field comprised of the applied spin-lock field and the offset of the spin-lock radiofrequency from the population-averaged resonance frequency. The latter component is influenced by chemical shift changes accompanying the exchange process, resulting in relaxation dispersion when the spin-lock amplitude and/or frequency are varied, and allowing exchange parameters to be extracted from the transverse component of R1ρ. An added benefit is the insensitivity of this measurement to solvent exchange. Accordingly, 15N R2(ωe) relaxation dispersion profiles were obtained from R1ρ relaxation rate constants measured at pH 5.4 and 283 K (chosen to improve spectral quality by reducing solvent exchange), and a static field strength of 14.1 T. The results were fitted to Equation (2) (see Experimental section below) in order to identify backbone 15N nuclei affected by slow motions. This analysis identified eleven ShK backbone amides (from residues K9, S10, C12, T13, K18, H19, M21, Y23, R24, L25 and T31) that are influenced by chemical or conformational exchange processes (Figure 4 and Figure S1, Supporting Information). All eleven residues met the criteria of Rex > 1 s−1, where Rex is the difference between extrapolated R2 rates as ωe →0 or ∞. Fitted exchange rates for individual residues were consistently in the 4000-7000 s−1 range, suggesting that all sites are affected by a common process. Global fitting afforded a rate of 5,300 s−1 for the observed transition, with the exception of H19 for which a value of 4,000 s−1 was obtained (Table 1); this may be a consequence of a protonation event that affects the effective exchange rate for this residue, as discussed above. Two considerations suggest that the global process is fast on the NMR chemical shift times scale, i.e. the rate of exchange between conformers is greater than the difference in chemical shifts of the nucleus in question in both conformers. First, near- or on-resonance (Δ/ω1 ≤ 0.4), the general expression for the exchange contribution to R1ρ relaxation valid for all time scales 19] indicates that data fit with Equation (2) (see Experimental Section below) should afford an effective exchange rate depending upon Δω when exchange is not in the fast limit. Because ShK dispersion data can be fit globally (i.e. independently of Δω which is clearly not identical for different residues) kex must be considerably larger than Δω. Second, the same general equation predicts a ratio of 1+ω12/(kex2 + Δω2) between the extrapolated value of Rex(ω1 → 0) and its value at the weakest ω1 field. The ratio of 1.0-1.1 found for ShK residues would require unrealistically large values of Δω if exchange were in the slow limit with kex < Δω. For a more detailed explanation establishing fast exchange for ShK resonances see the Supporting Information, Appendix A.
Figure 4. Relaxation dispersion identifies fast exchange in ShK at pH 5.4 and 283 K.

15N R2(ωe) relaxation dispersion profiles of ShK at 14.1 T for residues C17, H19, M21 and Y23. All other profiles are presented in the Supporting Information (Figure S1). Lines correspond to best fits.
Table 1.
Global fit parameters obtained from R2(ωe) relaxation dispersion data for ShK.
| Residue | kex(s−1) | R20 (s−1) | Φex (× 103 (rad/s)2 |
|---|---|---|---|
| K9 | 5300 ± 240 | 6.58 ± 0.05 | 8.3 ± 0.6 |
| S10 | 5300 ± 240 | 5.25 ± 0.06 | 9.3 ± 0.7 |
| C12 | 5300 ± 240 | 4.56 ± 0.05 | 8.7 ± 0.7 |
| T13 | 5300 ± 240 | 4.61 ± 0.06 | 8.4 ± 0.7 |
| K18 | 5300 ± 240 | 6.12 ± 0.08 | 14.5 ± 1.0 |
| M21 | 5300 ± 240 | 5.55 ± 0.14 | 27.5 ± 1.8 |
| Y23 | 5300 ± 240 | 5.26 ± 0.06 | 10.5 ± 0.7 |
| R24 | 5300 ± 240 | 5.48 ± 0.05 | 6.4 ± 0.6 |
| L25 | 5300 ± 240 | 5.55 ± 0.11 | 22.4 ± 1.4 |
| T31 | 5300 ± 240 | 5.24 ± 0.07 | 11.7 ± 0.8 |
| H19[a] | 4000 ± 200 | 5.08 ± 0.06 | 16.8 ± 0.8 |
Fitting of H19 to a separate kex rate resulted in a statistically significant improvement in fit quality; this is attributed to the fact that this residue can undergo protonation resulting in exchange between more than two states.
The value for the residue-specific exchange parameter Φex = p1p2Δω2N was in the range 6,000-11,000 s−2 for K9, S10, C12, T13, Y23, and R24, and in the range 11,000-30,000 s−2 for K18, H19, M21, L25 and T31. Assuming the chemical shift difference Δω is correlated with the extent of the conformational transition, these results define groups of residues experiencing smaller (in the case of the former six residues) and larger (in the case of the latter five residues) conformational changes. Significantly, residues most affected by the transition cluster around the central two helices of ShK (residues 14-18 and 21-25), which, importantly, include the conserved K22-Y23 dyad required for potassium channel blockade.
The contributions of p1, p2, and Δω to the exchange parameter cannot be deconvoluted in the fast exchange regime. Nevertheless, it is instructive to relate Φex of each affected residue to the 15N chemical shifts observed for ShK. It is reasonable to assume that structural effects on chemical shifts in the major ShK conformer cause them to deviate from their average (random coil) values, whereas in the minor conformer (presumably a less-structured state with higher energy, representing an excursion from the native conformation) chemical shifts would be closer to this average. Consistent with this notion, the 15N secondary chemical shifts of exchange-broadened residues are qualitatively correlated with Φex. As shown in Table 2, the five residues with the highest Φex values are also spectral outliers with large deviations from random coil shifts, a significant correlation when considering the multitude of molecular factors determining chemical shifts. We conclude that the conformational transition affecting ShK (i) is fast on the NMR timescale, (ii) is centered at the core helix-bend-helix motif in the toxin binding site, and (iii) involves an excursion from the native major conformer towards a less-folded minor conformer or ensemble of sparsely-populated states.
Table 2.
Correlation between exchange-broadening and chemical shifts in ShK.
| Residue | Φexa × 103 (s−2) | δ15N ppm | δ15NRCb ppm | (Δδ15N)2 × 10⁶ (s−2) |
|---|---|---|---|---|
| M21 | 27.5a | 130.4 | 119.6b | 17.0c |
| L25 | 22.4 | 111 | 121.8 | 17.0 |
| H19 | 16.8 | 112.9 | 118.2 | 4.1 |
| K18 | 14.5 | 115.4 | 120.4 | 3.6 |
| T31 | 11.6 | 124.2 | 113.6 | 16.4 |
| Y23 | 10.5 | 120.2 | 120.9 | 0.1 |
| S10 | 9.3 | 113.9 | 116.3 | 0.8 |
| C12 | 8.7 | 122.4 | 120.1 | 0.8 |
| T13 | 8.4 | 110.2 | 113.6 | 1.7 |
| K9 | 8.3 | 123.9 | 120.4 | 1.8 |
| R24 | 6.4 | 117.2 | 120.5 | 1.6 |
From the global fit at 14.1 T
Based on BMRB chemical shift statistics, http://www.bmrb.wisc.edu
Calculated as (δ15N – δ15NRC)2 × (ωN)2 at 14.1 T
Discussion
ShK is a potent and selective blocker of Kv1.3 channels, which are upregulated in TEM cells upon activation; these TEM cells have in turn been implicated in the onset of autoimmune diseases.[2b, 6, 10] Therefore, ShK is an important therapeutic lead to combat autoimmune diseases, and several Kv1.3-selective ShK analogs have been developed for this purpose.[2b, 10, 20] A detailed molecular understanding of how ShK interacts with the potassium channel would greatly enhance our ability to design new potent and selective ShK-based analogs. In particular, the behavior of small polypeptides such as ShK is best described as a combination of several stable conformations in equilibrium, and understanding the dynamics of inter-conversions within this conformational space is a prerequisite for a full picture of their binding capabilities.[21] The availability of recombinantly labeled ShK[12] allows its motions to be mapped using NMR spectroscopy by measuring relaxation rates of 15N nuclei along the toxin backbone.
ShK amide protons are susceptible to exchange with solvent, explaining why our measurements were conducted at pH 5.4 which reduces loss of signal to solvent exchange. This was particularly necessary for acquisition of relaxation dispersion experiments in a reasonable time. To ensure that our observations at pH 5.4 are physiologically relevant we established that the structural effects of a pH change (from 5.4 to 7.0) upon ShK structure are limited (Figure 2). Furthermore, the pattern of residues with elevated R2 rates indicative of conformational exchange was similar at both pH values, including residues K9, K18, H19, M21 (broadened beyond detection at pH 7.0), L25, T31 and T34. These observations imply that both structure and backbone motions of ShK are similar at pH 5.4 and 7.0, justifying our choice of the lower pH for this study.
To explore ShK conformational dynamics, 15N relaxation was measured at two static magnetic fields, and the data were evaluated using the model-free approach. Although generally exhibiting a rigid backbone on the ps-ns timescale, slower motions were detected for certain backbone 15N nuclei, first by their elevated transverse relaxation and later by relaxation dispersion experiments. A core of five ShK residues (K18, H19, M21, L25, T31) exhibited a large exchange contribution to relaxation, while six additional residues (K9, S10, C12, T13, Y23, R24) showed a smaller contribution. The determined global exchange rate of 5,300 s−1 corresponds to a lifetime of ~200 μs and is consistent with the line-broadening results. Based on the relaxation dispersion data, together with the appearance of a single set of ShK amide peaks at all concentrations and temperatures examined, we deduced that exchange between ShK conformations is fast on the NMR chemical shift time scale. Finally, since most strongly affected residues, particularly M21, L25, and T31, have large secondary chemical shifts, we propose that the states undergoing fast exchange are a major, more structured, conformer and a minor conformer that is less structured and therefore exhibits chemical shifts closer to random coil values. In contrast to a previous study[22], where secondary chemical shifts accounted entirely for exchange broadening, as reflected by a linear correlation between the two, exchange broadening and secondary chemical shifts in ShK are only qualitatively correlated and not co-linear, supporting our hypothesis that the minor conformer retains a significant degree of structure rather than representing an unfolded intermediate. It is important to note that our approach focuses on identifying backbone motions, and will not reflect additional changes, such as side-chain mobility and interactions or displacement of water and/or ions, all of which may contribute to the overall behavior of ShK as it binds to the potassium channel. Nonetheless, it is likely that backbone and side-chain motions are at least partially correlated, suggesting that our approach does provide a good first-order approximation to toxin motions that may be involved in channel binding.
While relaxation of all exchange-broadened residues could be explained by a single exchange rate, kex = 5,300 s−1, the behavior of residue H19 reflected the presence of additional exchange processes not separable from the primary exchange process, resulting in an effective rate of kex = 4,000 s−1. The observed differences in chemical shifts in the vicinity of this residue (Figure 2) suggest a protonation/deprotonation equilibrium of the H19 imidazole ring is responsible for this behavior. We hypothesize that both exchange processes contribute to ShK Rex values, but only for H19 is this event the dominant contribution to exchange-broadening, accounting for the inability to fit H19 to the global exchange rate, whereas for other affected residues exchange results predominantly from the transition into a less well-folded structure. At higher pH the population of deprotonated species becomes larger, leading to a larger contribution of Rex from the (de)protonation process, accounting for our observation that Rex increases at pH 7.0 for a subset of residues proximal to H19. Since our primary interest is the structural transition into a less folded state, the low pH data has the additional benefit of minimizing the contribution of the other process.
It is intriguing to relate these results to the structure of ShK as well as functional elements in the toxin that contribute to its biological activity. Figure 5 shows the location of residues strongly and weakly affected by the conformational exchange process as detected by relaxation dispersion experiments. The regions most affected by this event overlap closely with the functional domain of the toxin, including the helix-kink-helix motif at residues 14-26 and the key residues K22-Y23. One possible mechanism for exchange broadening relates to the network of disulfide bonds that dictates the character of ShK. Disulfide bonds are capable of adopting a range of geometries that potentially lead to significant backbone motions,[23] and motions on a similar timescale have been reported for bovine pancreatic trypsin inhibitor,[24] the extracellular domain of the TβR2 receptor[25] and disulfide-bonded proteins of the chemokine family.[26] However, we note that only one cysteine residue (C12) is included in the group of residues (weakly) affected by exchange, and even in this case, a complementary effect is not seen for its disulfide partner (C28). Thus, it appears that disulfide rearrangement is not the dominant source of conformational exchange in ShK.
Figure 5. Structural implications of conformational exchange in ShK.
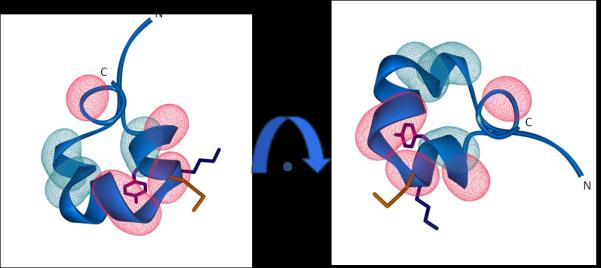
The ShK backbone is shown in blue, and the side-chains of M21, K22 and Y23 in orange, dark-blue and purple, respectively. Red (cyan) wire-mesh indicates residues exhibiting large (small) effects of exchange-broadening, respectively. The structures are related by a 90 degree rotation around an axis perpendicular to the page.
An alternative explanation of our results addresses an important question in understanding toxin binding to potassium channels. Residue Y23 is part of the critical KY dyad conserved in K+-channel blockers from various sources in the animal kingdom. Studies of Y23 mutants of ShK have established that the aromatic character of this residue is required for high-affinity binding to channels.[4b, 7b] This residue is hypothesized to interact with aromatic residues of the channel vestibule, possibly residues homologous to the Shaker Y400 or H404, thus contributing to channel binding and subtype selectivity.[4, 27] However, examination of the ShK structure reveals that Y23 has a low solvent accessible surface area, only 23%, whereas all other residues with the exception of C17 in the helix-kink-helix domain (residues 14-26) are more exposed (30-80% accessible). This apparent contradiction between the buried character of Y23 and its role in interacting with the channel may be relieved by our findings of significant backbone motions in the toxin channel-binding domain. The minor ShK conformer may represent a toxin structure in which the Y23 side-chain is more exposed to solvent owing to a ‘loosening’ of the helices. This excursion from the native ShK structure may then lead to conformational selection in binding to the channel, resulting in an equilibrium shift towards the more exposed conformer. Such transient conformational changes are not precluded by the presence of three disulfide bonds in a relatively small polypeptide. A similar phenomenon has been suggested for the α-conotoxins from Conus imperialis, in which a key tryptophan is buried in the free peptide yet interacts with the nicotinic acetylcholine receptor,[28] and from Conus striatus, for which a modeling study found a minor conformer with an exposed key tyrosine residue.[29] Moreover, conformational exchange with relevance to channel blocking similar to our observations has been reported for other toxins with multiple disulfide bonds, including μ-conotoxin SIIIA[30] and spider venom π-TRTX-Pc1a.[31] Our suggestion of a more accessible Y23 in the minor conformer is also consistent with recent modeling studies of ShK in complex with the Kv1.3 potassium channel, which revealed a change in orientation of the helix spanning residues 21-25 and an increase in exposure of the KY dyad upon binding. [8b] Furthermore, molecular dynamics simulations for ShK have demonstrated that the toxin can access less-structured conformations (unpublished results). While further studies will be required to better understand the properties of the minor conformer, ShK conformational flexibility as identified by NMR relaxation measurements most likely contributes to its interaction with the K+-channel.
Conclusions
15N-spin relaxation measurements and relaxation dispersion profiles of ShK backbone amides have identified a minor conformer in equilibrium with the previously characterized major structural conformer. We find that the minor species represents a less-structured form of the toxin, and exchange between the two conformers occurs on the sub-millisecond timescale. The location of exchange-broadened residues in the channel-binding interface implies a correlation between this conformational flexibility and blocking of the channel, possibly by increasing the exposure of the key residue Y23 to interaction with specific channel functional groups. Thus, motions and structural fluctuations of toxins become a factor to be considered when designing improved channel blockers.
Experimental Section
NMR sample preparation
Samples of isotopically-labeled ShK toxin were expressed and purified as described previously.[12] Lyophilized 15N- or 13C,15N-labeled ShK was dissolved in 10 mM phosphate buffer (adjusted to pH 5.4 or 7.0) containing 10 mM NaCl and 7 % 2H2O. Typical ShK concentrations were 0.3-0.9 mM.
Acquisition of NMR data
NMR measurements were conducted on Bruker DRX700 and DRX600 spectrometers equipped with cryogenic triple-resonance TCI probes, and a Bruker AVANCE III 600 spectrometer with a TCI H&F-C/N-D cryogenic probe, all equipped with z-axis pulsed field gradients. Sample temperature was calibrated using a 99.9%-2H4-methanol sample in accordance with published protocols to avoid radiation damping effects on the calibration.[32] 1H, 15N-HSQC spectra were acquired in echo-antiecho fashion with 96-128 complex points, acquisition times of 39.2-53 ms in the 15N dimension, and 1024 complex points and an acquisition time of 91 ms in the observed dimension. Backbone chemical shift assignments were obtained from triple-resonance HNCO, HN(CO)CACB and HNCACB spectra acquired at 293 K using sensitivity-enhanced echo-antiecho detection.[33] These were typically acquired with 30-40 complex points and acquisition times of 19.2-23.5 ms in the 15N dimension, and 1024 complex points and acquisition times of 91-104.5 ms in the observed dimension. In the 13C dimension, experiments with 13CO evolution were acquired with 32-36 complex points and 20.5-23.05 ms acquisition time, and experiments with Cα/β evolution were acquired with 38-40 complex points and 3.85-4.05 ms acquisition time. Values of 3JHNHA and 2JcαN for determining secondary structure along the ShK backbone were extracted from the appropriate J-modulated spectra.[34]
15 N relaxation measurements
Measurements of the longitudinal and transverse 15N relaxation rates, R1 and R2, and the hetNOE were performed using standard methods,[15] in which acquisition of all delay points were fully interleaved. Measurements were conducted at two static magnetic fields, 14.1 and 16.4 T, corresponding to 1H Larmor frequencies of 600 and 700 MHz. Complex points acquired were 1024 (512) and 180-200 (80), and acquisition times were 81 (61) ms in the observed dimension and 104.3 (50.6) ms in the 15N dimension for the 700 (600) MHz field. A total of 16 (80-88) transients per t1 increment was acquired for measurements of R1 and R2. R1 measurements were based on 9 (8) collected time points with parametric delays of 0-1000 (0-900) ms on the 700 (600) MHz spectrometer. Carr-Purcell Meiboom-Gill (CPMG)-based R2 measurements were acquired with 15N inversion pulses applied with a pulse spacing equivalent to a 1.1 kHz frequency, and similarly based on 7 (8) collected time points with parametric delays of 33-288 (33-381) ms at 700 (600) MHz. The delay between scans was set at 2.0 (1.95) s. The determination of uncertainties in peak intensity was based upon signal-to-noise ratios in the spectra. hetNOEs were determined by recording pairs of interleaved spectra with and without proton saturation during the recycle delay. A total of 16 (168) transients was collected per t1 experiment, and delays between scans were 4.0 s.
15N R1ρ relaxation rates were measured at 600 MHz 1H frequency and 283 K. Standard on-resonance[35] and off-resonance[36] two-dimensional 15N R1ρ experiments were performed at spin lock fields higher than 700 Hz. In the on-resonance experiments, spins were aligned along the direction of the effective field using a previously described scheme,[14] which covers a bandwidth of approximately ± 0.6 ω1 ; in the off-resonance experiment, adiabatic pulses used to align magnetization had durations of 10 ms and a frequency sweep of 25 kHz. On-resonance data was recorded with four scans, at seven spin-lock periods (9, 27, 46, 69, 96, 128 and 171 ms) and recycle delays of 3.0 s or 6.0 s. Off-resonance data were recorded with the same seven spin-lock periods and a recycle delay of 3.0 s. R1ρ relaxation rates were measured as a function of effective field strength, ωe, by varying the spin-lock field strength, ω1, and resonance offset, ΔΩ. The strength of the effective field is defined as ωe = (ω12 +ΔΩ2)1/2, where ΔΩ = Ω0 − ωrf is the offset of the rf field from Ω0, which is the population-averaged resonance frequency of a given nuclear spin. The magnitude of ω1 was calibrated as described previously.[35b] The on-resonance R1ρ experiments were performed using ten different spin-lock field strengths (738 ± 6, 793 ± 6, 856 ± 10, 958 ± 4, 1048 ± 11, 1128 ± 12, 1206 ± 13, 1289 ± 14, 1389 ± 16, and 1535 ± 16 Hz). One off-resonance experiment was performed using a spin-lock field strength of 1128 ± 12 Hz and a resonance offset of 1040 Hz. At low spin-lock field strengths, a one-dimensional selective R1ρ pulse scheme[37] was employed to record data at nine spin-lock field strengths (207 ± 3, 252 ± 4, 305 ± 6, 363 ± 6, 415 ± 7, 459 ± 7, 511 ± 10, 634 ± 6, and 738 ± 6 Hz) with resonance offsets set to zero; 32-128 scans were accumulated for each 1D spectrum with a recycle delay of 1.5 s..
Spectral processing was performed with NMRPipe software package.[38] Cross-peak intensities for determining relaxation rates were quantified using the SPARKY software package (T.D. Goddard and D. G. Kneller, University of California, San Francisco). R1ρ rates were determined by fitting peak intensities at different spin-lock periods to an exponential function.
Hydrodynamic calculations
The inertia tensor of ShK toxin (PDB accession code 1ROO)[2a] was calculated using in-house scripts, and the hydrodynamics analysis for ShK was performed assuming T = 293 K using the HYDRONMR program.[16] Fractions of solvent accessible surface area were calculated for the same ShK structure using Discovery Studio (Accelrys, San Diego, CA).
Analysis of relaxation data
Peak intensities at different delays in R1, R2 and hetNOE measurements were obtained using the TOPSPIN 2.1 Dynamics Center suite (Bruker). R1 and R2 values were determined by nonlinear least-square fitting of the data to an exponential curve I(t)=I0exp(-Rjt) (j=1,2). hetNOEs were estimated by calculating the ratio of intensities in spectra recorded with and without proton saturation, and errors extracted from the uncertainties of the individual measurements. Typical errors in measured relaxation rates as estimated from the S/N ratios of the spectra did not exceed 1 %. Relaxation parameters were interpreted using the model-free approach[17] and analyzed using the Matlab-based DYNAMICS platform[39] to extract squared generalized order parameters, the correlation time for global motion, and the effective correlation times for local motion. Analysis was based on all backbone 1H,15N groups, with the exception of the unstructured first two residues, and the overlapping from I7 and K30. Fitting relaxation rates using spectral density functions followed well-established methods[17c, 39a]. Briefly, five dynamical models derived from the model-free formalism[17b, 40] were tested for goodness-of-fit and model selection was based on Monte-Carlo simulations and standard statistical tools. Rates of transverse relaxation contributed by chemical exchange were derived from the measured transverse relaxation rates using the relation R2(experimental) = R2(intrinsic relaxation) + Rex, where Rex is the conformational or chemical exchange contribution, and R2(intrinsic relaxation) is determined using the global tumbling time calculated for other ShK residues.
15 N R2 relaxation dispersion analysis
In an R1ρ experiment, the relaxation rate for the decay of magnetization spin-locked along the direction of the effective field is given by [19, 41]:
| [Eq. (1)] |
where θ = tan−1 (ω1/ΔΩ), is the intrinsic transverse relaxation rate constant due to dipolar and chemical shift anisotropy interactions, and Rex(ωe) is the chemical exchange contribution. The data were first analyzed on a per-residue basis. For the off-resonance R1ρ experiments, resonances with tilt angles in the range 35 ° ≤ θ ≤ 65 ° were included and for the on-resonance experiments a given resonance was included only when ΔΩ ≤ |0.4ω1/2π| Hz.[42] All data were fit with a two-state chemical exchange model. The transverse relaxation rate, R2(ωe), at any ωe value, can be described by[41a]
| [Eq. (2)] |
in which , pi is the fractional site population of site i and p1 + p2 = 1, ΔωN is the difference in 15N chemical shifts between two states, and kex = k1+k−1 is the sum of forward and reverse rate constants. R2(ωe) dispersion curves were fitted to Equation (2) both individually and globally by χ2 minimization using Mathematica (v9, Wolfram Research, Inc.). All residues with Rex > 1 s−1 could be globally fit with a common value of kex with the exception of H19, which required an individual fitting based on a standard F-test (p < 0.05). The uncertainties in the fitted parameters were estimated by Monte Carlo simulations with 500 iterations.[43]
Supplementary Material
Acknowledgements
We are indebted to Prof. Eva Meirovitch (BIU) for her assistance in interpretation of relaxation experiments, and Drs. Hugo Gottlieb and Keren Keinan-Adamsky (BIU) for technical support at the NMR facility. This work was supported in part by grants from the National Institutes of Health (NS073712) to RSN and the US National Institutes of Health (GM59273) to AGP. RSN also acknowledges the award of a fellowship by the National Health and Medical Research Council of Australia. JHC acknowledges support of the Christians for Israel Chair for Medical Research. The 700 MHz spectrometer at Bar Ilan University was purchased with the support of the Converging Technologies Fund and Fundacion Adar. The AVANCE 600 NMR spectrometer at Columbia University was purchased with support of NIH grant RR026540.
Abbreviations
- CPMG
Carr-Purcell-Meiboom-Gill
- hetNOE
hetero-nuclear {1H}-15N-nuclear Overhauser effect
- HSQC
heteronuclear single-quantum coherence
- R1
longitudinal relaxation rate constant
- R1ρ
spin-locked rotating frame relaxation rate constant
- R2
transverse relaxation rate constant
- RD
relaxation dispersion
- ShK
K+-channel toxin from Stichodactyla helianthus
- TEM
effector memory T cells
References
- 1.Castañeda O, Sotolongo V, Amor AM, Stöcklin R, Anderson AJ, Harvey AL, Engström A, Wernstedt C, Karlsson E. Toxicon. 1995;33:603–613. doi: 10.1016/0041-0101(95)00013-c. [DOI] [PubMed] [Google Scholar]
- 2.a Tudor JE, Pallaghy PK, Pennington MW, Norton RS. Nat. Struct. Biol. 1996;3:317–320. doi: 10.1038/nsb0496-317. [DOI] [PubMed] [Google Scholar]; b Pennington MW, Beeton C, Galea CA, Smith BJ, Chi V, Monaghan KP, Garcia K, Rangaraju S, Giuffrida A, Plank D, Crossley G, Nugent D, Khaytin I, Lefievre Y, Peshenko I, Dixon C, Chauhan S, Orzel A, Inoue T, Hu X, Moore RV, Norton RS, Chandy KG. Mol. Pharmacol. 2009;75:762–773. doi: 10.1124/mol.108.052704. [DOI] [PMC free article] [PubMed] [Google Scholar]
- 3.Dang B, Kubota T, Mandal K, Bezanilla F, Kent SBH. J. Am. Chem. Soc. 2013;135:11911–11919. doi: 10.1021/ja4046795. [DOI] [PMC free article] [PubMed] [Google Scholar]
- 4.a Pennington MW, Mahnir VM, Khaytin I, Zaydenberg I, Byrnes ME, Kem WR. Biochemistry. 1996;35:16407–16411. doi: 10.1021/bi962463g. [DOI] [PubMed] [Google Scholar]; b Rauer H, Pennington M, Cahalan M, Chandy KG. J. Biol. Chem. 1999;274:21885–21892. doi: 10.1074/jbc.274.31.21885. [DOI] [PubMed] [Google Scholar]
- 5.Gilquin B, Racapé J, Wrisch A, Visan V, Lecoq A, Grissmer S, Ménez A, Gasparini S. J. Biol. Chem. 2002;277:37406–37413. doi: 10.1074/jbc.M206205200. [DOI] [PubMed] [Google Scholar]
- 6.a Norton RS, Pennington MW, Wulff H. Curr. Med. Chem. 2004;11:3041–3052. doi: 10.2174/0929867043363947. [DOI] [PubMed] [Google Scholar]; b Norton RS, Pennington MW, Beeton C. In: Venoms to Drugs: Venom as a Source for the Development of Human Therapeutics. King GF, editor. Royal Society of Chemistry; 2013. [Google Scholar]
- 7.a Lanigan MD, Kalman K, Lefievre Y, Pennington MW, Chandy KG, Norton RS. Biochemistry. 2002;41:11963–11971. doi: 10.1021/bi026400b. [DOI] [PubMed] [Google Scholar]; b Kalman K, Pennington MW, Lanigan MD, Nguyen A, Rauer H, Mahnir V, Paschetto K, Kem WR, Grissmer S, Gutman GA, Christian EP, Cahalan MD, Norton RS, Chandy KG. J. Biol. Chem. 1998;273:32697–32707. doi: 10.1074/jbc.273.49.32697. [DOI] [PubMed] [Google Scholar]
- 8.a Pennington MW, Harunur Rashid M, Tajhya RB, Beeton C, Kuyucak S, Norton RS. FEBS Lett. 2012;586:3996–4001. doi: 10.1016/j.febslet.2012.09.038. [DOI] [PMC free article] [PubMed] [Google Scholar]; b Rashid MH, Heinzelmann G, Huq R, Tajhya RB, Chang SC, Chhabra S, Pennington MW, Beeton C, Norton RS, Kuyucak S. PLoS ONE. 2013;8:e78712. doi: 10.1371/journal.pone.0078712. [DOI] [PMC free article] [PubMed] [Google Scholar]
- 9.Beeton C, Wulff H, Standifer NE, Azam P, Mullen KM, Pennington MW, Kolski-Andreaco A, Wei E, Grino A, Counts DR, Wang PH, LeeHealey CJ, Andrews B, Sankaranarayanan A, Homerick D, Roeck WW, Tehranzadeh J, Stanhope KL, Zimin P, Havel PJ, Griffey S, Knaus HG, Nepom GT, Gutman GA, Calabresi PA, Chandy KG. Proc. Natl. Acad. Sci. USA. 2006;103:17414–17419. doi: 10.1073/pnas.0605136103. [DOI] [PMC free article] [PubMed] [Google Scholar]
- 10.Chi V, Pennington MW, Norton RS, Tarcha EJ, Londono LM, Sims-Fahey B, Upadhyay SK, Lakey JT, Iadonato S, Wulff H, Beeton C, Chandy KG. Toxicon. 2012;59:529–546. doi: 10.1016/j.toxicon.2011.07.016. [DOI] [PMC free article] [PubMed] [Google Scholar]
- 11.a Kay LE. J. Magn. Res. 2005;173:193–207. doi: 10.1016/j.jmr.2004.11.021. [DOI] [PubMed] [Google Scholar]; b Takahashi H, Nakanishi T, Kami K, Arata Y, Shimada I. Nat. Struct. Biol. 2000;7:220–223. doi: 10.1038/73331. [DOI] [PubMed] [Google Scholar]; c Zuiderweg ERP. Biochemistry. 2003;41:1–7. doi: 10.1021/bi011870b. [DOI] [PubMed] [Google Scholar]
- 12.Chang SC, Galea CA, Leung EW, Tajhya RB, Beeton C, Pennington MW, Norton RS. Toxicon. 2012;60:840–850. doi: 10.1016/j.toxicon.2012.05.017. [DOI] [PMC free article] [PubMed] [Google Scholar]
- 13.Tudor JE, Pennington MW, Norton RS. Eur. J. Biochem. 1998;251:133–141. doi: 10.1046/j.1432-1327.1998.2510133.x. [DOI] [PubMed] [Google Scholar]
- 14.Shen Y, Delaglio F, Cornilescu G, Bax A. J. Biomol. NMR. 2009;44:213–223. doi: 10.1007/s10858-009-9333-z. [DOI] [PMC free article] [PubMed] [Google Scholar]
- 15.Farrow NA, Muhandiram R, Singer AU, Pascal SM, Kay CM, Gish G, Shoelson SE, Pawson T, Forman-Kay JD, Kay LE. Biochemistry. 1994;33:5984–6003. doi: 10.1021/bi00185a040. [DOI] [PubMed] [Google Scholar]
- 16.Garcia de la Torre J, Huertas ML, Carrasco B. J. Magn. Reson. 2000;147:138–146. doi: 10.1006/jmre.2000.2170. [DOI] [PubMed] [Google Scholar]
- 17.a Kempf JG, Loria JP. Cell Biochem. Biophys. 2003;37:187–211. doi: 10.1385/cbb:37:3:187. [DOI] [PubMed] [Google Scholar]; b Lipari G, Szabo A. J. Am. Chem. Soc. 1982;104:4546–4570. [Google Scholar]; c Mandel AM, Akke M, Palmer AG., III J. Mol. Biol. 1995;246:144–163. doi: 10.1006/jmbi.1994.0073. [DOI] [PubMed] [Google Scholar]
- 18.Palmer AG., III J. Magn. Reson. 2014;241:3–17. doi: 10.1016/j.jmr.2014.01.008. [DOI] [PMC free article] [PubMed] [Google Scholar]
- 19.Trott O, Palmer AG., III J. Magn. Reson. 2002;154:157–160. doi: 10.1006/jmre.2001.2466. [DOI] [PubMed] [Google Scholar]
- 20.Tarcha EJ, Chi V, Munoz-Elias EJ, Bailey D, Londono LM, Upadhyay SK, Norton K, Banks A, Tjong I, Nguyen H, Hu X, Ruppert GW, Boley SE, Slauter R, Sams J, Knapp B, Kentala D, Hansen Z, Pennington MW, Beeton C, Chandy KG, Iadonato SP. J. Pharmacol. Exp. Ther. 2012;342:642–653. doi: 10.1124/jpet.112.191890. [DOI] [PMC free article] [PubMed] [Google Scholar]
- 21.a Ma B, Kumar S, Tsai CJ, Nussinov R. Protein Eng. 1999;12:713–720. doi: 10.1093/protein/12.9.713. [DOI] [PubMed] [Google Scholar]; b Dill KA. Prot. Sci. 1999;8:1166–1180. doi: 10.1110/ps.8.6.1166. [DOI] [PMC free article] [PubMed] [Google Scholar]
- 22.Grey MJ, Tang Y, Alexov E, McKnight CJ, Raleigh DP, Palmer AG., III J. Mol. Biol. 2006;355:1078–1094. doi: 10.1016/j.jmb.2005.11.001. [DOI] [PubMed] [Google Scholar]
- 23.a Fass D. Annu. Rev. Biophys. 2012;41:63–79. doi: 10.1146/annurev-biophys-050511-102321. [DOI] [PubMed] [Google Scholar]; b Khoo KK, Norton RS. Amino Acids, Peptides and Proteins in Organic Chemistry. Vol. 5. Wiley-VCH Verlag; Weinheim, Germany: 2011. pp. 395–417. [Google Scholar]
- 24.Otting G, Liepinsh E, Wuthrich K. Biochemistry. 1993;32:3571–3582. doi: 10.1021/bi00065a008. [DOI] [PubMed] [Google Scholar]
- 25.Deep S, Walker KP, Shu Z, Hinck AP. Biochemistry. 2003;42:10126–10139. doi: 10.1021/bi034366a. [DOI] [PubMed] [Google Scholar]
- 26.Crump MP, Spyracopoulos L, Lavigne P, Kim K-S, Clark-Lewis I, Sykes BD. Prot. Sci. 1999;8:2041–2054. doi: 10.1110/ps.8.10.2041. [DOI] [PMC free article] [PubMed] [Google Scholar]
- 27.Dauplais M, Lecoq A, Song J, Cotton J, Jamin N, Gilquin B, Roumestand C, Vita C, de Medeiros CL, Rowan EG, Harvey AL, Ménez A. The Journal of biological chemistry. 1997;272:4302–4309. doi: 10.1074/jbc.272.7.4302. [DOI] [PubMed] [Google Scholar]
- 28.a Gehrmann J, Daly NL, Alewood PF, Craik DJ. J. Med. Chem. 1999;42:2364–2372. doi: 10.1021/jm990114p. [DOI] [PubMed] [Google Scholar]; b Ulens C, Hogg RC, Celie PH, Bertrand D, Tsetlin V, Smit AB, Sixma TK. Proc. Natl. Acad. Sci. USA. 2006;103:3615–3620. doi: 10.1073/pnas.0507889103. [DOI] [PMC free article] [PubMed] [Google Scholar]
- 29.Camilloni C, Cavalli A, Vendruscolo M, Chem J. Theory Comput. 2013;9:5610–5617. doi: 10.1021/ct4006272. [DOI] [PubMed] [Google Scholar]
- 30.Yao S, Zhang MM, Yoshikami D, Azam L, Olivera BM, Bulaj G, Norton RS. Biochemistry. 2008;47:10940–10949. doi: 10.1021/bi801010u. [DOI] [PMC free article] [PubMed] [Google Scholar]
- 31.Saez NJ, Mobli M, Bieri M, Chassagnon IR, Malde AK, Gamsjaeger R, Mark AE, Gooley PR, Rash LD, King GF. Mol. Pharmacol. 2011;80:796–808. doi: 10.1124/mol.111.072207. [DOI] [PubMed] [Google Scholar]
- 32.Findeisen M, Brand T, Berger S. Magn. Res. Chem. 2007;45:175–178. doi: 10.1002/mrc.1941. [DOI] [PubMed] [Google Scholar]
- 33.Yamazaki T, Lee W, Arrowsmith CH, Muhandiram DR, Kay LE. J. Am. Chem. Soc. 1994;116:11665–11666. [Google Scholar]
- 34.a Kuboniwa H, Grzesiek S, Delaglio F, Bax A. J. Biomol. NMR. 1994;4:871–878. doi: 10.1007/BF00398416. [DOI] [PubMed] [Google Scholar]; b Wirmer J, Schwalbe H. J. Biomol. NMR. 2002;23:47–55. doi: 10.1023/a:1015384805098. [DOI] [PubMed] [Google Scholar]
- 35.a Akke M, Palmer AG., III J. Am. Chem. Soc. 1996;118:911–912. [Google Scholar]; b Palmer AG, III, Kroenke CD, Loria JP. Meth.Enzymol. 2001;339:204–238. doi: 10.1016/s0076-6879(01)39315-1. [DOI] [PubMed] [Google Scholar]; c Korzhnev DM, Skrynnikov NR, Millet O, Torchia DA, Kay LE. J. Am. Chem. Soc. 2002;124:10743–10753. doi: 10.1021/ja0204776. [DOI] [PubMed] [Google Scholar]
- 36.Mulder FAA, de Graaf RA, Kaptein R, Boelens R. J. Magn. Reson. 1998;131:351–357. doi: 10.1006/jmre.1998.1380. [DOI] [PubMed] [Google Scholar]
- 37.Korzhnev DM, Orekhov VY, Kay LE. J. Am. Chem. Soc. 2005;127:713–721. doi: 10.1021/ja0446855. [DOI] [PubMed] [Google Scholar]
- 38.Delaglio F, Grzesiek S, Vuister GW, Zhu G, Pfeifer J, Bax A. J. Biomol. NMR. 1995;6:277–293. doi: 10.1007/BF00197809. [DOI] [PubMed] [Google Scholar]
- 39.a Hall JB, Fushman D. J. Biomol. NMR. 2003;27:261–275. doi: 10.1023/a:1025467918856. [DOI] [PubMed] [Google Scholar]; b Hall JB, Fushman D. J. Am. Chem. Soc. 2006;128:7855–7870. doi: 10.1021/ja060406x. [DOI] [PMC free article] [PubMed] [Google Scholar]
- 40.Clore GM, Szabo A, Bax A, Kay LE, Driscoll PT, Gronenborn AM. J. Am. Chem. Soc. 1990;112:4989–4991. [Google Scholar]
- 41.a Deverell C, Morgan RE, Strange JH. Mol. Phys. 1970;18:553–559. [Google Scholar]; b Abragam A. Principles of nuclear magnetism. Oxford University Press; Oxford: 1983. [Google Scholar]
- 42.Massi F, Johnson E, Wang C, Rance M, Palmer AG., III J. Am. Chem. Soc. 2004;126:2247–2256. doi: 10.1021/ja038721w. [DOI] [PubMed] [Google Scholar]
- 43.Press WH, Teukolsky SA, Vetterling WT. Numerical Recipes in C and C. Cambridge Univ Press; UK: 1988. [Google Scholar]
Associated Data
This section collects any data citations, data availability statements, or supplementary materials included in this article.