

Abstract
Fragile X Syndrome (FXS) and the Fmr1 knockout (KO) mouse model of this disorder exhibit abnormal dendritic spines in neocortex, but the degree of spine disturbances in hippocampus is not clear. The present studies tested if the mutation influences dendritic branching and spine measures for CA1 pyramidal cells in Fmr1 KO and wild-type (WT) mice provided standard or enriched environment (EE) housing. Automated measures from 3D reconstructions of green fluorescent protein (GFP)-labeled cells showed that spine head volumes were ∼40% lower in KOs when compared with WTs in both housing conditions. With standard housing, average spine length was greater in KOs versus WTs but there was no genotype difference in dendritic branching, numbers of spines, or spine length distribution. However, with EE rearing, significant effects of genotype emerged including greater dendritic branching in WTs, greater spine density in KOs, and greater numbers of short thin spines in KOs when compared with WTs. Thus, EE rearing revealed greater effects of the Fmr1 mutation on hippocampal pyramidal cell morphology than was evident with standard housing, suggesting that environmental enrichment allows for fuller appreciation of the impact of the mutation and better representation of abnormalities likely to be present in human FXS.
Keywords: 3D reconstruction, dendritic spine, enriched environment, fragile x syndrome, hippocampus
Introduction
Fragile X syndrome (FXS) is the most common form of inherited mental retardation. It is mainly caused by an expansion of CGG repeats in the Fmr1 gene that encodes Fragile X Mental Retardation Protein (FMRP); the expansion leads to hypermethylation that blocks FMRP expression thereby resulting in the disorder (Penagarikano et al. 2007). FMRP regulates protein synthesis within dendritic spines and its absence results in abnormal levels of a number of synaptic proteins (Todd et al. 2003; Zalfa et al. 2003; Muddashetty et al. 2007; Schütt et al. 2009; Chen et al. 2010). Micelacking FMRP due to knockout (KO) of Fmr1 expression exhibit many features of human FXS including impaired learning (Consortium TD-BFX 1994; D'Hooge et al. 1997; Ventura et al. 2004; Zhao et al. 2005; Brennan et al. 2006), greater impulsivity (Moon et al. 2006), and a predisposition to seizure (Musumeci et al. 2000; Chen and Toth 2001; Yan et al. 2004). The Fmr1 KOs also have deficits in long-term potentiation (LTP), a form of synaptic plasticity thought to underlie learning and memory, in both hippocampus (Lauterborn et al. 2007; Hu et al. 2008; Shang et al. 2009; Lee et al. 2011; Yun and Trommer 2011) and cortex (Li et al. 2002; Larson et al. 2005; Zhao et al. 2005; Meredith et al. 2007). Interestingly, there is evidence that rearing environment influences the effect of the Fmr1 mutation on LTP: KO mice reared in an enriched environment (EE) reportedly have normal cortical potentiation, comparable to levels seen in wild-type (WT) mice housed in standard cages (Meredith et al. 2007). This suggests that environmental enrichment might reverse or offset cellular disturbances underlying impairments in synaptic plasticity and learning in the mutants and in human FXS.
A well-described, characteristic feature of FXS is the presence of “immature” appearing dendritic spines in neocortex. Specifically, pyramidal cell dendritic spines are more numerous, with a greater proportion being long and thin, than in cognitively normal individuals (Rudelli et al. 1985; Hinton et al. 1991; Irwin et al. 2001). As spines are thought to be the site of functional changes that mediate memory storage, an immature or otherwise aberrant morphology could represent the critical effect of the FXS mutation that underlies learning impairments. Similar to the human condition, Fmr1 KO mice exhibit abnormally high numbers of long-thin spines and greater spine densities within neocortex (Comery et al. 1997; Galvez and Greenough 2005; McKinney et al. 2005; Hayashi et al. 2007; Su et al. 2011). By comparison, spine profiles within human FXS hippocampus have not been described and results are mixed regarding the morphological differences between Fmr1 KO and WT hippocampal pyramidal neurons (Braun and Segal 2000; Segal et al. 2003; Grossman et al. 2006; Bilousova et al. 2009; Levenga, de Vrij, et al. 2011; Su et al. 2011; Swanger et al. 2011; He and Portera-Cailliau 2012; Pop et al. 2012). One study using a morphological classification scheme to characterize spine types concluded that in adult hippocampus the Fmr1 KOs exhibit more stubby or mushroom-shaped spines than do WTs (Grossman et al. 2006), whereas another study found that measures of spine head area were smaller in KO when compared with WT hippocampal neurons at 7 days of age (Bilousova et al. 2009).
Because the hippocampus is responsible for new declarative memory formation, one would expect that cellular abnormalities underlying impairments in encoding would be readily evident in this structure. Therefore, a major goal of this study was to use 3D reconstructions and automated size measures to characterize spine abnormalities in hippocampus of adult Fmr1 KO mice. Using miceexpressing GFP in scattered hippocampal neurons, confocal imaging and 3D reconstructions of field CA1 apical dendrites, we assessed 1) dendritic branching, and 2) the densities and morphometric measures of spines on secondary dendrites. With an interest in the prospect that rearing in an EE might normalize spine morphologies and, as a consequence, synaptic plasticity in the KOs (Restivo et al. 2005; Meredith et al. 2007), we also evaluated dendrite and spine measures for mice reared in standard laboratory cages versus an EE. The analyses revealed only modest differences between hippocampal spine measures for Fmr1 KO and WT mice provided standard housing with the exception of spine head volumes which were reliably lower in the mutants. Rearing in the EE did not attenuate this difference; rather, it revealed greater effects of the FXS mutation on dendritic arbors and spines of adult hippocampal neurons.
Materials and Methods
All experiments were carried out in using protocols approved by the Institutional Animal Care and Use Committee at the University of California at Irvine, and consistent with National Institutes of Health guidelines. Fmr1 KOs on the C57BL/6 background were crossed with C57BL/6 mice expressing GFP under the Thy1 promoter in scattered neurons (i.e., the GFP-M line (Feng et al. 2000)). Mice were genotyped, and male Fmr1 KOs and WTs expressing the GFP transgene were used.
Enriched Environment
At postnatal day 21, male Fmr1 KOGFP and WTGFP mice were placed in EE housing 5 per cage by genotype. The EE consisted of one large (53 × 30 × 20 cm) and one medium-sized (44 × 25 × 20 cm) rodent cage that were connected by a tube allowing for passage between the 2 “rooms,” each with ground corncob bedding. The larger cage had a habit trail system, small toys, food, and water. The medium-sized cage had a running wheel, small tubes, and small chew toys. Mice were continuously housed in this EE from the time of weaning. At 3 months of age, all EE animals were killed with an overdose of Euthasol (Western Medical Supply) and then intracardially perfused with 4% paraformaldehyde in 0.1 M phosphate buffer (PB) along with age- and sex-matched KOGFP and WTGFP mice that had been group-housed in standard mouse cages (45 × 17 × 13.5 cm) containing bedding, food, and water (standard housing, or SH). Tissue was cryoprotected for 2 days in 20% sucrose/4% paraformaldehyde, frozen, and stored at −80 °C.
Immunocytochemistry and Microscopy
Coronal sections (40–50 µm) through the hippocampus were prepared on a freezing microtome and processed for the immunofluorescence localization of GFP to enhance labeling of spine profiles. The free-floating tissue sections were incubated in chicken anti-GFP (1:1000; Abcam #ab13970) in PB containing 0.3% triton-X 100 and 4% bovine serum albumin overnight at room temperature. Following rinses in PB, tissue was incubated with Alexafluor488 anti-chicken IgG (1:1000; Invitrogen) for 1 h, rinsed, mounted onto slides, and coverslipped with Vectashield (Vector Laboratories).
Image z-stacks of GFP-labeled field CA1 pyramidal cells, and their apical dendrites, were collected using a Zeiss 510 confocal microscope and a 63 × 1.4 NA objective. For apical dendrite analyses, image z-stacks were collected with 1 µm steps through the target dendrite and with minimal zoom to capture a broad dendritic span (Fig. 1A). For spine analyses, images were collected from secondary dendrites in the apical field using 0.13-µm step spacing which is the Nyquist rate for the objective used (Fig. 1B). To minimize variations in spine measures reflecting distance from the cell body, images were collected from the most proximal secondary dendrites (i.e., the first or second relative to the cell soma): each z-stack included the first 90–100 µm of the secondary dendrite from the point of emergence from the primary apical dendrite. Image stacks were deconvolved using AutoQuant Version 2.2.1 (Media Cybernetics), and then 3D builds were made using Imaris software Version 7.0.0 and the Filament Tracing module (Bitplane).
Figure 1.
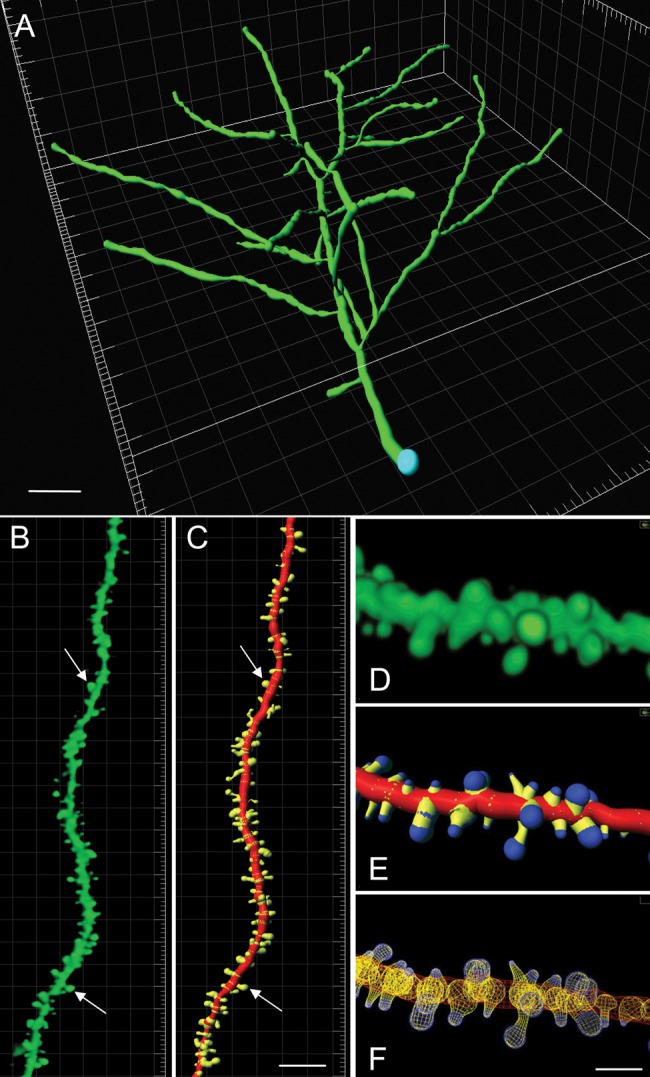
3D reconstruction of GFP-labeled dendrites and spines from confocal image z-stacks. (A) Tilted image shows the volumetric Imaris build of a representative dendritic tree used to identify branch levels. Panels B and C show a deconvolved image of a GFP-labeled, pyramidal cell secondary dendrite (B) and the 3D build of the same dendrite using Imaris (C). In C, the dendritic shaft is shown in red and the spines are shown in yellow. Arrows indicate the same spines in B and C. (D–F) Photographs of one GFP-labeled dendritic segment shown in different views generated in Imaris: (D) Volumetric rendering of the deconvolved image; (E) 3D rendering with color coding of different elements in the dendritic reconstruction: shaft (red), spine necks (yellow), and spine heads (blue); and (F) wire mesh form. Additional images of GFP-labeled dendrites from each experimental group are presented in Supplementary Figure 1. Scale bars: 15 μm (A), 10 μm (B and C), and 2 μm (D–F).
Dendrite Branching Analysis
The branching of GFP-labeled dendrites was measured using Imaris' automated Sholl (1953) analysis that quantifies the number of intersections between dendritic branches and concentric Sholl rings placed at even distances from the cell body. Numbers of branches and total dendritic lengths for secondary and tertiary dendrites were also determined using Imaris' automated Dendrite Branch Level analysis. The branch level was assessed according to diameter calculations of the individual dendrite segments at each branching point; thus, at each branching point the dendritic segment with the smaller mean diameter was assigned the higher order branch level. For each data point, measures were determined for each cell and then the individual cell values were averaged to determine mean values per animal.
Spine Measures
The 3D renderings of individual dendrites were prepared as illustrated in Figure 1. The automatic seed point detector function in Imaris, which uses thresholding of labeling intensity to demarcate labeled structures, and incorporates a Mexican Hat Filter to eliminate background and enhance object detection, was used to identify spines and define both heads and necks. Spine length was defined as the sum of the radius of the spine terminal point (i.e., the center of the head to the tip) and spine segment (or “neck”) length extending from the head to the point of attachment on the dendrite. The maximum spine length and minimum spine end diameter were set to 5 and 0.2 µm, respectively; objects that did not fit within these size constraints were excluded from analysis. A recent study using Imaris and these same parameters to generate automated measures of hippocampal spines demonstrated, in a side-by-side comparison with manual measures, that this automated method yielded more precise data for spine heads, necks, and length (i.e., less variability), and better accuracy relative to estimated population statistics based on ultrastructural data (Swanger et al. 2011). Automated measures of the lengths and head volumes for spines, and the numbers of spines per dendritic span, were generated from the 3D renderings and data were exported to Excel (Microsoft). An in-house Matlab (Mathworks) script was used to bin measures for each 10 µm span of the target dendrites. Measures of spine head volume versus spine length were plotted using SigmaPlot Version 11.0 (Systat Software, Inc.); for these analyses, spine measures for each experimental group were expressed as a percent of the total population of spines for that same group, to control for differences in the number of spines evaluated for each genotype and treatment. In total, numbers of spines analyzed were 5180 for standard housed WTs (n = 5 mice), 2815 for standard housed KOs (n = 3 mice), 4150 for enriched housed WTs (n = 3 mice), and 3284 for enriched housed KOs (n = 3 mice); counts were obtained from 35, 18, 24, and 20 dendrites per group, respectively, with an average of 7 ± 2 dendrites analyzed per animal. Whereas numbers of dendrites analyzed were comparable for 3 of the groups, a greater number of dendrites were imaged for one standard housed WT mouse as we set up initial analyses parameters and methods that were subsequently used for all dendrites. Beyond this initial case, analyses of all other brains were conducted blind to genotype/condition.
A subtractive analysis was performed on some datasets to determine the degree to which 2 groups differed on specific spine measures. For these analyses, results for an individual group were first expressed as a percent of the total population for that group. Then, for the 2 groups being compared, the spine-profile populations that overlapped between the 2 groups were subtracted leaving the nonoverlapping, or “unique,” population for each group in the comparison.
Statistical Analysis
To compare the effect of 2 variables (e.g., genotype and housing), a 2-way ANOVA was used, followed by post hoc comparisons of all groups in Prism 5.0 (GraphPad Software, Inc.); post hoc comparisons are presented for some analyses to show the source of significance between data groups. Best-fit curve analyses for spine head volume and length measures were done using Minitab version 16.1.0 (Minitab, Inc.). For these analyses, each dendrite was assessed separately for a “best” fit distribution using the Anderson-Darling goodness of fit test (Anderson and Darling 1952) which determines if the sample (all spines per dendrite) fits the 95% confidence interval of the following distributions: normal, lognormal, 3-parameter lognormal, exponential, 2-parameter exponential, Weibull, 3-parameter Weibull, smallest extreme value, largest extreme value, gamma, 3-parameter gamma, logistic, log logistic, and 3-parameter log logistic. After a best-fit was identified for each dendrite, the overall best-fit for each group was determined based on which distribution was consistently fit for >50% of the dendrites. Thus, if over 50% of the dendrites had a Weibull distribution of spine measures, then this distribution was assigned to the animal group as the overall best-fit. However, if more than one curve met this criteria then the curve with the lowest (i.e., more significant) Anderson–Darling value was used. Where appropriate, the calculated kurtosis and shape values for each dendrite's curve were averaged to generate an individual animal's mean and then group means were compared.
Results
EE Increases Dendritic Arborization
The effects of genotype and housing on apical dendritic arbors of CA1 pyramidal cells were evaluated using Sholl concentric ring and Dendrite Branch Level analyses. For neurons from mice reared in standard group housing (SH) for the 2 months post-weaning, the number of dendritic intersections with Sholl rings, the number of dendritic branches, and total lengths of secondary and tertiary dendritic branches, were similar between genotypes (P > 0.05, for all measures) (Fig. 2). For WT mice, housing in the EE modestly increased numbers of Sholl intersections (Fig. 2A) but significantly increased numbers of tertiary dendritic branches (P < 0.001 for EE vs. SH groups) (Fig. 2B). By contrast, EE housing did not significantly influence these measures of pyramidal cells from Fmr1 KO mice. Finally, the length of tertiary dendrites was greater in EE than in SH mice for both genotypes (P < 0.01 and 0.05 for WTs and KOs, respectively) (Fig. 2C); this effect was selective for tertiary dendrites as numbers and lengths of secondary dendrites were comparable across groups (Fig. 2B,C). Overall, due to greater effect of housing environment on the WT mice, placement in the EE revealed effects of genotype on dendritic arbors that were not evident for mice given standard housing.
Figure 2.

Environment enrichment influences measures of dendritic branching. Measures were collected from 3D reconstructions of CA1 pyramidal cells: 22 neurons were analyzed for WT standard housing (SH), 36 for KO SH, 23 for WT-enriched environment (EE), and 18 for KO EE groups (n = 3 mice per group). (A) Plot shows the average (±SEM) number of intersections of dendritic segments with the Sholl rings for neurons in the 4 groups: intersections were somewhat greater in WT mice reared in the EE when compared with SH (P = 0.0553 for animal group (trend) and P < 0.0001 for intersections, repeated measures 2-way ANOVA). (B and C) Bar graphs show the average number (B) and length (C) of secondary and tertiary dendritic branches for neurons in the 4 groups. There was a significant effect of housing on each measure of tertiary dendrites (P < 0.001, 2-way ANOVA for each measure): with EE housing, there was greater branching and dendritic length in both genotypes (***P < 0.001, **P < 0.01, *P < 0.05 vs. same genotype SH group). There were no significant effects of genotype on these dendritic measures for mice reared in the same environment (e.g., WT SH vs. KO SH).
Rearing Effects on Spine Density
The analysis of dendritic spines focused on secondary dendrites to avoid potential confounds arising from changes in the structure of higher order dendritic branches. To simplify presentation of the results, the term “spine” is used throughout to describe all protrusions extending at least 0.2 µm off of the dendritic shaft, regardless of morphological features.
The numbers of spines were quantified for 10 µm bins across an 80-µm span of the secondary dendrites. As shown in Figure 3A, there was no effect of genotype on the incidence or distribution of spines across these bins for mice in standard housing. For EE-housed mice, there was a small, but significant, effect of genotype on spine density (P = 0.0252, 2-way ANOVA) with Fmr1 KOs displaying somewhat greater numbers of spines in more distal bins than the WTs (Fig. 3B). As with the dendritic analysis, the presence of differences in spine numbers between genotypes for EE-housed mice reflected a greater influence of housing on WT measures: for the full dendritic span evaluated, there was a trend for effect of housing in WT mice (WT SH vs. WT EE; P = 0.0627, 2-way ANOVA) but not in Fmr1 KOs (KO SH vs. KO EE: P = 0.4279, 2-way ANOVA).
Figure 3.

Enriched environment housing leads to somewhat greater numbers of spines on secondary dendrites for Fmr1 KO mice. Bar graphs show the mean (±SEM) number of spines for 10 µm bins of secondary dendrites (bin #1 being closest to the apical dendritic shaft) for Fmr1 KO and WT mice reared in the enriched environment (EE) or Standard Housing (SH) for 2 months postweaning (n = 5 for WT SH, and 3 for KO SH, WT EE, and KO EE groups). (A) There was no effect of genotype on spine counts for mice with SH. (B) With EE housing, the Fmr1 KO mice exhibited greater numbers of spines at further distances from the apical dendrite when compared with the WTs (P = 0.0252, 2-way ANOVA).
Spine Head Volumes Are Smaller in KOs
To evaluate effects of genotype and housing environment on spine morphology, we measured the length and head volume for spines on secondary dendrites of field CA1 pyramidal cells. The Fmr1 KOs had significantly smaller spine head volumes than did the WTs for both housing conditions (P < 0.0001 for effect of genotype, 2-way ANOVA): for KOs, the mean spine head volume was 40.7% and 42.6% lower than in WTs for SH and EE groups, respectively (Fig. 4A,B).
Figure 4.

Spine head volumes are smaller in Fmr1 KO mice in both housing conditions. Bar graphs show spine head volumes (A and B) and spine lengths (C and D) for field CA1 secondary dendrites from WT and Fmr1 KO mice reared in standard housing (SH) or the enriched environment (EE). Data are mean (±SEM) values binned for every 10 µm across 80 µm of each dendrite's length. (A and B) Fmr1 KOs had significantly smaller head volumes when compared with WTs for mice reared in both SH (A) and EE (B) (P < 0.0001 for effect of genotype in each housing condition, 2-way ANOVA). C and D) Average spine lengths were significantly different between genotypes in SH (P < 0.0183 for effect of genotype, 2-way ANOVA) (C) but similar between genotypes reared in the EE (P < 0.6042, 2-way ANOVA). (n = 5 for WT SH, 3 for KO SH, WT EE, and KO EE groups).
Average spine length was significantly different between genotypes housed under standard conditions (P < 0.0183 for effect of genotype, 2-way ANOVA), with KO spines exhibiting greater lengths than WT spines (Fig. 4C). However, there was no effect of genotype in EE-reared animals (Fig. 4D); of note, while spines situated closer to the primary apical dendrite (bins 1 and 2) were somewhat shorter for mice raised in the EE (Fig. 4D) when compared with SH (Fig. 4C), this effect was not statistically significant [so, this is one measure “normalized” in the KOs by EE].
Best-Fit Curve Analyses of Spine Measures
The preceding analyses demonstrated marked effects of genotype on spine head volume but did not provide information on the distribution of spines with different measures across individual dendrites in the various groups. To address this issue, we conducted a best-fit curve analyses for head volumes and lengths of spines on individual dendrites, using the Anderson–Darling goodness of fit test (Anderson and Darling 1952). To determine the “best-fit” curve for each experimental group, 2 criteria were used in sequence: 1) measures from >50% of the dendrites in each group had to be fit to a curve, and 2) if more than one curve met this criteria then the curve with the lowest (i.e., more significant) Anderson–Darling value was used.
The best-fit analyses for spine head volumes revealed both differences between genotypes within a given housing condition, and an effect of housing for each genotype. For WT mice reared in SH, the majority (71.4%) of dendrites had spine head volumes that fit a gamma distribution (Fig. 5A). In contrast, measures from Fmr1 KOs in SH did not fit just one distribution: one-third fit either a gamma or 3-parameter Weibull distribution whereas the rest did not fit any distribution. Rearing in the EE altered the best-fit curves for head volume in both genotypes: for WT EE mice, the majority (70.8%) of dendrites had spine head volumes that fit a Weibull distribution, whereas for KO EE mice, the majority (75%) fit a gamma distribution (Fig. 5A).
Figure 5.

Best-fit distributions of spine head volume and length reveal genotype-specific responses to the housing environment. (A) Line graph shows best fit distributions for spine head volumes on individual dendrites in WT SH, WT EE, and KO EE groups; the KO SH are not plotted because there was no one best-fit for this group. The WT SH and KO EE groups have gamma distributions whereas the WT EE group has a Weibull distribution. Bar graph at left shows mean (±SEM) kurtosis values for the group distributions: The KO EE spines had higher kurtosis values than did the WT EE group (t, trending: P = 0.0541). (B) Plots show best-fit distributions for individual dendrite spine lengths for WT and KO mice reared in standard housing (top) and the EE (bottom). The distributions for the 2 genotypes in SH are nearly identical, whereas the EE lead to a leftward shift in the peak of the WT distribution relative to that of the Fmr1 KOs; all curves are 3-parameter Weibulls. (C) Bar graphs show group mean (±SEM) kurtosis and shape values for best fit spine length distributions: EE housing revealed significant effects of genotype for both measures (*P < 0.05, **P < 0.01). Shape values (4C, right) were also significantly different for the WT EE and WT SH groups (P < 0.05). The number of dendrites analyzed were 35 for WT SH (n = 5 mice), 18 for KO SH (n = 3), 24 for WT EE (n = 3), and 20 KO EE (n = 3), with 6–8 dendrites per mouse.
The best-fit distribution for KO EE mice differed from both WT groups in having a greater proportion of spines with small head volumes (Fig. 5A). To test the significance of this difference, kurtosis values (i.e., measures of “peakedness”) of the fit-distributions for individual dendrites were averaged to calculate individual animal means, and then group mean values were compared. As expected, the KO EE group exhibited higher kurtosis values than did either WT group but this only approached significance for the KO EE versus WT EE comparison (P = 0.0541, Student's t-test).
The analyses of spine length distribution determined that the 3-parameter Weibull provided the best fit for dendrites in all 4 groups, although the percentage of dendrites fitting this curve varied: 88% for WT SH, 66% for KO SH, 62.5% for WT EE, and 80% for KO EE. As shown in Figure 5B, the best-fit distributions for spine lengths were nearly identical for the 2 genotypes in SH, but differed with housing in the EE. Notably, for EE mice, the WT distribution was left-shifted (toward smaller lengths) relative to that for the Fmr1 KOs. Analyses of each dendrite's best-fit curve for spine length confirmed this observation. Average kurtosis values were greater for WTs than for KOs, and this difference was significant after rearing in the EE. Finally, Weibull distributions can be defined by the parameters of shape, scale, and threshold: a shape value of 3 indicates a near normal distribution whereas much lower or higher values (e.g., 1 or 10) indicate a right or left skew, respectively. As shown in Figure 5C, among groups the WTs reared in the EE had the lowest shape value indicating that exposure to the more complex environment increased the rightward skew in the spine length distribution of the WTs but not the mutants.
Housing and Genotype Effects on Spine Morphology Distributions
To identify differences in spine morphology between groups, we considered both head volume and length together for each spine. Specifically, for each group, 3D density plots (spine length vs. head volume) were generated (Fig. 6A–D). All 4 groups had similar spine distributions with the majority of spines in each group having head volumes of ≤0.1 µm3 and lengths of ≤1 µm. However, analysis of spine measures on a “per animal” basis demonstrated a significant effect of genotype. In particular, for each mouse, we determined the percent of the spine population with measures placing that element in 1 of the 4 zones enumerated in Figure 6D. There were no group differences in the proportion of spines within zones 1 and 4 (Fig. 6E). However, the Fmr1 KOs housed in the EE had more short and narrow spines (zone 2) than did the other groups, and fewer spines with large head volume (zone 3) than WT mice with the same housing.
Figure 6.

Housing in an enriched environment increases effects of genotype on spine size measures. (A–D) Histograms show spine population distributions for WT SH (A), KO SH (B), WT EE (C) and KO EE (D) groups; for comparison between groups and to control for differences in absolute numbers of spines between groups, data from all animals in each group were combined and normalized to 100% of the population. Four zones were delineated in each graph as identified by bold lines marking a head volume boundary at 0.1 µm3 and a length boundary at 1.0 µm (D). Note that in general the distributions are very similar across groups, although the KO groups tend to have a higher proportion of spines in zone 2. (E) Bar graph shows quantification of the proportion of spines in zones 1–4 on a per animal (±SEM) basis for each group (n = 5 for WT SH, and 3 for all other groups): For zones 2–4, 2-way ANOVA revealed significant effects of genotype: P = 0.0129, zone 2; P = 0.009, zone 3; P = 0.045, zone 4. Post hoc comparisons were done between genotypes in each rearing condition, and for each genotype across housing conditions. As shown, KO EE mice had greater numbers of spines in zone 2 than either WT EE or KO SH groups (*P < 0.05, Student's t-test), and fewer spines in zone 3 than WT EEs (**P < 0.01, Student's t-test).
To further isolate differences between groups, we used a subtractive method: spines with measures that were shared between 2 groups (e.g., the same volume and length measures for WT SH and KO SH groups) were subtracted leaving the nonoverlapping, or “unique,” populations for a given group in the comparison. These unique spine populations represented ∼16–20% of the total for each group depending on the comparison (Table 1). Using this approach, we first evaluated the effects of housing on spine distributions within a genotype. As show in Figure 7A, and summarized in the top paired comparisons in Table 1, WT mice reared in either housing condition had nonoverlapping populations of spines that predominantly had head volumes of ≤0.1 µm3 and lengths of ≤1 µm. However, for the WTs, housing in the EE increased the incidence of short spines with larger head volumes (zone 3). The effect of EE was different for Fmr1 KOs. Mutants given SH exhibited greater numbers of nonoverlapping spines with narrow heads (≤0.1 µm3) but with lengths ranging up to 2 µm (Fig. 7B, left) thereby extending well into zone 1. In contrast, for KOs housed in the EE unique spines were both narrow (≤0.1 µm3) and short (≤1 µm long) (Fig. 7B, right) and thus clustered within zone 2 (Table 1). In contrast to EE effects on the WTs, increases in spines with large heads were not evident in the mutants [it seems the KO change also reflects a shortening of spines with EE, as described for the earlier spine length measure].
Table 1.
Subtractive analysis demonstrates effects of housing and genotype on composite spine measures
| Groups | Total% | % Each subdivision |
|||
|---|---|---|---|---|---|
| Zone 1 sl > 1.0 shv < 0.1 |
Zone 2 sl ≤ 1.0 shv < 0.1 |
Zone 3 sl ≤ 1.0 shv ≥ 0.1 |
Zone 4 sl > 1.0 shv ≥ 0.1 |
||
| WT SH | 16.25 | 3.98 | 8.83 | 2.36 | 1.08 |
| WT EE | 16.00 | 2.62 | 7.77 | 4.52 | 1.09 |
| Diff. | −1.36 | −1.06 | +2.16 | +0.01 | |
| KO SH | 16.53 | 6.16 | 6.54 | 3.22 | 0.62 |
| KO EE | 15.73 | 1.46 | 12.43 | 1.38 | 0.46 |
| Diff. | −4.70 | +5.89 | −1.84 | −0.16 | |
| WT SH | 18.03 | 2.51 | 5.95 | 7.66 | 1.91 |
| KO SH | 18.14 | 5.56 | 11.52 | 0.72 | 0.34 |
| Diff. | +3.05 | +5.57 | −6.94 | −1.57 | |
| WT EE | 20.52 | 2.92 | 4.20 | 11.52 | 1.89 |
| KO EE | 20.08 | 2.62 | 16.72 | 0.58 | 0.16 |
| Diff. | −0.30 | +12.52 | −10.94 | −1.73 | |
Note: The “Total %” is the overall percent of nonoverlapping spines for each group in each of the 4 paired comparisons; columns to the right of this indicate the % of nonoverlapping spines within each of the zones identified in Figure 6D and 7A. The difference (Diff.) values were generated by subtracting SH from EE values for the top 2 comparisons, and subtracting WT from KO values for the second 2 comparisons; bold numbers indicate a difference >4% of the total. sl, spine length (μm); shv, spine head volume (μm3).
Figure 7.

Subtraction analysis shows effects of housing and genotype on the physical proportions of dendritic spines. Histograms showing the differences in unique spine populations between housing conditions for each genotype (A and B) and for each genotype under the different housing conditions (C and D). For each pair-comparison, the overlapping distributions were subtracted away leaving only the spine population that is unique to each condition plotted. The 4 size zones, identified in A (left) are defined by boundaries at 1 μm3 head volume and 1 μm spine length (bold lines). (A) The distributions of nonoverlapping spines for WT SH and WT EE groups were similar although the EE group had fewer long-thin spines (zone 1) and spines with larger head volumes (zone 3; see Table 1 for values). (B) For the KOs, housing in the EE reduced the scatter in spine head volume and length, relative to profiles from SH mice thereby increasing the proportion of nonoverlapping spines that were both short and narrow (zone 2). (C) Population distributions show clear effects of genotype in both housing conditions. With SH, nonoverlapping spines for the WTs are clustered in zones 2 and 3 whereas for the KOs they are clustered in zones 1 and 2 and have particularly small head volume. (D) The nonoverlapping spines for WT and KO mice in the EE are similar to that seen after SH (compare to panel C) although for the WTs fewer spines have very small heads (≤0.05 μm3) and for the KOs unique spines are less numerous in zone 1. See Table 1 for further zone analyses.
The subtractive analysis also was used to evaluate the effect of genotype on spine measures for mice reared in the same housing condition. With SH, nonoverlapping spines in the KOs had very narrow heads (largely ≤0.05 µm) but variable lengths thus distributing across zones 2 and 1 whereas those in the WTs extended across all 4 zones with greatest numbers in zones 2 and 3 (Fig. 7C; Table 1). The zone distributions of nonoverlapping spines were similar for mice housed in the EE: for WTs, they were distributed across all 4 zones with greatest numbers in zones 2 and 3 whereas, in the KOs, they were clustered in zone 2 and, to lesser extent, zone 1 (Fig. 7D; Table 1).
Discussion
The present studies demonstrate that there are consistent effects of genotype and housing on the dendritic arbors and spines of CA1 pyramidal cells in the Fmr1 KO model of Fragile X. Measures from 3D reconstructions of spines on secondary apical dendrites showed that spine head volume is reliably smaller in the mutants, independent of housing condition. Importantly, and in contrast to expectations from prior analyses of neocortical neurons (Restivo et al. 2005), housing in the EE had greatest effects on measures of hippocampal neurons in WT mice when compared with Fmr1 KOs and thus increased the differences between genotypes for several of the dendrite and spine measures. While effects of EE have been investigated in a number of models of behavioral or learning dysfunction and most report positive effects of enrichment on dendrite or spine measures (Turner et al. 2003; Parsley et al. 2007; Fréchette et al. 2009; Goshen et al. 2009; Zhu et al. 2009), others do not (Dierssen et al. 2003; Nithianantharajah et al. 2009). In particular, similar observations of blunted responses to environmental enrichment on dendritic branching and spine measures have been reported for the Ts65Dn mouse model of Down syndrome (Dierssen et al. 2003), a developmental intellectual disability disorder that, like Fragile X, is characterized by abnormal spines although the exact nature of spine defects differ between disorders. Notably, spine density on cortical neurons is reportedly greater in Fragile X (Irwin et al. 2001) but reduced in Down syndrome (Marin-Padilla 1976; Suetsugu and Mehraein 1980; Takashima et al. 1981; Ferrer and Gullotta 1990) when compared with control human cases. Thus, for the Ts65Dn mice, rearing in an EE did not elicit increases in dendritic branching or spine density displayed by neocortical pyramidal cells in WT mice (Dierssen et al. 2003). Collectively, these findings suggest that mechanisms controlling structural changes in pyramidal cells in response to environment stimuli are not properly engaged in at least 2 congenital intellectual disability disorders.
Effects on Dendritic Branching
Rearing genetically normal animals in an EE is known to increase dendritic arborizations of cerebellar, neocortical, and hippocampal neurons (Volkmar and Greenough 1972; Greenough et al. 1973; Faherty et al. 2003; Kozorovitskiy et al. 2005; Leggio et al. 2005; De Bartolo et al. 2011). It also increases brain-derived neurotrophic factor expression (Ickes et al. 2000; Franklin et al. 2006; Angelucci et al. 2009; Kazlauckas et al. 2011; Kuzumaki et al. 2011) and neurogenesis (Kempermann et al. 1997; Nilsson et al. 1999) which likely contribute to the changes in dendritic architecture. In line with this, we found that in WT mice rearing in an EE increased field CA1 apical dendritic branching as determined by numbers of tertiary dendritic branches; this effect was absent in the mutants. For both genotypes, tertiary dendrites were longer with 2 months in the EE when compared with SH. The consequences of these changes in tertiary branches to CA1 pyramidal neurons are likely to be seen at the level of signal integration. Strong stimulation of first or second order pyramidal cell dendritic branches reliably elicits action potentials whereas the same stimulation applied to higher order terminal dendritic segments reportedly elicits a shift from graded (with lesser stimulation) to all-or-none responses that are still subthreshold for triggering somatic action potentials (Wei et al. 2001). This feature of distal dendrites allows the cells to have multiple signal processing capabilities including both linear and nonlinear operations. Importantly, the amplitude of the terminal dendritic all-or-none response has been suggested to reflect both the physical dimensions of these dendritic segments and their number of voltage-gated channels (Wei et al. 2001). These findings suggest that EE effects on third-order branch lengths described here would be likely to alter local responses to intense afferent activity and, therefore, the processing power of distal dendritic arbors.
Our results show that although environmental enrichment influences the dendritic arbors of hippocampal neurons of both genotypes, it has lesser effect in Fmr1 KO when compared with WT mice. A previous study of effects of housing environment on layer V occipital cortical neurons led to a different conclusion. That study found no effect of the Fmr1 KO genotype or environmental enrichment on apical dendrites (Restivo et al. 2005). Rather, 2 months in an EE increased basal dendritic branching in both Fmr1 KO and WT mice but to greater extent in the KOs thereby eliminating the effects of genotype on this measure (Restivo et al. 2005). Although the enrichment paradigm in the cortical study was somewhat different from that used here (i.e., in the former, mice were intermittently exposed to novel environments in addition to enriched housing), differences in the nature of structural responses to enrichment in the 2 works likely reflect the specific neuronal populations evaluated. Relevant to this point, cortical neurons in different fields and layers have been shown to have distinct EE-induced changes in dendritic branching, including differences between effects in apical and basal fields (Gelfo et al. 2009). Moreover, other features of the mutant phenotype (e.g., a greater response to stress) might limit effects of environmental enrichment on hippocampal neurons as discussed below.
Hippocampal Spine Abnormalities are Modest for KOs Raised in Standard Housing
Studies of neocortical pyramidal cells reliably find dendritic spine abnormalities in Fmr1 KOs. Typically, cortical spines are described as being more numerous, and both longer and thinner, in KOs than in WTs (Comery et al. 1997; Galvez and Greenough 2005; McKinney et al. 2005; Hayashi et al. 2007; Su et al. 2011), with the latter morphological features inviting speculation that the KO profile includes spines that are relatively immature. Similarly “immature” spines are not consistently described for hippocampal pyramidal cells in the KOs, and reported effects of genotype on numbers of spines for hippocampal neurons are mixed (Braun and Segal 2000; Segal et al. 2003; Grossman et al. 2006; de Vrij et al. 2008; Pfeiffer et al. 2010; Levenga, Hayashi, et al. 2011; Su et al. 2011; He and Portera-Cailliau 2012; Pop et al. 2012). Only 2 studies have evaluated spines of CA1 neurons in situ with an emphasis on head morphology. The first concluded that adult KO apical dendrites had more stubby or mushroom-shaped spines suggesting larger spine heads than in WTs (Grossman et al. 2006). The second found spine head area was smaller in 7-day old KOs when compared with WTs (Bilousova et al. 2009); spine heads were also reportedly smaller for pyramidal cells in culture (Bilousova et al. 2009; Swanger et al. 2011). Our measures of 3D reconstructions of adult secondary dendrites accord with the later study. Specifically, for adult mice reared in standard cages, the Fmr1 KOs had smaller mean spine head volumes when compared with WTs, and KO head volume distributions did not conform to the gamma profile that predominates in WTs.
In contrast to reliable effects on spine head size, we did not detect an effect of genotype on numbers of spines for mice reared in standard housing. These findings are in line with several reports that the numbers of hippocampal spines in the KOs are normal (Grossman et al. 2006; de Vrij et al. 2008; Levenga, Hayashi, et al. 2011; Su et al. 2011; Pop et al. 2012), but differ from others reporting density as being abnormally high (Gross et al. 2010; Levenga, de Vrij, et al. 2011; Swanger et al. 2011) or low (Braun and Segal 2000; Segal et al. 2003) in the mutants. In addition, although we did not detect an effect of genotype on spine length distribution, there was an effect of genotype on average spine length for mice reared in standard housing with KOs exhibiting longer spines than WTs. These findings are consistent with a recent report (Pop et al. 2012) but differ from others describing normal spine lengths on KO hippocampal neurons (Braun and Segal 2000; Segal et al. 2003; Bilousova et al. 2009). The inconsistencies across studies may reflect differences in experimental variables such as the age and environment (in vitro vs. in vivo) of the neurons evaluated, the dendritic branch order analyzed and, perhaps more importantly, methods of quantification including techniques for dendrite and spine labeling, imaging, and analysis (for further discussion, see He and Portera-Cailliau 2012; Pop et al. 2012). While most studies, including the present work, have used labeling methods that appear to randomly label neurons (e.g., Golgi staining, DiOlistic labeling, etc.), it is possible that the sampled populations of neurons differ between studies even for the same hippocampal subfield. Finally, regarding analytical techniques, it is noteworthy that the present study is the first to measure hippocampal spines in adult Fmr1 KO and WT mice using a standardized computer-based approach that was shown to have a higher degree of precision and accuracy for spine measures than manual quantification (Swanger et al. 2011).
Rearing in an Enriched Environment Revealed Effects of Genotype on Spine Measures
As noted, EE rearing resulted in more pronounced effects of genotype on field CA1 spine measures than did standard housing. Average spine counts were higher in mutants than in WTs for EE rearing groups only. Moreover, there were differential effects of housing on spine size measures. This was not evident for “average group measures” of spine head volume; KOs reared in both housing conditions had smaller mean spine head volumes when compared with WTs. However, differential responses to housing became evident as curves that best-fit spine length and head volume distributions were identified. Among mice reared in the EE, best-fit distributions for lengths of spines on individual dendrites revealed a leftward shift of central tendencies, toward smaller lengths, and significant effects on kurtosis and shape values that were limited to the WTs. These effects of EE on the WTs gave rise to differences between the genotypes that were not evident for mice reared in standard cages. Best-fit curves also revealed differential effects of housing on head volume distributions in the 2 genotypes. WT spine head measures conformed to a gamma distribution with SH and to a Weibull distribution with EE housing. For KOs reared in SH, head volume distributions did not conform to one particular curve whereas those reared in the EE had spine heads that fit a gamma profile with significantly greater kurtosis, in the small head range, than was evident for WTs in either housing condition.
In an effort to integrate spine length and head volume distribution results, we constructed 3D plots that further highlighted effects of genotype and housing on spine population distributions. For animals raised in the EE, the KOs had a greater proportion of spines in our Zone 2 and less in Zone 3 when compared with WTs indicating that for short spines (<1 µm in length) the mutants have more with small head volumes and fewer with large head volumes. The same trends were evident for mice raised in SH but effects were not statistically significant. Subtractive analysis was then used to reveal populations of spines (defined by both length and head volume measures) that were unique to a genotype within a particular housing environment and unique to a housing environment for a particular genotype. Results of these subtractive analyses, summarized in Table 1, confirmed that the KO groups (SH and EE) exhibited more unique spines with smaller head volumes than did same-environment WTs, but that differences between genotypes were greater for mice raised in the EE. Integrating these findings with the observation that, with EE rearing, KOs had greater spine numbers than WTs, it appears that differences in spine morphology between genotypes are not influenced by the density of spines. This is an important point to consider for studies aimed at correcting spine defects in the Fmr1 KOs and in FXS. In addition, as head volume is positively correlated with postsynaptic density area (Harris and Stevens 1989; Schikorski and Stevens 1999; Arellano et al. 2007), and spines with head volumes reported here have measureable postsynaptic densities (Arellano et al. 2007), one would expect that in the KOs a greater proportion of spines have small synapses, and thus lower synaptic strength, than is the case for WTs.
The observation that EE rearing shifts spine shape distributions for both genotypes shows that environment can have marked influences across spines that are not readily apparent in total or average measures. The consequence of such changes to hippocampal synaptic function are not known although computational analyses indicate that features such as spine volume and neck size influence the degree of biochemical compartmentalization and voltage amplification within the spine head, as well as the level of cooperativity between neighboring spines (Harnett et al. 2012). Studies of EE effects on cortical neurons in the Fmr1 KOs have found that in addition to normalizing spine measures (Restivo et al. 2005) enrichment can rescue the otherwise impaired cortical LTP (Meredith et al. 2007). From the present evidence that EE housing does not normalize spine measures for KO hippocampal CA1 pyramidal cells, we anticipate that this conditioning will not correct LTP deficits observed in this same field in the mutants (Lauterborn et al. 2007; Hu et al. 2008; Shang et al. 2009; Lee et al. 2011; Yun and Trommer 2011). However, there are reasons to be cautious about this prediction. Plasticity impairments in the mutant may arise from functional abnormalities that do not reflect spine shape (e.g., receptor signaling, protein trafficking) (Hu et al. 2008; Gross et al. 2010; Sharma et al. 2010; Seese et al. 2012); housing in the EE could normalize specific protein levels and/or signaling activities and, thus, function at the synapse. Second, there is evidence that Fmr1 KO neurons have an elevated threshold for induction of stable LTP relative to WTs (Lauterborn et al. 2007; Meredith et al. 2007). It has been reported that EE rearing increases the excitability of CA1 pyramidal neurons by reducing spiking threshold and after-hyperpolarization amplitude, causing cells to fire more action potentials with LTP-inducing stimuli (Malik and Chattarji 2012). This increased excitability would be expected to augment effects of a given amount of afferent drive and thereby facilitate synaptic plasticity (Duffy et al. 2001; Artola et al. 2006; Malik and Chattarji 2012). Clearly, future studies are needed to determine if EE rearing can restore normal LTP in both hippocampus and neocortex of Fmr1 KO mice, and if so, to elucidate the mechanisms involved.
The question remains as to why Fmr1 KO cortical and hippocampal spines differ in their response to rearing conditions. It is possible that longer periods in the EE, or greater diversity in environmental conditions, may be needed to elicit structural changes in hippocampus, than in neocortex, of the mutants. Alternatively, it may be the case that factors known to have preferential effects on hippocampal as opposed to cortical neurons lead to regional differences in effects of environmental enrichment in the mutants. For example, stress hormones (e.g., glucocorticoids) act on hippocampal neurons and have direct effects on dendritic spines (Shors et al. 2001; Komatsuzaki et al. 2005; Jafari et al. 2012). Multiple studies have shown that Fmr1 KOs (Lauterborn 2004; Markham et al. 2006) and individuals with FXS (Wisbeck et al. 2000; Hessl et al. 2002) exhibit greater and more protracted glucocorticoid responses to stress than normal, suggesting the testable hypothesis that in hippocampus of Fmr1 KOs effects of environmental enrichment are countered by higher levels of these circulating hormones. As a consequence, the unopposed enrichment effects in the WTs leads to greater changes in hippocampal spine measures than is the case in the mutants.
Independent of mechanism, evidence that rearing in an EE reveals effects of genotype that are not evident when using standard housing conditions suggests that EE-reared mice should be used to anticipate the effects of reduced FMRP expression in persons with FXS. Humans with this condition, and other developmental disorders associated with autism and intellectual disability, live in a relatively complex environment with varied sensory and social input and at least modest day-to-day stressors. For mice, EE rearing is more akin to this naturalistic setting. Thus, findings from EE-reared mice may be more predictive of the human FXS condition, and useful in evaluating therapies aimed at reversing neurobiological features underlying cognitive dysfunction in this syndrome.
Supplementary Material
Supplementary material can be found at: http://www.cercor.oxfordjournals.org/.
Funding
This work was supported by the NIMH (R01 MH082042 to C.G. and J.L.) and the NINDS (P01 NS045260 to C.G.) at the National Institute of Health.
Supplementary Material
Notes
The authors thank Yue Qin Yao for invaluable technical support and Samantha D. Corwin for assistance in figure preparation. Conflict of Interest: None declared.
References
- Anderson TW, Darling DA. Asymptotic theory of certain "goodness-of-fit" criteria based on stochastic processes. Ann Math Stat. 1952;23:193–212. [Google Scholar]
- Angelucci F, De Bartolo P, Gelfo F, Foti F, Cutuli D, Bossù P, Caltagirone C, Petrosini L. Increased concentrations of nerve growth factor and brain-derived neurotrophic factor in the rat cerebellum after exposure to environmental enrichment. Cerebellum. 2009;8:499–506. doi: 10.1007/s12311-009-0129-1. [DOI] [PubMed] [Google Scholar]
- Arellano JI, Benavides-Piccione R, Defelipe J, Yuste R. Ultrastructure of dendritic spines: correlation between synaptic and spine morphologies. Front Neurosci. 2007;1:131–143. doi: 10.3389/neuro.01.1.1.010.2007. [DOI] [PMC free article] [PubMed] [Google Scholar]
- Artola A, von Frijtag J, Fermont P, Gispen W, Schrama L, Kamal A, Spruijt B. Long-lasting modulation of the induction of LTD and LTP in rat hippocampal CA1 by behavioural stress and environmental enrichment. Eur J Neurosci. 2006;23:261–272. doi: 10.1111/j.1460-9568.2005.04552.x. [DOI] [PubMed] [Google Scholar]
- Bilousova TV, Dansie L, Ngo M, Aye J, Charles JR, Ethell DW, Ethell IM. Minocycline promotes dendritic spine maturation and improves behavioural performance in the fragile X mouse model. J Med Genet. 2009;46:94–102. doi: 10.1136/jmg.2008.061796. [DOI] [PubMed] [Google Scholar]
- Braun K, Segal M. FMRP Involvement in formation of synapses among cultured hippocampal neurons. Cereb Cortex. 2000;10:1045–1052. doi: 10.1093/cercor/10.10.1045. [DOI] [PubMed] [Google Scholar]
- Brennan FX, Albeck DS, Paylor R. Fmr1 knockout mice are impaired in a leverpress escape/avoidance task. Genes Brain Behav. 2006;5:467–471. doi: 10.1111/j.1601-183X.2005.00183.x. [DOI] [PubMed] [Google Scholar]
- Chen L, Toth M. Fragile X mice develop sensory hyperreactivity to auditory stimuli. Neuroscience. 2001;103:1043–1050. doi: 10.1016/s0306-4522(01)00036-7. [DOI] [PubMed] [Google Scholar]
- Chen LY, Rex CS, Babayan AH, Kramár EA, Lynch G, Gall CM, Lauterborn JC. Physiological activation of synaptic Rac>PAK (p-21 activated kinase) signaling is defective in a mouse model of fragile X syndrome. J Neurosci. 2010;30:10977–10984. doi: 10.1523/JNEUROSCI.1077-10.2010. [DOI] [PMC free article] [PubMed] [Google Scholar]
- Comery TA, Harris JB, Willems PJ, Oostra BA, Irwin SA, Weiler IJ, Greenough WT. Abnormal dendritic spines in fragile X knockout mice: maturation and pruning deficits. Proc Natl Acad Sci USA. 1997;94:5401–5404. doi: 10.1073/pnas.94.10.5401. [DOI] [PMC free article] [PubMed] [Google Scholar]
- Consortium TD-BFX. FMR1 Knockout mice: a model to study fragile X mental retardation. Cell. 1994;78:23–33. [PubMed] [Google Scholar]
- De Bartolo P, Gelfo F, Burello L, De Giorgio A, Petrosini L, Granato A. Plastic changes in striatal fast-spiking interneurons following hemicerebellectomy and environmental enrichment. Cerebellum. 2011;10:624–632. doi: 10.1007/s12311-011-0275-0. [DOI] [PubMed] [Google Scholar]
- de Vrij FM, Levenga J, van der Linde HC, Koekkoek SK, De Zeeuw CI, Nelson DL, Oostra BA, Willemsen R. Rescue of behavioral phenotype and neuronal protrusion morphology in Fmr1 KO mice. Neurobiol Dis. 2008;31:127–132. doi: 10.1016/j.nbd.2008.04.002. [DOI] [PMC free article] [PubMed] [Google Scholar]
- D'Hooge R, Nagels G, Franck F, Bakker CE, Reyniers E, Storm K, Kooy RF, Oostra BA, Willems PJ, De Deyn PP. Mildly impaired water maze performance in male Fmr1 knockout mice. Neuroscience. 1997;76:367–376. doi: 10.1016/s0306-4522(96)00224-2. [DOI] [PubMed] [Google Scholar]
- Dierssen M, Benavides-Piccione R, Martínez-Cué C, Estivill X, Flórez J, Elston G, DeFelipe J. Alterations of neocortical pyramidal cell phenotype in the Ts65Dn mouse model of Down syndrome: effects of environmental enrichment. Cereb Cortex. 2003;13:758–764. doi: 10.1093/cercor/13.7.758. [DOI] [PubMed] [Google Scholar]
- Duffy S, Craddock K, Abel T, Nguyen P. Environmental enrichment modifies the PKA-dependence of hippocampal LTP and improves hippocampus-dependent memory. Learn Mem. 2001;8:26–34. doi: 10.1101/lm.36301. [DOI] [PMC free article] [PubMed] [Google Scholar]
- Faherty CJ, Kerley D, Smeyne RJ. A Golgi-Cox morphological analysis of neuronal changes induced by environmental enrichment. Dev Brain Res. 2003;141:55–61. doi: 10.1016/s0165-3806(02)00642-9. [DOI] [PubMed] [Google Scholar]
- Feng G, Mellor RH, Bernstein M, Keller-Peck C, Nguyen QT, Wallace M, Nerbonne JM, Lichtman JW, Sanes JR. Imaging neuronal subsets in transgenic mice expressing multiple spectral variants of GFP. Neuron. 2000;28:41–51. doi: 10.1016/s0896-6273(00)00084-2. [DOI] [PubMed] [Google Scholar]
- Ferrer I, Gullotta F. Down's syndrome and Alzheimer's disease: dendritic spine counts in the hippocampus. Acta Neuropathol. 1990;79:680–685. doi: 10.1007/BF00294247. [DOI] [PubMed] [Google Scholar]
- Franklin TB, Murphy JA, Myers TL, Clarke DB, Currie RW. Enriched environment during adolescence changes brain-derived neurotrophic factor and TrkB levels in the rat visual system but does not offer neuroprotection to retinal ganglion cells following axotomy. Brain Res. 2006;1095:1–11. doi: 10.1016/j.brainres.2006.04.025. [DOI] [PubMed] [Google Scholar]
- Fréchette M, Rennie K, Pappas BA. Developmental forebrain cholinergic lesion and environmental enrichment: behaviour, CA1 cytoarchitecture and neurogenesis. Brain Res. 2009;1252:172–182. doi: 10.1016/j.brainres.2008.11.082. [DOI] [PubMed] [Google Scholar]
- Galvez R, Greenough WT. Sequence of abnormal dendritic spine development in primary somatosensory cortex of a mouse model of the fragile X mental retardation syndrome. Am J Med Genet A. 2005;135:155–160. doi: 10.1002/ajmg.a.30709. [DOI] [PubMed] [Google Scholar]
- Gelfo F, De Bartolo P, Giovine A, Petrosini L, Leggio MG. Layer and regional effects of environmental enrichment on the pyramidal neuron morphology of the rat. Neurobiol Learn Mem. 2009;91:353–365. doi: 10.1016/j.nlm.2009.01.010. [DOI] [PubMed] [Google Scholar]
- Goshen I, Avital A, Kreisel T, Licht T, Segal M, Yirmiya R. Environmental enrichment restores memory functioning in mice with impaired IL-1 signaling via reinstatement of long-term potentiation and spine size enlargement. J Neurosci. 2009;29:3395–3403. doi: 10.1523/JNEUROSCI.5352-08.2009. [DOI] [PMC free article] [PubMed] [Google Scholar]
- Greenough WT, Volkmar FR, Juraska JM. Effects of rearing complexity on dendritic branching in frontolateral and temporal cortex of the rat. Exp Neurol. 1973;41:371–378. doi: 10.1016/0014-4886(73)90278-1. [DOI] [PubMed] [Google Scholar]
- Gross C, Nakamoto M, Yao X, Chan C, Yim SY, Ye K, Warren ST, Bassell GJ. Excess phosphoinositide 3-kinase subunit synthesis and sctivity as a novel therapeutic target in fragile X syndrome. Neurobiol Dis. 2010;30:10624–10638. doi: 10.1523/JNEUROSCI.0402-10.2010. [DOI] [PMC free article] [PubMed] [Google Scholar]
- Grossman A, Elisseou NM, McKinney BC, Greenough WT. Hippocampal pyramidal cells in adult Fmr1 knockout mice exhibit an immature-appearing profile of dendritic spines. Brain Res. 2006;1084:158–164. doi: 10.1016/j.brainres.2006.02.044. [DOI] [PubMed] [Google Scholar]
- Harnett MT, Makara JK, Spruston N, Kath WL, Magee JC. Synaptic amplification by dendritic spines enhances input cooperativity. Nature. 2012;491:599–602. doi: 10.1038/nature11554. [DOI] [PMC free article] [PubMed] [Google Scholar]
- Harris KM, Stevens JK. Dendritic spines of CA 1 pyramidal cells in the rat hippocampus: serial electron microscopy with reference to their biophysical characteristics. J Neurosci. 1989;9:2982–2997. doi: 10.1523/JNEUROSCI.09-08-02982.1989. [DOI] [PMC free article] [PubMed] [Google Scholar]
- Hayashi ML, Rao BS, Seo JS, Choi HS, Dolan BM, Choi SY, Chattarji S, Tonegawa S. Inhibition of p21-activated kinase rescues symptoms of fragile X syndrome in mice. Proc Natl Acad Sci USA. 2007;104:11489–11498. doi: 10.1073/pnas.0705003104. [DOI] [PMC free article] [PubMed] [Google Scholar]
- He CX, Portera-Cailliau C. The trouble with spines in fragile X syndrome: density, maturity and plasticity. Neuroscience. 2012 doi: 10.1016/j.neuroscience.2012.03.049. [Epub ahead of print] [DOI] [PMC free article] [PubMed] [Google Scholar]
- Hessl D, Glaser B, Dyer-Friedman J, Blasey C, Hastie T, Gunnar M, Reiss AL. Cortisol and behavior in fragile X syndrome. Psychoneuroendocrinology. 2002;27:855–872. doi: 10.1016/s0306-4530(01)00087-7. [DOI] [PubMed] [Google Scholar]
- Hinton V, Brown W, Wisniewski K, Rudelli R. Analysis of neocortex in three males with fragile X syndrome. Am J Med Genet. 1991;41:289–294. doi: 10.1002/ajmg.1320410306. [DOI] [PubMed] [Google Scholar]
- Hu H, Qin Y, Bochorishvili G, Zhu Y, van Aelst L, Zhu JJ. Ras signaling mechanisms underlying impaired GluR1-dependent plasticity associated with fragile X syndrome. J Neurosci. 2008;28:7847–7862. doi: 10.1523/JNEUROSCI.1496-08.2008. [DOI] [PMC free article] [PubMed] [Google Scholar]
- Ickes BR, Pham TM, Sanders LA, Albeck DS, Mohammed AH, Granholm AC. Long-term environmental enrichment leads to regional increases in neurotrophin levels in rat brain. Exp Neurol. 2000;164:45–52. doi: 10.1006/exnr.2000.7415. [DOI] [PubMed] [Google Scholar]
- Irwin SA, Patel B, Idupulapati M, Harris JB, Crisostomo RA, Larsen BP, Kooy F, Willems PJ, Cras P, Kozlowski PB, et al. Abnormal dendritic spine characteristics in the temporal and visual cortices of patients with fragile-X syndrome: a quantitative examination. Am J Med Genet. 2001;98:161–167. doi: 10.1002/1096-8628(20010115)98:2<161::aid-ajmg1025>3.0.co;2-b. [DOI] [PubMed] [Google Scholar]
- Jafari M, Seese RR, Babayan AH, Gall CM, Lauterborn JC. Glucocorticoid receptors are localized to dendritic spines and influence local actin signaling. Mol Neurobiol. 2012;46:304–315. doi: 10.1007/s12035-012-8288-3. [DOI] [PMC free article] [PubMed] [Google Scholar]
- Kazlauckas V, Pagnussat N, Mioranzza S, Kalinine E, Nunes F, Pettenuzzo L, Souza DO, Portela LV, Porciúncula LO, Lara DR. Enriched environment effects on behavior, memory and BDNF in low and high exploratory mice. Physiol Behav. 2011;102:475–480. doi: 10.1016/j.physbeh.2010.12.025. [DOI] [PubMed] [Google Scholar]
- Kempermann G, Kuhn HG, Gage FH. More hippocampal neurons in adult mice living in an enriched environment. Nature. 1997;386:493–495. doi: 10.1038/386493a0. [DOI] [PubMed] [Google Scholar]
- Komatsuzaki Y, Murakami G, Tsurugizawa T, Mukai H, Tanabe N, Mitsuhashi K, Kawata M, Kimoto T, Ooishi Y, Kawato S. Rapid spinogenesis of pyramidal neurons induced by activation of glucocorticoid receptors in adult male rat hippocampus. Biochem Biophys Res Commun. 2005;335:1002–1007. doi: 10.1016/j.bbrc.2005.07.173. [DOI] [PubMed] [Google Scholar]
- Kozorovitskiy Y, Gross CG, Kopil C, Battaglia L, McBreen M, Stranahan AM, Gould E. Experience induces structural and biochemical changes in the adult primate brain. Proc Natl Acad Sci USA. 2005;102:17478–17482. doi: 10.1073/pnas.0508817102. [DOI] [PMC free article] [PubMed] [Google Scholar]
- Kuzumaki N, Ikegami D, Tamura R, Hareyama N, Imai S, Narita M, Torigoe K, Niikura K, Takeshima H, Ando T, et al. Hippocampal epigenetic modification at the brain-derived neurotrophic factor gene induced by an enriched environment. Hippocampus. 2011;21:127–132. doi: 10.1002/hipo.20775. [DOI] [PubMed] [Google Scholar]
- Larson J, Jessen RE, Kim D, Fine AK, du Hoffmann J. Age-dependent and selective impairment of long-term potentiation in the anterior piriform cortex of mice lacking the fragile X mental retardation protein. J Neurosci. 2005;25:9460–9469. doi: 10.1523/JNEUROSCI.2638-05.2005. [DOI] [PMC free article] [PubMed] [Google Scholar]
- Lauterborn J, Rex C, Kramár E, Chen L, Pandyarajan V, Lynch G, Gall C. Brain-derived neurotrophic factor rescues synaptic plasticity in a mouse model of fragile X syndrome. J Neurosci. 2007;27:10685–10694. doi: 10.1523/JNEUROSCI.2624-07.2007. [DOI] [PMC free article] [PubMed] [Google Scholar]
- Lauterborn JC. Stress induced changes in cortical and hypothalamic c-fos expression are altered in fragile X mutant mice. Mol Brain Res. 2004;131:101–109. doi: 10.1016/j.molbrainres.2004.08.014. [DOI] [PubMed] [Google Scholar]
- Lee HY, Ge WP, Huang W, He Y, Wang GX, Rowson-Baldwin A, Smith SJ, Jan YN, Jan LY. Bidirectional regulation of dendritic voltage-gated potassium channels by the fragile X mental retardation protein. Neuron. 2011;72:630–642. doi: 10.1016/j.neuron.2011.09.033. [DOI] [PMC free article] [PubMed] [Google Scholar]
- Leggio MG, Mandolesi L, Federico F, Spirito F, Ricci B, Gelfo F, Petrosini L. Environmental enrichment promotes improved spatial abilities and enhanced dendritic growth in the rat. Behav Brain Res. 2005;163:78–90. doi: 10.1016/j.bbr.2005.04.009. [DOI] [PubMed] [Google Scholar]
- Levenga J, de Vrij FM, Buijsen RA, Li T, Nieuwenhuizen IM, Pop A, Oostra BA, Willemsen R. Subregion-specific dendritic spine abnormalities in the hippocampus of Fmr1 KO mice. Neurobiol Learn Mem. 2011;95:467–472. doi: 10.1016/j.nlm.2011.02.009. [DOI] [PubMed] [Google Scholar]
- Levenga J, Hayashi S, de Vrij FMS, Koekkoek SK, van der Linde HC, Nieuwenhuizen I, Song C, Buijsen RAM, Pop A, GomezMancilla B, et al. AFQ056, A new mGluR5 antagonist for treatment of fragile X syndrome. Neurobiol Dis. 2011;42:311–317. doi: 10.1016/j.nbd.2011.01.022. [DOI] [PubMed] [Google Scholar]
- Li J, Pelletier MR, Perez Velazquez JL, Carlen PL. Reduced cortical synaptic plasticity and GluR1 expression associated with fragile X mental retardation protein deficiency. Mol Cell Neurosci. 2002;19:138–151. doi: 10.1006/mcne.2001.1085. [DOI] [PubMed] [Google Scholar]
- Malik R, Chattarji S. Enhanced intrinsic excitability and EPSP-spike coupling accompany enriched environment-induced facilitation of LTP in hippocampal CA1 pyramidal neurons. J Neurophysiol. 2012;107:1366–1378. doi: 10.1152/jn.01009.2011. [DOI] [PubMed] [Google Scholar]
- Marin-Padilla M. Pyramidal cell abnormalities in the motor cortex of a child with Down's syndrome. A Golgi study. J Comp Neurol. 1976;167:63–81. doi: 10.1002/cne.901670105. [DOI] [PubMed] [Google Scholar]
- Markham JA, Beckel-Mitchener AC, Estrada CM, Greenough WT. Corticosterone response to acute stress in a mouse model of Fragile X syndrome. Psychoneuroendocrinology. 2006;31:781–785. doi: 10.1016/j.psyneuen.2006.02.008. [DOI] [PubMed] [Google Scholar]
- McKinney BC, Grossman AW, Elisseou NM, Greenough WT. Dendritic spine abnormalities in the occipital cortex of C57BL/6 Fmr1 knockout mice. Am J Med Genet B Neuropsychiatr Genet. 2005;136B:98–102. doi: 10.1002/ajmg.b.30183. [DOI] [PubMed] [Google Scholar]
- Meredith RM, Holmgren CD, Weidum M, Burnashev N, Mansvelder HD. Increased threshold for spike-timing-dependent plasticity is caused by unreliable calcium signaling in mice lacking fragile X gene FMR1. Neuron. 2007;54:627–638. doi: 10.1016/j.neuron.2007.04.028. [DOI] [PubMed] [Google Scholar]
- Moon J, Beaudin AE, Verosky S, Driscoll LL, Weiskopf M, Levitsky DA, Crnic LS, Strupp BJ. Attentional dysfunction, impulsivity, and resistance to change in a mouse model of fragile X syndrome. Behav Neurosci. 2006;120:1367–1379. doi: 10.1037/0735-7044.120.6.1367. [DOI] [PubMed] [Google Scholar]
- Muddashetty RS, Kelić S, Gross C, Xu M, Bassell GJ. Dysregulated metabotropic glutamate receptor-dependent translation of AMPA receptor and postsynaptic density-95 mRNAs at synapses in a mouse model of fragile X syndrome. J Neurosci. 2007;27:5338–5348. doi: 10.1523/JNEUROSCI.0937-07.2007. [DOI] [PMC free article] [PubMed] [Google Scholar]
- Musumeci SA, Bosco P, Calabrese G, Bakker C, De Sarro GB, Elia M, Ferri R, Oostra BA. Audiogenic seizures susceptibility in transgenic mice with fragile X syndrome. Epilepsia. 2000;41:19–23. doi: 10.1111/j.1528-1157.2000.tb01499.x. [DOI] [PubMed] [Google Scholar]
- Nilsson M, Perfilieva E, Johansson U, Orwar O, Eriksson PS. Enriched environment increases neurogenesis in the adult rat dentate gyrus and improves spatial memory. J Neurobiol. 1999;39:569–578. doi: 10.1002/(sici)1097-4695(19990615)39:4<569::aid-neu10>3.0.co;2-f. [DOI] [PubMed] [Google Scholar]
- Nithianantharajah J, Barkus C, Vijiaratnam N, Clement O, Hannan AJ. Modeling brain reserve: experience-dependent neuronal plasticity in healthy and Huntington's disease transgenic mice. Am J Geriatr Psychiatry. 2009;17:196–209. doi: 10.1097/JGP.0b013e318196a632. [DOI] [PubMed] [Google Scholar]
- Parsley SL, Pilgram SM, Soto F, Giese KP, Edwards FA. Enriching the environment of alphaCaMKIIT286A mutant mice reveals that LTD occurs in memory processing but must be subsequently reversed by LTP. Learn Mem. 2007;14:75–83. doi: 10.1101/lm.356607. [DOI] [PMC free article] [PubMed] [Google Scholar]
- Penagarikano O, Mulle JG, Warren ST. The pathophysiology of fragile X syndrome. Annu Rev Genomics Hum Genet. 2007;8:109–129. doi: 10.1146/annurev.genom.8.080706.092249. [DOI] [PubMed] [Google Scholar]
- Pfeiffer BE, Zang T, Wilkerson JR, Taniguchi M, Maksimova MA, Smith LN, Cowan CW, Huber KM. Fragile X mental retardation protein is required for synapse elimination by the activity-dependent transcription factor MEF2. Neuron. 2010;66:191–197. doi: 10.1016/j.neuron.2010.03.017. [DOI] [PMC free article] [PubMed] [Google Scholar]
- Pop AS, Levenga J, de Esch CE, Buijsen RA, Nieuwenhuizen IM, Li T, Isaacs A, Gasparini F, Oostra BA, Willemsen R. Rescue of dendritic spine phenotype in Fmr1 KO mice with the mGluR5 antagonist AFQ056/Mavoglurant. Psychopharmacology (Berl) 2012 doi: 10.1007/s00213-012-2947-y. [Epub ahead of print] [DOI] [PubMed] [Google Scholar]
- Restivo L, Ferrari F, Passino E, Sgobio C, Bock J, Oostra BA, Bagni C, Ammassari-Teule M. Enriched environment promotes behavioral and morphological recovery in a mouse model for the fragile X syndrome. Proc Natl Acad Sci USA. 2005;102:11557–11562. doi: 10.1073/pnas.0504984102. [DOI] [PMC free article] [PubMed] [Google Scholar]
- Rudelli R, Brown W, Wisniewski K, Jenkins E, Laure-Kamionowska M, Connell F, Wisniewski H. Adult fragile X Syndrome. Clinico-neuropathologic findings. Acta Neuropathologica. 1985;67:289–295. doi: 10.1007/BF00687814. [DOI] [PubMed] [Google Scholar]
- Schikorski T, Stevens CF. Quantitative fine-structural analysis of olfactory cortical synapses. Proc Natl Acad Sci USA. 1999;96:4107–4112. doi: 10.1073/pnas.96.7.4107. [DOI] [PMC free article] [PubMed] [Google Scholar]
- Schütt J, Falley K, Richter D, Kreienkamp HJ, Kindler S. Fragile X mental retardation protein regulates the levels of scaffold proteins and glutamate receptors in postsynaptic densities. J Biol Chem. 2009;284:25479–25487. doi: 10.1074/jbc.M109.042663. [DOI] [PMC free article] [PubMed] [Google Scholar]
- Seese RR, Babayan AH, Katz AM, Cox CD, Lauterborn JC, Lynch G, Gall CM. LTP Induction translocates cortactin at distant synapses in wild-type but not Fmr1 knock-out mice. J Neurosci. 2012;32:7403–7413. doi: 10.1523/JNEUROSCI.0968-12.2012. [DOI] [PMC free article] [PubMed] [Google Scholar]
- Segal M, Kreher U, Greenberger V, Braun K. Is fragile X mental retardation protein involved in activity-induced plasticity of dendritic spines? Brain Res. 2003;972:9–15. doi: 10.1016/s0006-8993(03)02410-7. [DOI] [PubMed] [Google Scholar]
- Shang Y, Wang H, Mercaldo V, Li X, Chen T, Zhuo M. Fragile X mental retardation protein is required for chemically-induced long-term potentiation of the hippocampus in adult mice. J Neurochem. 2009;111:635–646. doi: 10.1111/j.1471-4159.2009.06314.x. [DOI] [PubMed] [Google Scholar]
- Sharma A, Hoeffer CA, Takayasu Y, Miyawaki T, McBride SM, Klann E, Zukin RS. Dysregulation of mTOR signaling in fragile X syndrome. J Neurosci. 2010;30:694–702. doi: 10.1523/JNEUROSCI.3696-09.2010. [DOI] [PMC free article] [PubMed] [Google Scholar]
- Sholl DA. Dendritic organization in the neurons of the visual and motor cortices of the cat. J Anat. 1953;87:387–406. [PMC free article] [PubMed] [Google Scholar]
- Shors TJ, Chua C, Falduto J. Sex differences and opposite effects of stress on dendritic spine density in the male versus female hippocampus. J Neurosci. 2001;21:6291–6297. doi: 10.1523/JNEUROSCI.21-16-06292.2001. [DOI] [PMC free article] [PubMed] [Google Scholar]
- Su T, Fan HX, Jiang T, Sun WW, Den WY, Gao MM, Chen SQ, Zhao QH, Yi YH. Early continuous inhibition of group 1 mGlu signaling partially rescues dendritic spine abnormalities in the Fmr1 knockout mouse model for fragile X syndrome. Psychopharmacology (Berl) 2011;215:291–300. doi: 10.1007/s00213-010-2130-2. [DOI] [PubMed] [Google Scholar]
- Suetsugu M, Mehraein P. Spine distribution along the apical dendrites of the pyramidal neurons in Down's syndrome. A quantitative Golgi study. Acta Neuropathol. 1980;50:207–210. doi: 10.1007/BF00688755. [DOI] [PubMed] [Google Scholar]
- Swanger SA, Yao X, Gross C, Bassell GJ. Automated 4D analysis of dendritic spine morphology: applications to stimulus-induced spine remodeling and pharmacological rescue in a disease model. Mol Brain. 2011;4:38. doi: 10.1186/1756-6606-4-38. [DOI] [PMC free article] [PubMed] [Google Scholar]
- Takashima S, Becker LE, Armstrong DL, Chan F. Abnormal neuronal development in the visual cortex of the human fetus and infant with down's syndrome. A quantitative and qualitative Golgi study. Brain Res. 1981;225:1–21. doi: 10.1016/0006-8993(81)90314-0. [DOI] [PubMed] [Google Scholar]
- Todd PK, Mack KJ, Malter JS. The fragile X mental retardation protein is required for type-I metabotropic glutamate receptor-dependent translation of PSD-95. Proc Natl Acad Sci USA. 2003;100:14374–14378. doi: 10.1073/pnas.2336265100. [DOI] [PMC free article] [PubMed] [Google Scholar]
- Turner CA, Lewis M, King MA. Environmental enrichment: effects on stereotyped behavior and dendritic morphology. Dev Psychobiol. 2003;43:20–27. doi: 10.1002/dev.10116. [DOI] [PubMed] [Google Scholar]
- Ventura R, Pascucci T, Catania MV, Musumeci SA, Puglisi-Allegra S. Object recognition impairment in Fmr1 knockout mice is reversed by amphetamine: involvement of dopamine in the medial prefrontal cortex. Behav Pharmacol. 2004;15:433–442. doi: 10.1097/00008877-200409000-00018. [DOI] [PubMed] [Google Scholar]
- Volkmar FR, Greenough WT. Rearing complexity affects branching of dendrites in the visual cortex of the rat. Science. 1972;176:1445–1447. doi: 10.1126/science.176.4042.1445. [DOI] [PubMed] [Google Scholar]
- Wei DS, Mei YA, Bagal A, Kao JP, Thompson SM, Tang CM. Compartmentalized and binary behavior of terminal dendrites in hippocampal pyramidal neurons. Science. 2001;293:2272–2275. doi: 10.1126/science.1061198. [DOI] [PubMed] [Google Scholar]
- Wisbeck JM, Huffman LC, Freund L, Gunnar MR, Davis EP, Reiss AL. Cortisol and social stressors in children with fragile X: a pilot study. J Dev Behav Pediatr. 2000;21:278–282. doi: 10.1097/00004703-200008000-00004. [DOI] [PubMed] [Google Scholar]
- Yan QJ, Asafo-Adjei PK, Arnold HM, Brown RE, Bauchwitz RP. A phenotypic and molecular characterization of the fmr1-tm1Cgr fragile X mouse. Genes Brain Behav. 2004;3:337–359. doi: 10.1111/j.1601-183X.2004.00087.x. [DOI] [PubMed] [Google Scholar]
- Yun SH, Trommer BL. Fragile X mice: reduced long-term potentiation and N-Methyl-D-Aspartate receptor-mediated neurotransmission in dentate gyrus. J Neurosci Res. 2011;89:176–182. doi: 10.1002/jnr.22546. [DOI] [PubMed] [Google Scholar]
- Zalfa F, Giorgi M, Primerano B, Moro A, Di Penta A, Reis S, Oostra B, Bagni C. The fragile X syndrome protein FMRP associates with BC1 RNA and regulates the translation of specific mRNAs at synapses. Cell. 2003;112:317–327. doi: 10.1016/s0092-8674(03)00079-5. [DOI] [PubMed] [Google Scholar]
- Zhao MG, Toyoda H, Ko SW, Ding HK, Wu LJ, Zhuo M. Deficits in trace fear memory and long-term potentiation in a mouse model for fragile X syndrome. J Neurosci. 2005;25:7385–7392. doi: 10.1523/JNEUROSCI.1520-05.2005. [DOI] [PMC free article] [PubMed] [Google Scholar]
- Zhu SW, Codita A, Bogdanovic N, Hjerling-Leffler J, Ernfors P, Winblad B, Dickins DW, Mohammed AH. Influence of environmental manipulation on exploratory behaviour in male BDNF knockout mice. Behav Brain Res. 2009;197:339–346. doi: 10.1016/j.bbr.2008.09.032. [DOI] [PubMed] [Google Scholar]
Associated Data
This section collects any data citations, data availability statements, or supplementary materials included in this article.