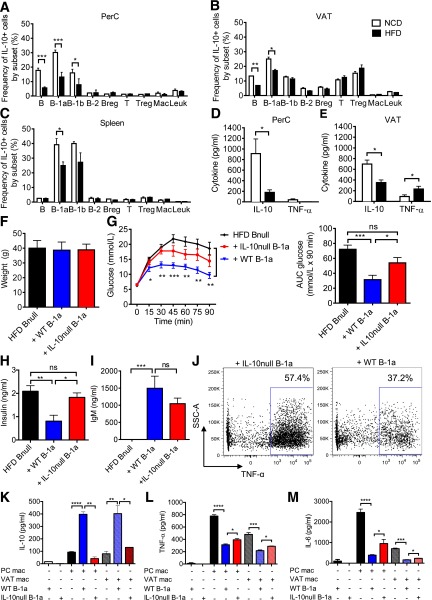
Figure 2.
IL-10 production is impaired in obese mice. A–C: Frequency of GFP+ cells within each subpopulation in the PerC, VAT, and spleen from IL-10 EGFP mice fed the NCD or HFD for 9 weeks (n = 5–6, representative of three experiments). D and E: IL-10 and TNF-α concentration in 48-h PerC and VAT culture supernatants (n = 6). Body weights (F), GTT with AUC analysis (G), and fasting insulin (H) of HFD Bnull mice 1 week after receiving PBS, WT B-1a, or IL10null B-1a cells (n = 5). I: Serum IgM concentration 1 week after B-1a cell transfer (n = 5). J: TNF-α production in VAT macrophages. FACS plots are representative of two experiments. SSC-A, side scatter-area. Cytokine concentrations of IL-10 (K), TNF-α (L), and IL-6 (M) in 60-h coculture of WT PerC and VAT macrophages with WT or IL-10null B-1a cells (n = 3 per group, two replicates). Values are given as mean ± SEM. *P < 0.05; **P < 0.005; ***P < 0.0005; ****P < 0.0001.

