Abstract
Bacillus thuringiensis secretes the virulence factor phosphatidylinositol-specific phospholipase C (BtPI-PLC), which specifically binds to phosphatidylcholine (PC) and cleaves GPI-anchored proteins off eukaryotic plasma membranes. To elucidate how BtPI-PLC searches for GPI-anchored proteins on the membrane surface, we measured residence times of single fluorescently labeled proteins on PC-rich small unilamellar vesicles (SUVs). BtPI-PLC interactions with the SUV surface are transient with a lifetime of 379 ± 49 ms. These data also suggest that BtPI-PLC does not directly sense curvature, but rather prefers to bind to the numerous lipid packing defects in SUVs. Despite this preference for defects, all-atom molecular dynamics simulations of BtPI-PLC interacting with PC-rich bilayers show that the protein is shallowly anchored with the deepest insertions ∼18 Å above the bilayer center. Membrane partitioning is mediated, on average, by 41 hydrophobic, 8 hydrogen-bonding, and 2 cation−π (between PC choline headgroups and Tyr residues) transient interactions with phospholipids. These results lead to a quantitative model for BtPI-PLC interactions with cell membranes where protein binding is mediated by lipid packing defects, possibly near GPI-anchored proteins, and the protein diffuses on the membrane for ∼100–380 ms, during which time it may cleave ∼10 GPI-anchored proteins before dissociating. This combination of short two-dimensional scoots followed by three-dimensional hops may be an efficient search strategy on two-dimensional surfaces with obstacles.
Phosphatidylinositol-specific phospholipase C enzymes (PI-PLCs) secreted by Gram-positive bacterial pathogens help down-regulate eukaryotic innate immune responses, thereby enhancing bacterial virulence.1,2 For the extracellular bacterial pathogens Bacillus and Staphylococcus, this effect results from PI-PLC-mediated cleavage of glycosylphosphatidylinositol (GPI)-anchored proteins off cell surfaces.3,4 In the case of Bacillus PI-PLC, recognition of eukaryotic cell surfaces and enzymatic activity are enhanced by the presence of even small amounts of the zwitterionic lipid phosphatidylcholine (PC),5 which is abundant in the outer leaflet of eukaryotic cells. Theoretically, specific binding to PC might result in longer residence times on the cell membrane, a model in which searching for GPI-anchored substrates would be facilitated by two-dimensional diffusion (“scooting”) of the protein on the cell surface.
While scooting is likely important, membrane dissociation (“hopping”) is also important for the activity of Bacillus thuringiensis (Bt) PI-PLC. For two-component small unilamellar vesicles (SUVs) containing an anionic lipid and PC, interactions between lipids and BtPI-PLC are synergistic, with maximal catalytic activity at low to moderate mole fractions of PC (XPC) and maximal binding occurring at high XPC (low mole fractions of anionic lipids).6,7 When XPC > 0.6, BtPI-PLC catalytic activity plummets. In contrast, the binding affinity continues to increase, reaching a maximum at XPC ≈ 0.9. This loss of enzymatic activity concomitant with decreases in the mole fraction of an interfacial substrate is often ascribed to surface dilution inhibition, where the 2-D substrate concentration falls below the enzyme’s 2-D Km.8 However, at high XPC, BtPI-PLC mutants with lower membrane affinities recover much of the activity lost by the wild-type enzyme.7 These results support a kinetic model where reductions in wild-type activity at XPC > 0.6 result from tight membrane binding that limits enzyme dissociation from the membrane and/or slows down scooting, rather than from dilution of the substrate. These effects make it difficult for the enzyme to find the next substrate molecule once those in the immediate vicinity have been cleaved.
While these results suggest that maximal BtPI-PLC activity is associated with apparent Kd values for membranes ranging from ∼50 μM to 1 mM, it is unclear how these affinities correlate with the kinetic search mechanism(s) that BtPI-PLC uses to efficiently find substrates on the surface of cells. Assuming that tight binding at high XPC represents the maximum residence times, i.e., the longest scoots, that BtPI-PLC is likely to display on cell membranes, we have monitored interactions of single fluorescently labeled BtPI-PLC with fluorescently labeled PC-rich surface-tethered SUVs9,10 using two-color total internal reflection fluorescence (TIRF) microscopy in order to determine the distribution of residence times and to quantitatively model how BtPI-PLC efficiently searches for substrates on cell surfaces. In these experiments, SUVs containing 0.8 and 0.2 mole fraction of 1-palmitoyl-2-oleoylphosphatidylcholine (POPC) and dioleoylphosphatidylglycerol (DOPG), respectively, 2–3% of the lipophilic fluorophore DiD, and 1% biotinylated dipalmitoylphosphatidylethanolamine (biotin-PE) were prepared by sonication. Immobilization on the surface of coverslips coated with polyethylene glycol (PEG) 5000 and 1% biotin-PEG 5000 was achieved by addition of the protein neutravidin which tightly binds to both biotin-PE in the SUVs and biotin-PEG on the surface9,10 (Figure 1; see Supporting Information (SI), Figures S1–S3, and work by Friedman and co-workers11 for details). SUV locations were determined from the DiD fluorescence evident in the red channel and mapped onto the blue channel, and trajectories of Alexa Fluor 488 (AF488)-labeled BtPI-PLC6 landings on SUVs were recorded (Figure 1). Due to the limited number of photons detected from single fluorescently labeled proteins with very short residence times, the minimum accessible time resolution is 30 ms. Thus, the small number of events in the first bin of the residence time histogram (Figure 1C) likely arises from undercounting, i.e., missed events, at short times. The results shown below are the same whether or not we include the short events in the data analysis.
Figure 1.
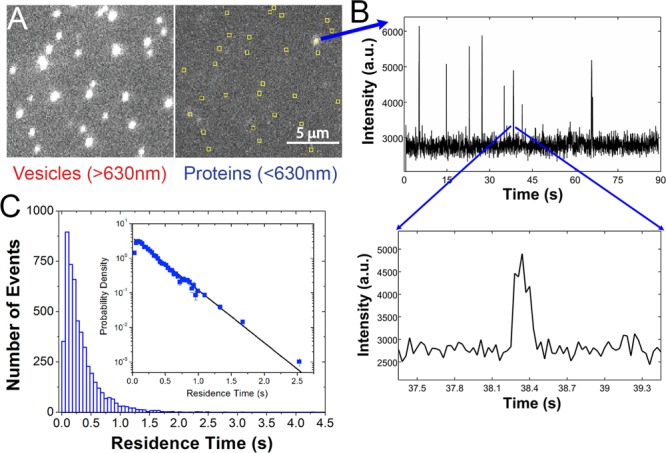
BtPI-PLC residence times on PC-rich SUVs. (A) A dual-view image showing the vesicle (>630 nm) channel (left) and the protein (<630 nm) channel (right). Yellow squares identify vesicle locations mapped onto the protein channel. (B) Protein fluorescence intensity (arbitrary units, a.u.) vs time for a single SUV. Spikes correspond to single protein landings, and the inset shows the length of a typical landing. (C) The residence time histogram for 5085 landings on 1168 individual SUVs (bars). Inset: koff was determined from the raw residence time data using eq 1, and this fit (line) is superimposed on the probability density.
The distribution of landing times (Figure 1C) revealed a mean residence time of 303 ± 30 ms and a median of 210 ms, determined from 5085 PI-PLC landings on 1168 individual SUVs (Figures 1 and 2). This result is in good agreement with the average 250 ms residence time previously estimated from ensemble Trp fluorescence experiments for Bacillus cereus PI-PLC (97% identical to BtPI-PLC)12 and similar to the 250 ms residence time observed for human phospholipase C γ2 with clusters of GPI-anchored proteins in cells.13 The residence time distribution is well described by a single-exponential decay (Figure 1C, SI and Figure S4):14
| 1 |
where Presidence(t) is the probability density, tmin = 0.03 s and tmax = 4.5 s are the minimum and maximum experimentally observed residence times used to account for the limited time resolution of the experiment, and koff = 3.49 ± 0.053 s–1 is the dissociation rate constant from maximum likelihood fits to the residence times (SI and Figures 1C and S4). Correcting for slight decreases in the residence time due to photobleaching (SI and Figure S4) leads to koff = 2.64 ± 0.34 s–1 or a lifetime of 379 ± 49 ms on SUVs. At 22 °C the apparent dissociation constant, Kd, of BtPI–PLC from XPC = 0.8 SUVs is 3.5 ± 0.7 μM,15 leading to a calculated association rate constant, kon, of 0.75 ± 0.18 μM–1 s–1. This association rate, for the ensemble, is not diffusion limited, likely due to side-chain and phospholipid rearrangements required for membrane binding.
Figure 2.
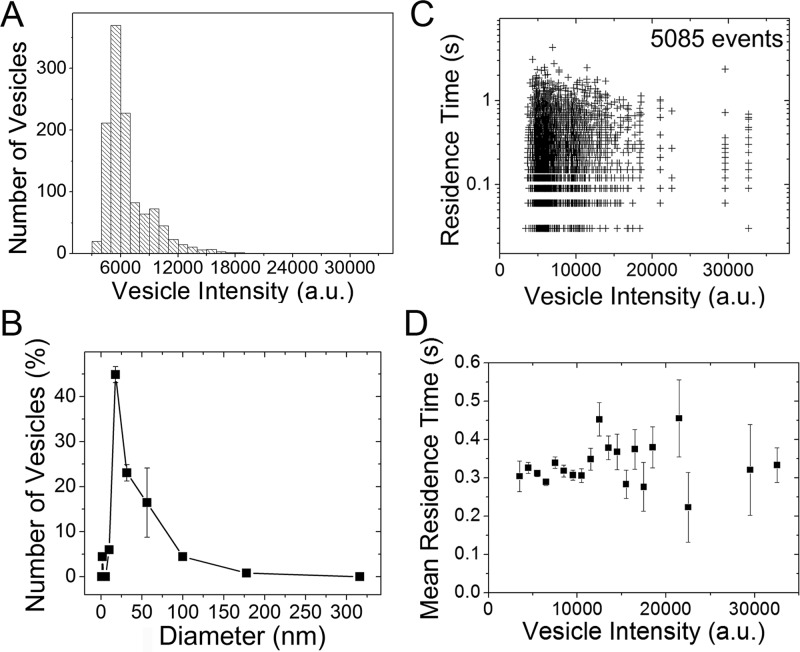
Residence times do not depend on vesicle size. (A) The vesicle fluorescence intensity histogram recapitulates the vesicle size distribution measured by (B) DLS. (C) Residence time versus vesicle intensity. (D) Mean residence time (±standard error of the mean) versus vesicle intensity.
BtPI-PLC preferentially binds to highly curved vesicles6 and to membranes with lower lipid packing densities.16 Because highly curved vesicles also have lower lipid packing densities, these two results suggest that BtPI-PLC recognizes defects in lipid packing rather than directly sensing curvature. To test this hypothesis, we adapted methods developed by Stamou and co-workers which take advantage of the fact that larger vesicles contain more dye molecules and thus have higher fluorescence intensities and display more photobleaching steps.17 This intensity dependence allows us to size the SUVs on the basis of fluorescence intensity, to correlate the vesicle intensity distribution with the vesicle size distribution from dynamic light scattering (DLS), and to then determine if protein residence times depend on vesicle size (intensity) (Figure 2).
The SUV size distribution is quite heterogeneous, with diameters ranging from 20 to 100 nm (Figure 2A,B). While this size range is rather small, in fluorescence correlation spectroscopy (FCS) experiments, designed to measure apparent Kd values for BtPI-PLC binding to POPC/DOPG SUVs, the diffusion times of unlabeled or labeled SUVs determined from protein binding data are significantly shorter than diffusion times of DiD-labeled SUVs in the absence of protein. These FCS results suggest that, even within this size range, BtPI-PLC may preferentially bind to faster diffusing, smaller vesicles. However, as shown in Figure 2, the residence time distributions are independent of vesicle size for these 20–100 nm diameter vesicles. The distribution of residence time versus vesicle intensity is similar to that predicted on the basis of random, unbiased interactions between proteins with the given residence time distribution and vesicles with the given size and intensity distribution (see Figure S5). This suggests that the higher affinity of BtPI-PLC for highly curved vesicles arises from a preference for binding to lipid packing defects17 that occur with higher probability in smaller, curved vesicles with higher surface tension.18 This conclusion is supported both by BtPI-PLC’s higher affinity for lipid aggregates with lower packing densities16 and by estimates of the surface area covered by the BtPI-PLC binding interface. Molecular dynamics (MD) simulations of BtPI-PLC–membrane interactions (see SI) suggest that the surface area of the binding interface is 500–600 Å2, corresponding to 0.5% or less of the total surface area for a 20 nm diameter SUV. In other words, to a small protein such as BtPI-PLC, even SUVs are likely to look flat.
Recently, the size and distribution of lipid packing defects in model membranes have been investigated using MD simulations.19−21 These studies show that both the probability of encountering a defect and the defect size constant, determined by fitting the lipid packing defect size distribution to an exponential distribution, increase as the membrane becomes more convex. For pure POPC SUVs, the defect size constant is ∼16 Å2, compared to ∼12 Å2 for large unilamellar vesicles (LUVs) and 10 Å2 for flat bilayers.21 Both BtPI-PLC and helical peptides that act as amphipathic lipid packing sensors appear to be very sensitive to this increase in packing defect number and size. For pure POPC, this sensitivity is reflected in Kd values for SUVs which are at least 1 order of magnitude lower than Kd values for binding to membrane topologies such as LUVs with ∼12 Å2 defect size constants.6,21
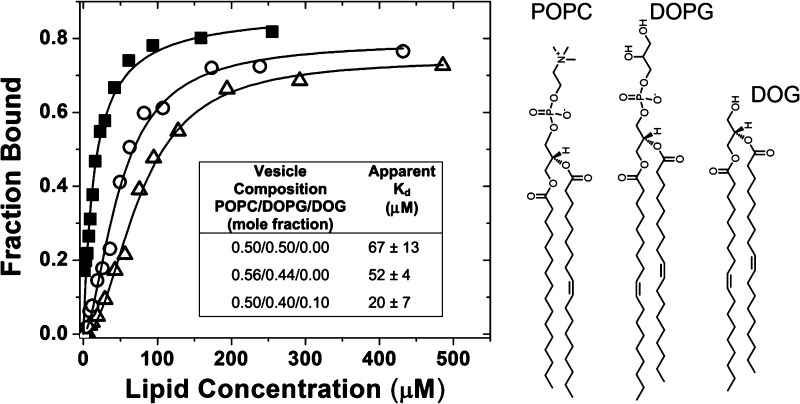
Similarly, the defect size constant significantly increases when conical, smaller headgroups are substituted for 10–15% of larger headgroups while keeping the acyl chain saturation constant.20,21 Thus, substitution of the conical lipid dioleoylglycerol (DOG) for DOPG should increase the number of large lipid packing defects without significantly altering either the defect size distribution or the membrane curvature. This substitution allows us to further delineate the roles of membrane curvature and lipid packing defects in BtPI-PLC membrane binding simply by measuring equilibrium membrane affinities. We chose to use vesicles with an XPC near 0.5, because Kd values for these vesicles are more than an order of magnitude larger than for 0.8 XPC vesicles,6 making it easier to observe changes in binding affinity. Both the PC specificity of BtPI-PLC vesicle binding and the effects of defects introduced by DOG need to be taken into account (Figure 3). BtPI-PLC binds to 0.5 POPC/0.5 DOPG and 0.56 POPC/0.44 DOPG SUVs with similar affinities (Figure 3). For SUVs containing a PC:PG molar ratio of 1.25, DOG incorporation does not significantly alter the SUV size distribution (Figure S6), and BtPI-PLC binds 2–3 times more tightly to these SUVs (Figure 3). This result shows that simply increasing the number of packing defects, particularly larger defects, increases binding affinity. Physiologically, this preference for binding to defects may increase the likelihood that BtPI-PLC binds near its cellular substrate, GPI-anchored proteins.22
Figure 3.
Increasing the number of lipid packing defects increases BtPI-PLC affinity for SUVs. Binding curves for 0.5 POPC/0.5 DOPG (△), 0.56 POPC/0.44 DOPG (○), and 0.5 POPC/0.4 DOPG/0.1 DOG (■) SUVs. The tabulated mean apparent Kd values were obtained from two independent FCS experiments. The lipid structures are shown on the right.
On the molecular level, what accounts for the short residence times of BtPI-PLC on SUVs? All-atom, explicit solvent 500 ns MD simulations of BtPI-PLC binding to flat membranes composed of 0.8 XPC and 0.2 XPG (see SI text for details) suggest that on average the protein–membrane interactions consist of 41 hydrophobic interactions, 8 hydrogen-bonding interactions, and 2 cation−π interactions (between PC choline headgroups and Tyr residues) (Figures S7 and S8). These individual interactions are dynamic, with lipids exchanging on a time scale of 100–200 ns (Figures S8 and S9). The protein–membrane interactions also tend to be close to the membrane surface, with residues from BtPI-PLC helix B inserting the deepest (Figures 4 and S10).
Figure 4.
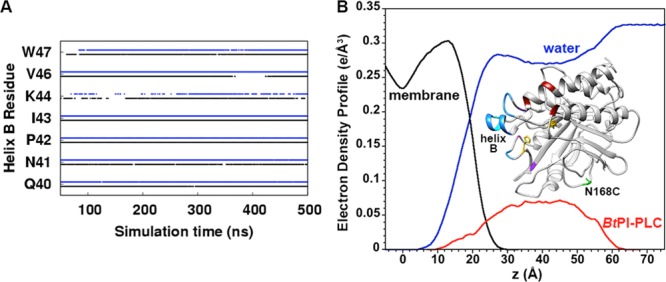
Interactions between individual BtPI-PLC residues and individual phospholipids are transient, and BtPI-PLC binds close to the membrane surface. (A) Occupancies for hydrophobic interactions between helix B residues and membrane lipids (black and blue for MD replicas one and two, respectively). (B) BtPI-PLC interactions with the membrane from the MD simulations. Electron density profiles for the membrane, waters, and BtPI-PLC are black, blue, and red, respectively. The center of the membrane is at zero Å. Inset: A BtPI-PLC snapshot from the simulations. Residues that interact with the membrane are blue, purple, and red, indicating hydrophobic, hydrogen-bonding, and cation−π interactions, respectively. The AF488 fluorophore is attached to N168C (green).
Perhaps because of the shallow anchoring of the aromatic amino acids, even small changes, e.g., by mutating a single Tyr involved in a cation−π interaction,15 can increase the apparent Kd by an order of magnitude. The MD and experimental results thus suggest that residence times of hundreds of ms are associated with a large number of transient residue–lipid interactions near the surface of the membrane, even when some of these interactions contribute on the order of 2 kcal/mol to the binding energy.15
All of these data provide the basis for a quantitative model of how BtPI-PLC searches for substrates on cell surfaces (Figure S11). The basic parameters for this model are (i) the τ = 379 ± 49 ms BtPI-PLC lifetime on SUVs; (ii) the 325 μmol substrate min–1 (mg–1 enzyme) specific activity of BtPI-PLC toward PI in XPC = 0.5 SUVs,15 resulting in 5.3 ms per substrate turnover; (iii) the distribution of substrate GPI-anchored proteins on the cell surface (for GPI-anchored proteins on monocytes, nearest-neighbor distances are ∼250 nm23); and (iv) diffusion coefficients, D, of peripheral membrane proteins on lipid bilayers based on single-particle tracking experiments performed by Knight et al.24 for multimers and monomers of the human GRP1 PH domain ranging from 1 to 3 μm2/s.
BtPI-PLC combines 3-D (hopping) and 2-D (scooting) search strategies to find substrates. BtPI-PLC likely binds at defects on the cell membrane that may, or may not, be associated with GPI-anchored proteins. Within τ = 379 ms a single BtPI-PLC on the surface of a cell can diffuse (scoot) an average distance, r = (4Dτ)1/2, of ∼1.2–2.1 μm. During this scooting time, the protein likely encounters 5–9 clusters of GPI-anchored proteins, containing one or two proteins, before dissociating. This model may actually overestimate scooting times for BtPI-PLC. To better define the residence time distribution, we used tight binding conditions for the single molecule TIRF experiments. However, BtPI-PLC activity is substantially higher when it binds less tightly to membranes, and mutations that reduce the affinity at high XPC increase the activity.7 Even for our experimental conditions, most of the BtPI-PLC molecules have residence times of <300 ms (Figure 1C). Our model may therefore provide an upper limit for BtPI-PLC 2-D diffusion on cell surfaces.
The proposed BtPI-PLC search mechanism is dependent on short (hundreds of ms) excursions on the membrane, mediated by tens of dynamic interactions between the protein and phospholipids. What are the advantages of this search mechanism, and might it be used by other enzymes that target membranes? While a quantitative answer requires future mathematical modeling, this search mechanism is consistent with models of the cell membrane, such as those proposed by Kusumi and co-workers,25 where membrane proteins tethered to the cytoskeleton partition the outer plasma membrane into dynamic domains that are ∼40–300 nm in diameter. In such a case, short (hundreds of ms) scoots would easily allow BtPI-PLC to explore individual domains, while frequent membrane dissociation would provide a way to get over obstacles between domains.
Acknowledgments
This work was supported by the NIGMS of the NIH under award no. R01GM060418 (M.F.R.) and by the Norwegian Research Council (N.R.). Microscopy was performed at the UMass Single Molecule/Live Cell Imaging Facility. N.R. acknowledges computational resources from NOTUR, the Norwegian Metacenter for Computational Science.
Supporting Information Available
Methods, sample preparation (Figure S1), image analysis (Figures S2–S5), DLS (Figure S6), MD simulations (Figures S7–S10), search schematic (Figure S11), and FCS data (Figure S12). This material is available free of charge via the Internet at http://pubs.acs.org.
Author Present Address
# Andor Technology, South Windsor, Connecticut 06074, United States
The authors declare no competing financial interest.
Funding Statement
National Institutes of Health, United States
Supplementary Material
References
- Tattoli I.; Sorbara M. T.; Yang C.; Tooze S. A.; Philpott D. J.; Girardin S. E. EMBO J. 2013, 32, 3066. [DOI] [PMC free article] [PubMed] [Google Scholar]
- Zenewicz L. A.; Wei Z.; Goldfine H.; Shen H. J. Immunol. 2005, 174, 8011. [DOI] [PubMed] [Google Scholar]
- Griffith O. H.; Ryan M. Biochim. Biophys. Acta 1999, 1441, 237. [DOI] [PubMed] [Google Scholar]
- Ikezawa H.; Taguchi R. Methods Enzymol. 1981, 71, 731. [Google Scholar]
- Zhou C.; Qian X.; Roberts M. F. Biochemistry 1997, 36, 10089. [DOI] [PubMed] [Google Scholar]
- Pu M.; Fang X.; Redfield A. G.; Gershenson A.; Roberts M. F. J. Biol. Chem. 2009, 284, 16099. [DOI] [PMC free article] [PubMed] [Google Scholar]
- Pu M.; Roberts M. F.; Gershenson A. Biochemistry 2009, 48, 6835. [DOI] [PMC free article] [PubMed] [Google Scholar]
- Berg O. G.; Gelb M. H.; Tsai M.-D.; Jain M. K. Chem. Rev. 2001, 101, 2613. [DOI] [PubMed] [Google Scholar]
- Boukobza E.; Sonnenfeld A.; Haran G. J. Phys. Chem. B 2001, 105, 12165. [Google Scholar]
- Stamou D.; Duschl C.; Delamarche E.; Vogel H. Angew. Chem., Int. Ed. 2003, 42, 5580. [DOI] [PubMed] [Google Scholar]
- Friedman L. J.; Mumm J. P.; Gelles J. Proc. Natl. Acad. Sci. U.S.A. 2013, 110, 9740. [DOI] [PMC free article] [PubMed] [Google Scholar]
- Volwerk J. J.; Filthuth E.; Griffith O. H.; Jain M. K. Biochemistry 1994, 33, 3464. [DOI] [PubMed] [Google Scholar]
- Suzuki K. G. N.; Fujiwara T. K.; Edidin M.; Kusumi A. J. Cell Biol. 2007, 177, 731. [DOI] [PMC free article] [PubMed] [Google Scholar]
- Rozovsky S.; Forstner M. B.; Sondermann H.; Groves J. T. J. Phys. Chem. B 2012, 116, 5122. [DOI] [PubMed] [Google Scholar]
- Grauffel C.; Yang B.; He T.; Roberts M. F.; Gershenson A.; Reuter N. J. Am. Chem. Soc. 2013, 135, 5740. [DOI] [PMC free article] [PubMed] [Google Scholar]
- Lehto M. T.; Sharom F. J. Biochemistry 2002, 41, 1398. [DOI] [PubMed] [Google Scholar]
- Hatzakis N. S.; Bhatia V. K.; Larsen J.; Madsen K. L.; Bolinger P.-Y.; Kunding A. H.; Castillo J.; Gether U.; Hedegård P.; Stamou D. Nat. Chem. Biol. 2009, 5, 835. [DOI] [PubMed] [Google Scholar]
- Bigay J.; Antonny B. Dev. Cell 2012, 23, 886. [DOI] [PubMed] [Google Scholar]
- Cui H.; Lyman E.; Voth G. A. Biophys. J. 2011, 100, 1271. [DOI] [PMC free article] [PubMed] [Google Scholar]
- Vamparys L.; Gautier R.; Vanni S.; Bennett W. F. D.; Tieleman D. P.; Antonny B.; Etchebest C.; Fuchs P. F. J. Biophys. J. 2013, 104, 585. [DOI] [PMC free article] [PubMed] [Google Scholar]
- Vanni S.; Hirose H.; Bareli H.; Antonny B.; Gautier R. Nat. Commun. 2014, 5, 4916. [DOI] [PubMed] [Google Scholar]
- Kinoshita T.; Fujita M.; Maeda Y. J. Biochem. 2008, 144, 287. [DOI] [PubMed] [Google Scholar]
- van Zanten T. S.; Cambi A.; Koopman M.; Joosten B.; Figdor C. G.; Garcia-Parajo M. F. Proc. Natl. Acad. Sci. U.S.A. 2009, 106, 18557. [DOI] [PMC free article] [PubMed] [Google Scholar]
- Knight J. D.; Lerner M. G.; Marcano-Velazquez J. G.; Pastor R. W.; Falke J. J. Biophys. J. 2010, 99, 2879. [DOI] [PMC free article] [PubMed] [Google Scholar]
- Kusumi A.; Tsunoyama T. A.; Hirosawa K. M.; Kasai R. S.; Fujiwara T. K. Nat. Chem. Biol. 2014, 10, 524. [DOI] [PubMed] [Google Scholar]
Associated Data
This section collects any data citations, data availability statements, or supplementary materials included in this article.


