

Abstract
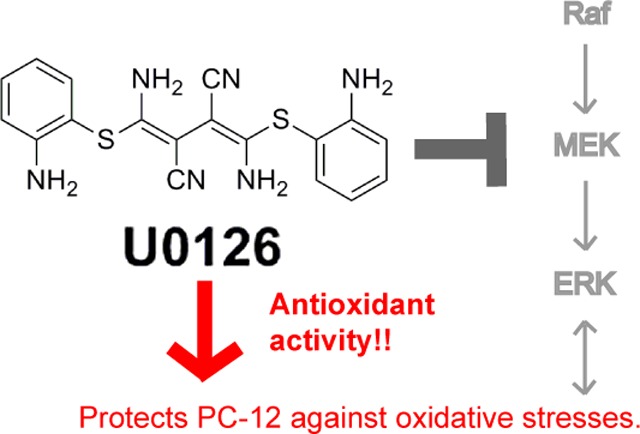
U0126 is a potent and selective inhibitor of MEK1 and MEK2 kinases. It has been widely used as an inhibitor for the Ras/Raf/MEK/ERK signaling pathway with over 5000 references on the NCBI PubMed database. In particular, U0126 has been used in a number of studies to show that inhibition of the Raf/MEK/ERK pathway protects neuronal cells against oxidative stress. Here, we report that U0126 can function as an antioxidant that protects PC12 cells against a number of different oxidative-stress inducers. This protective effect of U0126 is independent of its function as a MEK inhibitor, as several other MEK inhibitors failed to show similar protective effects. U0126 reduces reactive oxygen species (ROS) in cells. We further demonstrate that U0126 is a direct ROS scavenger in vitro, and the oxidation products of U0126 exhibit fluorescence. Our finding that U0126 is a strong antioxidant signals caution for its future usage as a MEK inhibitor and for interpreting some previous results.
Keywords: U0126, MEK inhibitor, oxidative stress, cell death, antioxidant
MEK is a member of the Ras/Raf/MEK/ERK signaling cascade, a central intracellular pathway that is activated by a wide range of growth factors, cytokines and hormones to promote cell survival, proliferation, growth and differentiation.1 Dysregulation of the Ras/Raf/MEK/ERK signaling pathway is involved in many human diseases.2 The biological importance of MEK in cell signaling has led to the development of small molecule MEK inhibitors3 that not only revolutionize our understanding of intracellular signaling networks but also show great prospects for treating cancers.4 Currently, several MEK inhibitors are being assessed in clinical trials.5
U0126 is a small molecule MEK inhibitor, chemically known as 1,4-diamino-2,3-dicyano-1,4-bis[2-aminophenylthio]butadiene. It was first reported in 1998 as a potent and selective inhibitor of the MEK1 and MEK2 family of mitogen-activated protein kinase kinases (MAPKK), with IC50 of 72 nM for MEK 1 and 58 nM for MEK2.6 Since then, U0126 has been widely used as a MEK inhibitor and its usage has been in diverse fields from cancer,7 development,8 to neurobiology.9 The inhibitory effects of U0126 on MEK and ERK activation have been confirmed repeatedly, and treatments with U0126 have been shown to inhibit proliferation and migration of cancer cells in vivo and in vitro.10−12
The effect of U0126 on cell survival is less clear. Many studies show that U0126 treatments lead to cancer cell death, which agrees with the well-known role of the Ras/Raf/MEK/ERK pathway in supporting cell survival.13,14 For example, it has been reported that U0126 enhances apoptosis in human breast cancer MCF-7 cells,15 acute myeloid leukemia.16 and PC12 cells.17 However, a number of studies show that U0126 treatments protect neuronal cells against oxidative stress both in cell culture studies and in animal studies. For example, U0126 has been shown to protect PC12 cells,18 HT22 cells, and cortical neurons19 against oxidative stress. Pretreatment with U0126 protects cerebellar granule neurons against oxidative stress-induced potassium withdrawal.20 Intravenous administration of U0126 has been shown to protect rat hippocampus against forebrain ischemia in one study,21 and to reduce focal ischemic brain injury in hyperglycemia rats in another study.22 In these studies, the neuroprotective effect of U0126 has been attributed to its function as a MEK inhibitor, supporting a model that the Ras/Raf/MEK/ERK signaling pathway plays a key role in the neuronal death caused by oxidative stress.
However, a few studies utilizing U0126 have questioned the specificity of the drug. A recent study by Evans et al. suggests that U0126 reverses axon protection against Wallerian degeneration not by inhibiting the MEK/ERK pathway.23 Another study by Wauson et al. shows that U0126 reduces agonist-induced entry of calcium into cells in a manner independent of its ability to inhibit ERK1/2.24 While having minor off-target effects is often an unavoidable reality for many small molecule drugs, it is important to scrutinize and understand the side effect of U0126 in interpreting the results of this widely used MEK inhibitor.
When utilizing small molecules for biological studies, it is always assumed that the molecules are chemically inert. Therefore, U0126 has been generally assumed to remain intact in cells facing the oxidative stress environment while performing its function as a specific MEK inhibitor. Current technologies often cannot verify whether small molecules applied to cells have undergone chemical reactions. This is a crucial question to be addressed since the chemical reactions or the reaction products could result in unintended effects, and thus potentially alter the interpretation of the results.
In this paper, we show that U0126 acts as a potent antioxidant and protects PC12 cells against oxidative stress-induced cell death independent of its function as a MEK inhibitor. With the aid of in vitro chemical analysis, we show that U0126 serves as a direct ROS scavenger and chemical reactions can readily occur at certain biological conditions.
Results and Discussion
U0126 Protects PC-12 Cells against Hydrogen Peroxide-Induced Cell Death Independent of MEK Inhibition
In order to understand the MEK-dependent and -independent effects of U0126, we compare the effects of U0126 with several other MEK inhibitors with diverse structures including trametinib, CI1040, PD 318088, and Pimasertib, as positive controls.25 We also compare the effects of U0126 with commonly used antioxidants such as trolox and ascorbic acid, as well as U0124, an inactive analog of U01266 (Figure 1a). For all the following studies, we used previously reported drug concentrations at 10 μM for U0126,17 1 μM for trametinib,25 200 nM for CI-1040,26 200 nM for pimasertib,27 200 nM for PD318088,27 10 μM for U0124, 20 μM for trolox, and 20 μM for ascorbic acid. For cell death studies, PC12 cells were cultured in a starvation medium for 12 h before the addition of small molecule drugs or oxidative stress inducers. This is to minimize serum-induced activation of diverse intracellular signaling pathways including the PI3K/AKT and the Raf/MEK/ERK pathways, which are known to protect against cell death.
Figure 1.

U0126 protects PC12 cells against H2O2-induced cell death. (a) Chemical structures of U0126, its inactive analogue U0124, and other MEK inhibitors used in the study: trametinib, CI-1040, PD318088, and pimasertib. (b) Representative images of H2O2-induced dead cells stained by propidium iodide. These are accompanied by bright field images that show all cells. Scale bar = 100 μm. (c) U0126 treatment shows reduced cell death compared with DMSO (p < 0.002) and significantly lower death rate compared with other MEK inhibitors. U0124 shows similar, albeit to a lesser extent, protective effect. Control anti-oxidants, trolox and ascorbic acid, demonstrate significant protective effect toward oxidative stress. For each condition, the cell death percentage is computed from 75 individual images taken from 3 independent sets of experiments and each image comprises 150–250 cells (∼100 000 total number of cells). SEM error bars are depicted in the graph. (d) U0126 shows protective effect against oxidative stress induced by 0.01 units of glucose oxidase in glucose-supplemented medium for 12 h, while MEK inhibitors demonstrate similar high cell death rates as to the DMSO control. Trolox and ascorbic acid demonstrate significant protective effect toward oxidative stress. (e) Western blot of ERK phosphorylation demonstrates that the MEK inhibitors U0126, trametinib and pimasertib are effective in blocking ERK phosphorylation under complete media (left panel), while U0124 results in slight ERK inhibition compared to DMSO control. Serum starvation results in lack of ERK phosphorylation in all conditions. (f) The cell-protective effect of U0126 is concentration dependent and shows an EC50 of about 100 nM.
We first use H2O2 as the oxidative stress inducer. We found that both the H2O2 concentration and the cell-plating density drastically affected H2O2-induced cell death (Supporting Information Figure 1a). We screened series of H2O2 concentrations and cell densities and chose a condition (10 μM H2O2 and ∼100 000 cells/well for 1 h) under which the control cells showed significant (∼40%) but not complete cell death. The low cell density was used to minimize cell-to-cell contacts and dead cells were determined by propidium iodide (PI) staining. Twelve-well plates were used so that different drug experiments were carried out at the same conditions using the same batch of cells. Automated fluorescence imaging (an automated scanning of 25 images per culture well) and automated image analysis (ImageJ) were carried out to avoid any potential bias in quantifying the data.
Figure 1b,c shows that most of the MEK inhibitors induce similar or higher cell death rates than the DMSO control, while U0126 treated cultures show drastically less cell death. While this is in agreement with some previous studies that show U0126’s protective effect,18,21 previous studies have attributed the protective effect of U0126 to the inhibition of the Raf/MEK/ERK pathway. On the other hand, our results clearly show that the protective effect of U0126 is not due to its function as a MEK inhibitor, as all four other MEK inhibitors fail to show any protective effect. This is supported by the observation that its inactive analogue U0124 also protects against H2O2-induced cell death, albeit to a lesser degree. Antioxidants trolox and ascorbic acid are able to drastically suppress the cell death rates, highlighting that the cause of death for the PC-12 cells is due to the oxidative stress from H2O2. Further control experiments involving serum-starved PC12 cells without H2O2 treatment and nonstarved PC12 cells treated with 10 μM H2O2 result in very little cell death (Supporting Information Figure 1b). We note that nonstarved PC12 cells show cell death upon treatment with H2O2 at a much higher concentration of 1 mM.
We then use the glucose/glucose oxidase system to generate slow release of hydrogen peroxide in cells and in vitro instead of bolus addition.28 Upon treatment with glucose/glucose oxidase (0.01 units) for 12 h, the control cells show cell death at 71.2%. In contrast, the U0126 treated cells show significantly reduced cell death at 24.1%. Again, the MEK inhibitors CI-1040, pimasertib, and trametinib fail to show any protective effect, while the antioxidants trolox and ascorbic acid show drastic cell protection (Figure 1d). U0124 is also cell protective but not as effective as U0126. From both the H2O2 and glucose/glucose oxidase experiments, U0126 shows clear and consistent protective effects against H2O2-induced cell death, while other MEK inhibitors do not, indicating that the protective effect of U0126 is independent of its ability to inhibit the Raf/MEK/ERK pathway.
We confirm that U0126 and other MEK inhibitors prevent the activation of Raf/MEK/ER signaling pathway by antiphospho-ERK Western blot. As shown in Figure 1e (left panel), PC12 cells cultured in serum-containing medium show a strong pERK band, which completely disappears upon the addition of MEK inhibitors, U0126, Trametinib and Pimasertib. U0124 shows some but not complete inhibition of ERK activation, consisting with a previous report.29 Upon serum-starvation for 12 h, pERK is undetectable with or without drugs (Figure 1e, right panel). The lack of ERK activation in serum-starved PC12 cells also helps to rule out any difference in the inhibitory effect of MEK inhibitors. Finally, we find that the protective effect of U0126 is dose-dependent. The protective effect, as measured by the reduction of the cell death, steadily increases as its concentration increases from 10 nM to 10 μM. The half maximal effective concentration (EC50) is estimated to be about 100 nM (Figure 1f and Supporting Information Figure 1d).
U0126 Protects PC-12 Cells against Many Different Inducers of Oxidative Stress
Next, we assess the protective effect of U0126 by subjecting PC12 cells to several commonly used inducers of oxidative stress. These subsequent oxidative stressor studies were carried out with DMSO control, U0126, trametinib (as the MEK inhibitor control), and U0124.
We employ the use of blue light that has been shown to induce production of reactive oxygen species (ROS) in cells.30,31 A custom-built 4 × 3 blue light-emitting diode (LED) array corresponding to the arrangement of a 12-well plate was placed underneath the cell culture plate for 6 h inside a CO2 incubator.32 The light intensity was measured to be ∼10 mW/cm2 at the plate level for all wells. U0126 shows drastic protective effect against blue light-induced cell death, reducing cell death by an order of magnitude from 42.0% to 3.5% (Figure 2a). On the other hand, trametinib treatment induces almost complete cell death (88.9% cell death).33 U0124 also protects PC12 cells, albeit to a lesser extent, against blue light illumination.
Figure 2.

U0126 protects PC12 cells against different types of oxidative stress inducers. (a) Upon 6 h of blue light illumination at 10 mW/cm2, U0126 treatment results in a dramatic decrease in cell death (3.5%) compared to DMSO (42.0%), while trametinib sees a significant increase in cell death (88.9%). U0124, a U0126 analogue, provides some cell protective effects, with a death rate at 17.9%. (b) U0126 protects PC12 cells against oxidative stress induced by 20 mM sodium azide for 24 h. (c) U0126 results in higher cell death than DMSO upon treatment with 5 μM rotenone, but the death rate is still significantly less than that by trametinib. (d) U0126 results in slightly lower cell death than DMSO upon treatment with 2 mM paraquat for 24 h. (e) U0126 results in slightly lower cell death than DMSO upon treatment with 3.3 μM cisplatin for 24 h. For each condition, the cell death data is computed from 75 individual images taken from three different sets of experiments and each image comprises of 150–250 cells. SEM error bars are depicted in the graph.
We have also subjected PC12 cells to sodium azide-induced oxidative stresses. Sodium azide is a cytochrome oxidase inhibitor and induces oxidative stress by blocking mitochondrial electron transport.34,35 As shown in Figure 2b, U0126 exhibits significant protective effect against oxidative stresses induced by sodium azide. U0124 is also cell protective, while trametinib induces drastically more cell death compared with DMSO control.
The protective effect of U0126 against some specialized oxidative stress inducers, including (a) rotenone, a pesticide and an inhibitor of mitochondrial complex I; (b) paraquat, a herbicide and a neurotoxin; and (c) cisplatin, a DNA cross-linker, are more complex. For rotenone (Figure 2c), U0126 appears to induce more cell death than DMSO but much less than trametinib. For paraquat and cisplatin (Figure 2d,e), U0126 induces slightly less cell death than DMSO and trametinib. One possible explanation is that these specialized inducers cause cell death through different death pathway(s) from that induced by H2O2, and U0126 does not have strong protective effect against these death pathways.
U0126 Decreases the Amount of ROS in the Cell upon H2O2 Treatment
We test whether U0126 protects cells against oxidative stress by decreasing the amount of ROS present in the cell. To this end, we use dichlorodihydrofluorescein diacetate (DCHFDA), a fluorogenic dye that measures the amount of hydroxyl, peroxyl radicals, and other forms of ROS within the cell. We have used DCHFDA to measure ROS levels at two time points, 10 min and 2 h after adding hydrogen peroxide, for cells treated with DMSO, U0126, tranetimib, and U0124.
Figure 3 shows that U0126 clearly reduces the cellular ROS levels at both 10 min and 2 h as compared with the DMSO control. Trametinib, on the other hand, results in an increase of ROS levels at both time points. U0124 exhibits similar ROS-reduction effect as U0126. This result corroborates with previous results to suggest that the protective effect of U0126 is due to an antioxidant mechanism, independent of its function as a MEK inhibitor. We note that the ROS level in the control samples decreases over time, while the ROS level in tranetimib treated samples remains high after 2 h. A point of caution is that U0126 have some negligible background fluorescence without adding DCHFDA. We applied background subtraction when using the FIJI software to calculate the fluorescence intensity (Supporting Information Figure 1c)
Figure 3.

U0126 reduces H2O2-induced ROS level in PC12 cells. (a) Representative images of the green channel (DCHFDA fluorescence) at 10 min and 2 h after H2O2 addition. The fluorescence intensity is correlated with the amount of ROS in cells. All images are shown with the same intensity scale bar. (b) Quantitative measurements of the fluorescence intensity show that U0126 and U0124 are able to reduce the amount of ROS in PC-12 cells within 10 min of incubation. The ROS level is maintained low at 2 h. Trametinib increases the amount of ROS in PC-12 cells. Images are collated from three sets of individual experiments and the error bars depict ± SD. Scale bar = 100 μm.
U0126 Acts as a Potent ROS Scavenger in Vitro
The antioxidant effect of U0126 could be due to that (i) U0126 is an off-target inhibitor of ROS producing proteins or an activator of ROS reducing enzymes, or (ii) U0126 acts as a direct ROS scavenger to lower the ROS level in cells. After inspecting the chemical structure of U0126, we hypothesize that U0126 is a ROS scavenger. First, we find that U0126 does not directly react with H2O2 when mixed in vitro. When U0126 and 10 equiv of H2O2 were mixed for 3 h in methanol, there was no color change that might indicate a chemical reaction. When the reaction mixture was measured by NMR, the peaks for aromatic hydrogens did not shift as compared with the starting material (Figure 4a and Supporting Information Figure 2a). This was confirmed by mass spectra that showed no change of peak ratios and no new peaks as compared with the U0126 MS spectra (Figure 4a and Supporting Information Figure 2a). For clarity, only peaks that correspond to U0126 fragments are shown. The full MS spectra are displayed in Supporting Information. Unlike U0126, the U0124 MS spectrum exhibits obvious change after mixing with hydrogen peroxide, indicating that U0124 has reacted directly with hydrogen peroxide (Supporting Information Figure 2b).
Figure 4.

U0126 directly reacts with hydroxyl radicals produced by Fenton’s reaction and horseradish peroxidase (HRP). (a) 1H NMR and mass spectrometry show that U0126 does not react with H2O2 directly. Addition of Fe(II) results in the appearance of downfield peaks in NMR and new peaks of m/z at 362 and 378 in mass spectra. (b) Mixing U0126, H2O2, and Fe(II) in vitro (Fenton reaction) shows bright orange precipitation within 2 min. Control experiments show that mixing U0126 with Fe(II) sulfate results in a faint yellowish color after 3 h, while mixing H2O2 and Fe(II) does not induce any color change. (c) Mixing U0126, H2O2, and horseradish peroxidase in vitro produces an orange-brown precipitate within seconds. (d) Lipophilicity assay of the reaction products shows that the intense orange-brown compound in the lipophilic phase (n-octanol) as compared to the aqueous phase in the bottom layer. (e) Fluorescence emission spectra of the crude reaction mixture in the n-octanol phase and in the water phase.
Although U0126 is chemically stable when mixed with H2O2 alone, it exhibits dramatic color change when mixing with H2O2 in the presence of Fe2+, indicating a fast chemical reaction. Transition metals, iron in particular, are crucially involved in the production of free radicals in cells. In vitro, the Fe2+ ion catalyzes hydrogen peroxide decomposition into highly reactive hydroxyl and hydroperoxyl radicals, known as the Fenton reaction.36 When U0126 was mixed with H2O2 in the presence of Fe2+ (1:10:0.05 stoichiometric ratios of U0126/hydrogen peroxide/iron(II) sulfate heptahydrate with catalytic amounts of sulfuric acid), the initial colorless solution quickly turned yellow and orange precipitate started to appear within 2 min (Figure 4b). NMR spectra of the orange reaction mixture show high paramagnetism (Supporting Information Figure 3b). We then carried out a workup to remove the iron species present in solution by addition of saturated trisodium citrate.37 After removing the iron species, the 1H NMR spectrum shows that the peaks of aromatic protons shifted downfield, revealing a more electron-withdrawing environment (Figure 4a). The control experiments of (a) mixing U0126 and Fe2+ without H2O2 and (b) mixing H2O2 and Fe2+ without U0126 show much slower or negligible reaction (Figure 4b). The mass spectrum of the reaction mixture shows new peaks at m/z 335, 362, and 378 (Figure 4a and Supporting Information Figure 2c). We show several possible structures of the reaction products that correspond to the measured m/z values (Figure 4a). In particular, the two structures for m/z = 362 and 378 correspond to cyclized and oxidized products of U0126.
In the cell, the production of reactive oxygen intermediates often involves peroxidases. Here, we show that horseradish peroxidase is sufficient to oxidize U0126 in vitro. We mixed U0126 and H2O2 with horseradish peroxidase that has been shown to consume H2O2 to produce hydroxyl radicals in physiological reactions.38,39 The reaction mixture immediately changed to orange-red color and precipitates showed up within seconds before the entire solution turned brown (Figure 4c). Control experiment without U0126 did not show any color change. Another control experiment lacking H2O2 demonstrated much slower reaction kinetics, probably because horseradish peroxidase was able to convert molecular oxygen into free radical species at a much slower rate.39 This clearly demonstrates that U0126 can serve as a direct ROS scavenger, whether the source comes from the Fenton reaction or from biological enzymes.
The most notable reaction phenomenon is the appearance of orange-colored precipitates, suggesting that some reaction products are not soluble and might be fluorescent. We tested the lipophilicity of the products by incubating the predried crude mixture with a 1:1 mixture of n-octanol and water under shaking (Figure 4d). The samples collected from water and n-octanol phases were then analyzed with a fluorimeter (Figure 4e). Under the excitation wavelength of 470 nm, the two phases showed strong and distinctly different emission patterns, with the n-octanol phase peaking around 600 nm and the water phase peaking at 530 nm. By comparison, U0126 shows very weak emission at around 530–550 nm (both in water and n-octanol in separate samples). Therefore, our chemical analysis indicates that U0126 is a direct ROS scavenger and the oxidation of U0126 results in at least two species of different lipophilicity and exhibiting different wavelengths of fluorescence.
Conclusions
The current study demonstrates that U0126, a well-known and broadly used MEK inhibitor, exerts secondary effects as an antioxidant in oxidative stress-induced cell death, thus protecting cells independent of its MEK inhibitor function. This finding of U0126 as an antioxidant may help to reevaluate some past findings where the protective effects of U0126 were attributed to its MEK inhibitor functions. Although our result supports that U0126 protects cells by reducing the ROS level, it does not rule out the possibility that the reaction products of U0126 are cell protective. A better understanding of the mechanisms involved in U0126’s protective effect need further investigation. In addition, examination of the inherent chemical reactivity of small molecules used in biological contexts could be helpful in understanding its biological effects.
Methods
Materials
Hydrogen peroxide (30%, certified ACS), methanol (HPLC grade), and sulfuric acid (certified ACS) were purchased from Fisher Scientific Ltd. Iron(II) sulfate heptahydrate, glucose oxidase, pimasertib, CI-1040, PD 318088, ascorbic acid, trolox, sodium azide, cisplatin, rotenone, and paraquat were purchased from Sigma (St. Louis, MO). U0126 was purchased from Cell Signaling and MedChem Express (98% pure by NMR). U0124 and trametinib were purchased from Cell Signaling. The MEK inhibitors, U0124, and all oxidative stress inducers except hydrogen peroxide and ascorbic acid were dissolved in DMSO and stored as frozen stocks at −20 °C.
Cell Culture
PC12 cells (Neuroscreen-1 sub cell line) were used for cell death assays. For cell culture, we used F12K medium supplemented with 15% horse serum (Gibco) and 2.5% fetal bovine serum (FBS) (Gibco). All cell cultures were maintained in a standard incubator at 37 °C with 5% CO2. For cell death assays, PC12 cells were plated into 12-well plates at a cell density of ∼120 000 cells per well in regular culture medium. Six hours after plating of cells, the cell culture was exchanged to a serum starvation medium (F12K with 1.5% horse serum and 0.25% FBS) for 12–16 h before the drug experiment to minimize the base-level ERK and AKT activation by growth factors in the serum.
Cell Death Assay
PC-12 cells in a 12-well plate were separately incubated with DMSO, U0126 (10 μM), trametinib (1 μM), CI-1040 (200 nM), pimasertib (200 nM), PD318088 (200 nM), U0124 (10 μM), trolox (20 μM), and ascorbic acid (20 μM) for 1 h. A selected oxidative stress inducer was then added into the culture medium and incubated for a certain duration to induce significant but not complete cell death in control cells. We used 1 h duration for hydrogen peroxide (10 μM), 12 h for glucose/glucose oxidase (0.01 units of glucose oxidase with one-fifth of the medium exchanged to high glucose DMEM), 14 h for rotenone (5 μM), and 24 h duration for sodium azide (20 mM), paraquat (2 mM), and cisplatin (3.3 μM). Afterward, propidium iodide was added to the solution to stain dead cells. The 12-well plate was then scanned under an epifluorescence microscope (Leica DMI6000B microscope) equipped with an automatic scanning stage. Automated image analysis was conducted using imageJ built-in functions. A threshold cutoff of 10 000 was utilized in the red channel to recognize dead cells. Cells with stained red nuclei are identified as “dead cells”, while cells without stained red nuclei are identified as “live cells”. The percentage of dead cells was computed as “dead cells”/(“live cells” + “dead cells”).
Western Blot
For sample preparation, 25 000/cm2 of PC12 cells were plated on 6-well plates for 6 h. Then the cells were starved for 12–16 h either in starvation medium (F12K + 1.5% horse serum +0.25% FBS) in serum-starvation group, or in normal medium (F12K + 15% horse serum +2.5% FBS) in nonstarvation group. Cells were then treated with inhibitors for 1 h before adding H2O2. After 2 h, cells were collected directly in 100 μL protein sample buffer (#161-0737EDU, BioRad) and then denatured at 90 °C for 10 min. Individual samples of 15 μL were loaded in each lane. Western blot was then carried out following standard protocols. Primary antibodies used were pERK (#4370, Cell signaling), total ERK (#9102, Cell signaling).
Construction of a Programmable LED Device
For 6 h of blue light illumination, a 4 × 3 blue LED array was constructed by assembling 12 blue LEDs (B4304H96, Linrose Electronics) on a breadboard. The LED device was controlled via a Labview program through a data acquisition board (National Instrument-DAQ, PCI-6035E). The light intensity of each LED was further controlled through a tunable resistor. The breadboard was hosted in an aluminum box, and a light diffuser film was positioned above the LED array to make the light intensity homogeneous in the defined area. To avoid cross illumination of different wells, separating barriers were placed around each LED. The light intensity at the cell culture plate was measured by a power meter (Newark, 1931-C). The LED array was placed inside the incubator with the 12-well plate placed on top for blue light-induced oxidative stress.
Intracellular ROS Level Assay
Similar to the cell death assay, PC12 cells were incubated with DMSO, U0126 (10 μM), trametinib (1 μM), and U0124 (10 μM) for 30 min. Then, 10 μM hydrogen peroxide was added into the culture medium for 10 min or 2 h. Subsequently, 20 μM dichlorodihydrofluoroscein diacetate (DCHFDA) was added into the culture medium and incubated for 30 min. Finally, the entire medium was then removed and replaced with PBS solution for imaging. Consistent imaging conditions were used to sample the fluorescence levels in the GFP channel to ensure reliability in quantification of ROS levels. Image analysis was conducted using FIJI 3D Object Counter.
Mass Spectrometry
The mass spectrometry was conducted via direct injection into the LC-MS (Thermo LTQ XL ion trap, Agilent 1100 HPLC-MS) at the Stanford University Mass Spectrometry Center. Analysis of m/z from 50 to 500 was obtained, and the solvent used in the studies was methanol.
Nuclear Magnetic Resonance
Proton nuclear magnetic resonance (1H NMR) spectra were recorded on Varian Inova 500 spectrometers operating at 500 MHz. Chemical shifts are reported in parts per million (ppm) with respect to residual protonated solvent for 1H (CH3OH = δ 4.87 and δ 3.31).
Fluorescence Measurement
The fluorescence emission spectra were performed on the Fluorolog 3 instrument in the Optics Facility of the Stanford University Chemistry Department. Excitation wavelength was kept at 470 nm. Solutions of both crude reaction mixture and U0126 were at 20 μM.
Acknowledgments
We would like to thank Prof. Scott Dixon for his suggestions in designing some experiments and for his valuable input in understanding cell death. We are grateful to Prof. Justin du Bois for his kind advice and usage of facilities in his lab, and Justin Su and Darren Finkelstein for their help.
Supporting Information Available
Cell death data from control experiments (Figure S1), mass spectrometry data (Figure S2), and 1H NMR data (Figure S3). This material is available free of charge via the Internet at http://pubs.acs.org.
Author Contributions
Q.O., S.G., K.Z., and B.C. designed experiments. Q.O. and B.C. wrote the paper. Q.O. and S.G. conducted experiments and analyzed data.
Q.O. was supported by the National Science Scholarship (Ph.D.) from A*STAR Singapore. This work is supported by the United States National Institutes of Health (DP2-NS082125) and the Packard fellowship to B.C.
The authors declare no competing financial interest.
Funding Statement
National Institutes of Health, United States
Supplementary Material
References
- Peyssonnaux C.; Eychène A. (2001) The Raf/MEK/ERK pathway: New concepts of activation. Biol. Cell 93, 53–62. [DOI] [PubMed] [Google Scholar]
- Dhillon A. S.; Hagan S.; Rath O.; Kolch W. (2007) MAP kinase signalling pathways in cancer. Oncogene 26, 3279–3290. [DOI] [PubMed] [Google Scholar]
- McCubrey J. A.; Steelman L. S.; Abrams S. L.; Chappell W. H.; Russo S.; Ove R.; Milella M.; Tafuri A.; Lunghi P.; Bonati A.; Stivala F.; Nicoletti F.; Libra M.; Martelli A. M.; Montalto G.; Cervello M. (2010) Emerging MEK inhibitors. Expert Opin. Emerging Drugs 15, 203–223. [DOI] [PubMed] [Google Scholar]
- Zhang J.; Yang P. L.; Gray N. S. (2009) Targeting cancer with small molecule kinase inhibitors. Nat. Rev. Cancer 9, 28–39. [DOI] [PMC free article] [PubMed] [Google Scholar]
- Zhao Y.; Adjei A. A. (2014) The clinical development of MEK inhibitors. Nat. Rev. Clin. Oncol. 11, 385–400. [DOI] [PubMed] [Google Scholar]
- Favata M. F.; Horiuchi K. Y.; Manos E. J.; Daulerio A. J.; Stradley D. A.; Feeser W. S.; Van Dyk D. E.; Pitts W. J.; Earl R. A.; Hobbs F.; Copeland R. A.; Magolda R. L.; Scherle P. A.; Trzaskos J. M. (1998) Identification of a novel inhibitor of mitogen-activated protein kinase kinase. J. Biol. Chem. 273, 18623–18632. [DOI] [PubMed] [Google Scholar]
- Davies H.; Bignell G. R.; Cox C.; Stephens P.; Edkins S.; Clegg S.; Teague J.; Woffendin H.; Garnett M. J.; Bottomley W.; Davis N.; Dicks E.; Ewing R.; Floyd Y.; Gray K.; Hall S.; Hawes R.; Hughes J.; Kosmidou V.; Menzies A.; Mould C.; Parker A.; Stevens C.; Watt S.; Hooper S.; Wilson R.; Jayatilake H.; Gusterson B. A.; Cooper C.; Shipley J.; Hargrave D.; Pritchard-Jones K.; Maitland N.; Chenevix-Trench G.; Riggins G. J.; Bigner D. D.; Palmieri G.; Cossu A.; Flanagan A.; Nicholson A.; Ho J. W. C.; Leung S. Y.; Yuen S. T.; Weber B. L.; Seigler H. F.; Darrow T. L.; Paterson H.; Marais R.; Marshall C. J.; Wooster R.; Stratton M. R.; Futreal P. A. (2002) Mutations of the BRAF gene in human cancer. Nature 417, 949–954. [DOI] [PubMed] [Google Scholar]
- Hawkins T. A.; Cavodeassi F.; Erdélyi F.; Szabó G.; Lele Z. (2008) The small molecule Mek1/2 inhibitor U0126 disrupts the chordamesoderm to notochord transition in zebrafish. BMC Dev. Biol. 8, 42. [DOI] [PMC free article] [PubMed] [Google Scholar]
- Nordström E. K.; Luhr K. M.; Ibáñez C.; Kristensson K. (2005) Inhibitors of the mitogen-activated protein kinase kinase 1/2 signaling pathway clear prion-infected cells from PrPSc. J. Neurosci. 25, 8451–8456. [DOI] [PMC free article] [PubMed] [Google Scholar]
- Park S. L.; Won S. Y.; Song J.-H.; Kim W.-J.; Moon S.-K. (2014) EPO gene expression induces the proliferation, migration and invasion of bladder cancer cells through the p21WAF1-mediated ERK1/2/NF-κB/MMP-9 pathway. Oncol. Rep. 32, 2207–2214. [DOI] [PubMed] [Google Scholar]
- Huynh N.; Liu K. H.; Baldwin G. S.; He H. (2010) P21-activated kinase 1 stimulates colon cancer cell growth and migration/invasion via ERK- and AKT-dependent pathways. Biochim. Biophys. Acta 1803, 1106–1113. [DOI] [PubMed] [Google Scholar]
- Horiuchi H.; Kawamata H.; Furihata T.; Omotehara F.; Hori H.; Shinagawa Y.; Ohkura Y.; Tachibana M.; Yamazaki T.; Ajiki T.; Kuroda Y.; Fujimori T. (2004) A MEK inhibitor (U0126) markedly inhibits direct liver invasion of orthotopically inoculated human gallbladder cancer cells in nude mice. J. Exp. Clin. Cancer Res. 23, 599–606. [PubMed] [Google Scholar]
- Xia Z.; Dickens M.; Raingeaud J. l; Davis R. J.; Greenberg M. E. (1995) Opposing Effects of ERK and JNK-p38 MAP Kinases on Apoptosis. Science 270, 1326–1331. [DOI] [PubMed] [Google Scholar]
- Chen J.; Fujii K.; Zhang L.; Roberts T.; Fu H. (2001) Raf-1 promotes cell survival by antagonizing apoptosis signal-regulating kinase 1 through a MEK-ERK independent mechanism. Proc. Natl. Acad. Sci. U. S. A. 98, 7783–7788. [DOI] [PMC free article] [PubMed] [Google Scholar]
- Ye J.; Li A.; Liu Q.; Wang X.; Zhou J. (2005) Inhibition of mitogen-activated protein kinase kinase enhances apoptosis induced by arsenic trioxide in human breast cancer MCF-7 cells. Clin. Exp. Pharmacol. Physiol. 32, 1042–1048. [DOI] [PubMed] [Google Scholar]
- Kerr A. H. J.; James J. A.; Smith M. A.; Willson C.; Court E. L.; Smith J. G. (2003) An investigation of the MEK/ERK inhibitor U0126 in acute myeloid leukemia. Ann. N.Y. Acad. Sci. 1010, 86–89. [DOI] [PubMed] [Google Scholar]
- Jiang H.; Zhang L.; Koubi D.; Kuo J.; Groc L.; Rodriguez A. I.; Hunter T. J.; Tang S.; Lazarovici P.; Gautam S. C.; Levine R. A. (2005) Roles of Ras-Erk in apoptosis of PC12 cells induced by trophic factor withdrawal or oxidative stress. J. Mol. Neurosci. 25, 133–140. [DOI] [PubMed] [Google Scholar]
- Magliaro B. C.; Saldanha C. J. (2009) Clozapine protects PC-12 cells from death due to oxidative stress induced by hydrogen peroxide via a cell-type specific mechanism involving inhibition of extracellular signal-regulated kinase phosphorylation. Brain Res. 1283, 14–24. [DOI] [PMC free article] [PubMed] [Google Scholar]
- Satoh T.; Nakatsuka D.; Watanabe Y.; Nagata I.; Kikuchi H.; Namura S. (2000) Neuroprotection by MAPK/ERK kinase inhibition with U0126 against oxidative stress in a mouse neuronal cell line and rat primary cultured cortical neurons. Neurosci. Lett. 288, 163–166. [DOI] [PubMed] [Google Scholar]
- Subramaniam S.; Zirrgiebel U.; Von Bohlen Und Halbach O.; Strelau J.; Laliberté C.; Kaplan D. R.; Unsicker K. (2004) ERK activation promotes neuronal degeneration predominantly through plasma membrane damage and independently of caspase-3. J. Cell Biol. 165, 357–369. [DOI] [PMC free article] [PubMed] [Google Scholar]
- Namura S.; Iihara K.; Takami S.; Nagata I.; Kikuchi H.; Matsushita K.; Moskowitz M. A.; Bonventre J. V.; Alessandrini A. (2001) Intravenous administration of MEK inhibitor U0126 affords brain protection against forebrain ischemia and focal cerebral ischemia. Proc. Natl. Acad. Sci. U. S. A. 98, 11569–11574. [DOI] [PMC free article] [PubMed] [Google Scholar]
- Farrokhnia N.; Ericsson A.; Terént A.; Lennmyr F. (2008) MEK-inhibitor U0126 in hyperglycaemic focal ischaemic brain injury in the rat. Eur. J. Clin. Invest. 38, 679–685. [DOI] [PubMed] [Google Scholar]
- Evans C.; Cook S. J.; Coleman M. P.; Gilley J.; Arai K. (2013) MEK inhibitor U0126 reverses protection of axons from Wallerian degeneration independently of MEK-ERK signaling. PLoS One 8, e76505. [DOI] [PMC free article] [PubMed] [Google Scholar]
- Wauson E. M.; Guerra M. L.; Barylko B.; Albanesi J. P.; Cobb M. H. (2013) Off-target effects of MEK inhibitors. Biochemistry 52, 5164–5166. [DOI] [PMC free article] [PubMed] [Google Scholar]
- Watanabe M.; Sowa Y.; Yogosawa M.; Sakai T. (2013) Novel MEK inhibitor trametinib and other retinoblastoma gene (RB)-reactivating agents enhance efficacy of 5-fluorouracil on human colon cancer cells. Cancer Sci. 104, 687–693. [DOI] [PMC free article] [PubMed] [Google Scholar]
- Li Q.; Kannan A.; DeMayo F. J.; Lydon J. P.; Cooke P. S.; Yamagishi H.; Srivastava D.; Bagchi M. K.; Bagchi I. C. (2011) The antiproliferative action of progesterone in uterine epithelium is mediated by Hand2. Science 331, 912–916. [DOI] [PMC free article] [PubMed] [Google Scholar]
- Zhang Y.; Xu D.; Wang X.; Lu M.; Gao B.; Qiao X. (2014) Screening of kinase inhibitors targeting BRAF for regulating autophagy based on kinase pathways. Mol. Med. Rep. 9, 83–90. [DOI] [PubMed] [Google Scholar]
- Marinho H. S.; Cyrne L.; Cadenas E.; Antunes F. (2013) H2O2 delivery to cells: steady-state versus bolus addition. Methods Enzymol. 526, 159–173. [DOI] [PubMed] [Google Scholar]
- Duncia J. V.; Santella J. B.; Higley C. A.; Pitts W. J.; Wityak J.; Frietze W. E.; Rankin F. W.; Sun J. H.; Earl R. A.; Tabaka A. C.; Teleha C. A.; Blom K. F.; Favata M. F.; Manos E. J.; Daulerio A. J.; Stradley D. A.; Horiuchi K.; Copeland R. A.; Scherle P. A.; Trzaskos J. M.; Magolda R. L.; Trainor G. L.; Wexler R. R.; Hobbs F. W.; Olson R. E. (1998) MEK inhibitors: the chemistry and biological activity of U0126, its analogs, and cyclization products. Bioorg. Med. Chem. Lett. 8, 2839–2844. [DOI] [PubMed] [Google Scholar]
- Godley B. F.; Shamsi F. A.; Liang F.-Q.; Jarrett S. G.; Davies S.; Boulton M. (2005) Blue light induces mitochondrial DNA damage and free radical production in epithelial cells. J. Biol. Chem. 280, 21061–21066. [DOI] [PubMed] [Google Scholar]
- Osborne N. N.; Li G.-Y.; Ji D.; Mortiboys H. J.; Jackson S. (2008) Light affects mitochondria to cause apoptosis to cultured cells: possible relevance to ganglion cell death in certain optic neuropathies. J. Neurochem. 105, 2013–2028. [DOI] [PubMed] [Google Scholar]
- Zhang K.; Duan L.; Ong Q.; Lin Z.; Varman P. M.; Sung K.; Cui B. (2014) Light-mediated kinetic control reveals the temporal effect of the Raf/MEK/ERK pathway in PC12 cell neurite outgrowth. PLoS One 9, e92917. [DOI] [PMC free article] [PubMed] [Google Scholar]
- Tong Z.; Singh G.; Rainbow A. J. (2002) Sustained activation of the extracellular signal-regulated kinase pathway protects cells from photofrin-mediated photodynamic therapy. Cancer Res. 62, 5528–5535. [PubMed] [Google Scholar]
- Bogucka K.; Wojtczak L. (1966) Effect of sodium azide on oxidation and phosphorylation processes in rat-liver mitochondria. Biochim. Biophys. Acta, Enzymol. Biol. Oxid. 122, 381–392. [Google Scholar]
- Bennett M. C.; Mlady G. W.; Kwon Y.-H.; Rose G. M. (2002) Chronic In Vivo Sodium Azide Infusion Induces Selective and Stable Inhibition of Cytochrome c Oxidase. J. Neurochem. 66, 2606–2611. [DOI] [PubMed] [Google Scholar]
- Koppenol W. H. (1993) The centennial of the Fenton reaction. Free Radicals Biol. Med. 15, 645–651. [DOI] [PubMed] [Google Scholar]
- Bates G. W.; Billups C.; Saltman P. (1967) The Kinetics and Mechanism of Iron(III) Exchange between Chelates and Transferrin. I. the Complexes of Citrate and Nitrilotriacetic Acid. J. Biol. Chem. 242, 2810–2815. [PubMed] [Google Scholar]
- Chen S. X.; Schopfer P. (1999) Hydroxyl-radical production in physiological reactions. A novel function of peroxidase. Eur. J. Biochem. 260, 726–735. [DOI] [PubMed] [Google Scholar]
- Berglund G. I.; Carlsson G. H.; Smith A. T.; Szöke H.; Henriksen A.; Hajdu J. (2002) The catalytic pathway of horseradish peroxidase at high resolution. Nature 417, 463–468. [DOI] [PubMed] [Google Scholar]
Associated Data
This section collects any data citations, data availability statements, or supplementary materials included in this article.