

Abstract
The aim of this study was to estimate the total number of Sertoli and Leydig cells in testes from male subjects across the human lifespan, using an optimized stereological method for cell-counting. In comparison with many other organs, estimation of the total cell numbers in the testes is particularly sensitive to methodological problems. Therefore, using the optical fractionator technique and a sampling design specifically optimized for human testes, we estimated the total number of Sertoli and Leydig cells in the testes from 26 post mortem male subjects ranging in age from 16 to 80 years. The mean unilateral total number of Sertoli cells was 407 × 106 [range: 86 × 106 to 665 × 106, coefficient of variation (CV) = 0.33], and the mean unilateral total number of Leydig cells was 99 × 106 (range: 47 × 106 to 245 × 106, CV = 0.48). There was a significant decline in the number of Sertoli cells with age; no such decline was found for Leydig cells. Quantitative stereological analysis of post mortem tissue may help understand the influence of age or disease on the number of human testicular cells.
Keywords: human testis, Leydig cells, Sertoli cells, stereology
Introduction
The mammalian testis has two distinct functional compartments known as the seminiferous tubules and the interstitium; whereas spermatogenesis arises in the seminiferous tubules, androgen biosynthesis and paracrine secretion occurs in the interstitium. Spermatogenesis is highly dependent on autocrine and paracrine communication among a variety of different cell types in the two testicular compartments. The main function of Sertoli cells, which are located in the seminiferous tubules, is to nurture developing sperm cells through the stages of spermatogenesis. Sertoli cells also act as phagocytes, consuming residual cytoplasm from the process of spermiogenesis. The tight junctions of Sertoli cells form the blood–testis barrier, a structure that partitions the interstitial blood compartment from the adluminal compartment of the seminiferous tubules, making this compartment an immune-privileged site. As such, Sertoli cells are positioned to control the passage of blood-borne nutrients, hormones and exogenous substances into the tubules. Sertoli cells are also responsible for establishing and maintaining the spermatogonial stem cell niche, promoting the renewal of the stem cells and their differentiation into mature germ cells that progress stepwise through the complex process of spermatogenesis, ultimately to be released as spermatozoa. The interstitial space between the seminiferous tubules consists of Leydig cells, macrophages, perivascular smooth muscle cells and vascular endothelial cells. The main function of Leydig cells, which lie adjacent to the seminiferous tubules, is to produce and secrete androgens. Hormone production in Leydig cells is highly regulated by feedback between luteinizing hormone (LH) and LH-releasing hormone. Observations suggest that aging does not change LH concentration and number of LH receptors on Leydig cells, but is associated with declining mitochondrial volume and smooth endoplasmic reticulum volume, as well as reduced testosterone production (Midzak et al. 2009).
An important aspect of modern biology is concerned with extracting quantitative information about the content, arrangement and connectivity of organs, cells and cellular components. This information, however, is often obtained from histological specimens, examined as flat, two-dimensional images or projections of three-dimensional objects, which leads to a number of problems. Conventional quantification methods involve assumptions about the size and/or shape of the sectioned profiles (e.g. that all cells or organelles of interest are spherical and of equal size). Such assumptions, however, are seldom true, and may lead to systematic biases that cannot be readily corrected. Instead of attempting to make distributions of real objects fit into particular geometric models, stereological methods are designed to quantify parameters without making inappropriate assumptions about the shape, size, orientation or distribution of the counted objects. This alternative approach to cell-counting has revolutionized quantitative estimation and is now the technique of choice for extracting quantities from three-dimensional tissue sections (Gundersen et al. 1988). The optical fractionator has proven to be a highly efficient stereological method for estimating the total number of cells in diverse organs and tissues, including the testes (West et al. 1991; Petersen et al. 1996; Petersen & Pakkenberg, 2000). The aim of this study was to use an optimized fractionator method to obtain the total number of Sertoli and Leydig cells in a post mortem collection of 26 testes from males, extending over various age groups.
Materials and methods
Subjects
One testis was sampled post mortem from each of 26 males (16–80 years old) who had died suddenly and unexpectedly. Twelve of the testes had been the material from a pilot study (Petersen & Pakkenberg, 2000). Twenty-two were obtained at the Department of Forensic Medicine, Copenhagen University, and four were from the Department of Pathology, Bispebjerg Hospital. Right or left testis was chosen systematically with a random start between right or left. Two testes had to be replaced for technical reasons, leaving 15 right testes and 11 left. The average weight of the right testes was 19.2 g, which was not statistically significant from the average 18.1 g of the left testes, P = 0.41. The subjects died from accidents/sudden death (n = 12), suicide (n = 3), epilepsy (n = 2), stroke/sudden intracranial bleeding (n = 6) and acute myocardial infarction (n = 3). Autopsy showed that three had steatosis hepatitis, but none had liver cirrhosis, nor were there any cases of known drug abuse. One suicide victim aged 47 years had suffered from amyloid lateral sclerosis, and one accident victim aged 57 years suffered from non-insulin-dependent diabetes.
Optical fractionator technique
The fractionator involves sampling through systematic uniform random sampling (SURS) with a known and predetermined probability based on selected fractions, specifically section sampling fraction (ssf), area sampling fraction (asf) and height sampling fraction (hsf). Ssf refers to the fraction of sections to be sampled within the entire set of sections containing the region of interest (ROI). The method is as described previously (Petersen & Pakkenberg, 2000); in brief, the sampling was further subdivided into several subsampling steps before estimation. In each sampled section, cell counts were performed with optical disectors using counting frames placed at regular fixed intervals in the x,y-plane (xy-step) of the delineated ROIs. The optical disector counting equipment consisted of a BH-2 Olympus microscope with a high numerical aperture (= 1.4), 100 × oil immersion objective, a motorized stage, and an electronic microcator with digital readout for measuring movements in the z-plane with a precision of 0.5 μm. Optical disectors were superimposed onto a high-resolution color monitor for the actual counting. The plane of focus was moved up or down within a thick tissue section, and all Sertoli and Leydig cells were counted manually (total number of counted cells = ΣQ−). The optical disectors were sampled in a known fraction of each section according to computer-generated random pattern. The area of the unbiased counting frame of the disector was known relative to the area associated with each movement in x–y directions, providing a known asf. Furthermore, the hsf was known relative to the thickness of the sections, given that the optical disector had a constant height. The total number of cells (N) in the ROI was equal to the reciprocals of all sampling fractions multiplied by ΣQ− (Gundersen, 1986; Pakkenberg & Gundersen, 1988; Riise & Pakkenberg, 2011).
Tissue preparation and sampling
The testis was collected within 72 h post mortem, and fixed either in a solution consisting of 20 mL 40% formaldehyde, 4 mL acetic acid and 76 mL water (19 testes); or in Stieve's fixative (mercuric chloride, 20 mL 40% formaldehyde, 4 mL acetic acid and 76 mL water; seven testes). Each testis was first cut into 4-mm-thick slabs (resulting in a total of eight–12 slabs); every second or third slab was sampled, and cut into 4-mm-thick bars (resulting in a total of six–10 bars). Next, every second or third bar was sampled, and cut into cubes (resulting in a total of eight–10 cubes), and finally every fourth to six cube was sampled. Sampled tissue blocks were dehydrated in alcohol and embedded in 2-hydroxy-methacrylate (Technovit 7100®). Blocks of methacrylate, each containing eight–10 cubes of testicular tissue, were cut into 40-μm-thick sections and stained with Hematoxylin & Eosin to identify Leydig and Sertoli cells. Between six and 10 sections were randomly sampled in a systematic manner from each testis for analysis by the optical fractionator technique.
Identification of cell type
Sertoli cells were identified in the seminiferous tubules by their pale, invaginated, irregular nuclei with a prominent nucleolus. Leydig cells were identified in the interstitium as relatively large, ovoid-shaped cells with an eccentric nucleus containing a prominent nucleolus and peripherally localized chromatin (Fig.1). Due to long-term fixation in fixative and methacrylate embedding media we were unable to use immunohistochemical stains, which we would have preferred. However, after several pilot studies, Hematoxylin & Eosin were chosen to best identify Leydig and Sertoli cells using strict morphological criteria.
Figure 1.
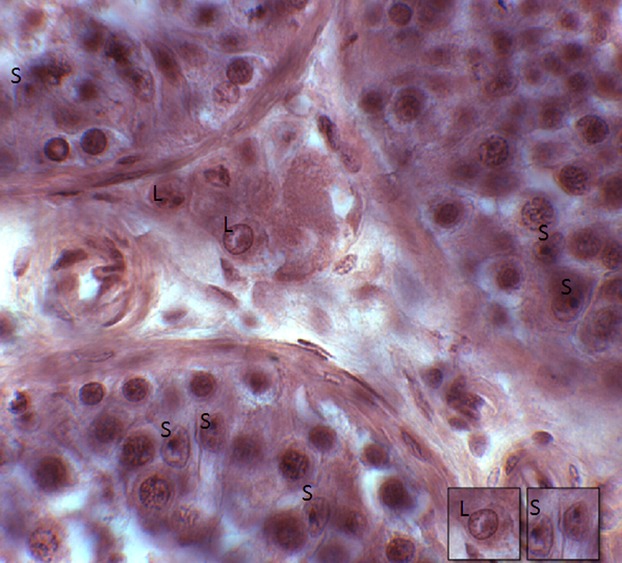
Sertoli cells (S) were identified in the seminiferous tubules by their pale, invaginated, irregular nuclei with a prominent nucleolus. Leydig cells (L) were identified in the interstitium as relatively large, ovoid-shaped cells with an eccentric nucleus containing a prominent nucleolus and peripherally localized chromatin.
Calculation of cell number
The total number of cells per testis was calculated as:
where sf = slab sampling fraction, bf = bar sampling fraction, cf = cube sampling fraction, ssf = section sampling fraction, asf = area sampling fraction, hsf = height sampling fraction and ΣQ− = total cell count. Counting was performed using cast software (Visiopharm, Hørsholm, Denmark). A disector height of 15 μm was chosen, and about 150 cells of each type were counted per testis using a frame area of 600 μm2 for Sertoli cells and 2700 μm2 for the less abundant Leydig cells.
Statistical analysis
Correlations between Sertoli cell number, Leydig cell number and testicular weight with age were calculated as Pearson's correlation coefficient (r). The precision of estimates, known as the coefficient of error (CE), describes the variation from the true value introduced by the observer; this precision can be predicted as the sampling variance related to noise (VARnoise) and to SURS (VARSURS). VARnoise is the variance of the counted cells during total cell number estimation, and represents the ‘noise’ introduced by the random positioning of disectors; it indicates how much the estimate might change if the disectors had fallen in another random position (Gundersen et al. 1999). In contrast, VARSURS refers to the variance introduced by SURS; it describes the uncertainty introduced into the sampling design due to repeated estimates of different sections that vary from each other. The final CE (N) was calculated as:
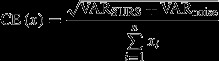 |
CE was considered optimal when it was approximately half or less of the observed inter-individual variance [the coefficient of variation (CV) = SD/mean].
Results
The unilateral total mean number of Sertoli cells per testis was 407 × 106 (range: 86 × 106 to 665 × 106, CV = 0.33), and the unilateral total mean number of Leydig cells was 99 × 106 (range: 47 × 106 to 245 × 106, CV = 0.48). The CV at the sampling level of cubes was 0.04 for Sertoli cells and 0.22 for Leydig cells. Figures2 and 3 show the number of Sertoli cells and Leydig cells with increasing age. There was a significant negative correlation between the total number of Sertoli cells (r = −0.49, P = 0.01) with increasing age, but no such correlation for the total number of Leydig cells (r = 0.17, P = 0.42). Intra-subject numbers of Leydig and Sertoli cells did not significantly correlate (r = −0.18, P = 0.76), as shown in Fig.4. Mean unilateral testicular weight was 19 g (range: 9–25 g, CV = 0.04). There was no significant correlation between testicular weight and either the total number of Sertoli cells (r = 0.27, P = 0.19) or the Leydig cell numbers (r = 0.09, P = 0.65). At the scale of the 4 × 4 × 4 mm3 sampled cubes, Leydig cells had a more pronounced heterogeneity in abundance than did Sertoli cells. There was no significant correlation between testicular weight and age (r = −0.04, P = 0.40; Fig.5). The two subjects who had been taking anti-epileptic drugs had normal numbers of Sertoli and Leydig cells.
Figure 2.
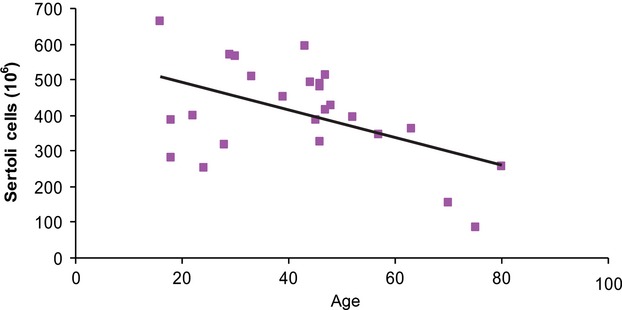
Sertoli cell number per testis (106) vs. age. A significant negative correlation was found between the number of Sertoli cells and age.
Figure 3.
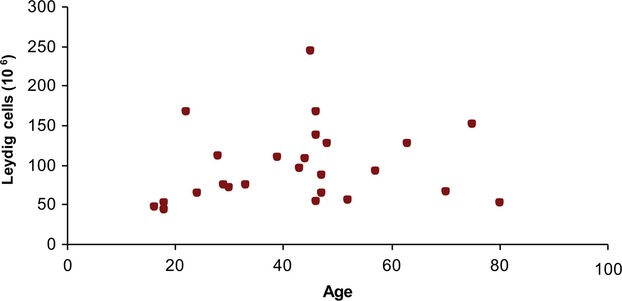
Leydig cell number per testis (106) vs. age. No correlation was found between the number of Leydig cells and age.
Figure 4.
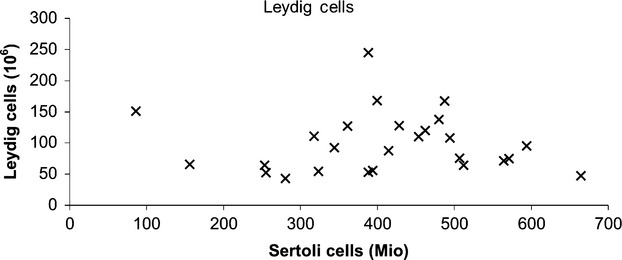
Sertoli cell number vs. Leydig cell number per testis. There was no significant correlation between number of Leydig cells and number of Sertoli cells. Mio = 106.
Figure 5.

Testis weight vs. age. There was no significant correlation between testicular weight and age.
Discussion
Conflicting findings exist regarding the total number of Sertoli and Leydig cells in human testes. Most studies quantifying cell abundances in the testis have been performed by profile-counting in semi-thin sections, measurement of relative areas or two-dimensional ratios of profiles. Based on assumptions about shape and/or size of cells, various methods of mathematical correction have been applied to correct for biases in two-dimensional profile-counting designs (Wreford, 1995; Coggeshall & Lekan, 1996). Animal studies comparing assumption-based methods with stereological methods without assumptions of shape or shrinkage show that the former methods may result in severely biased estimates, such that results are influenced by factors such as different tissue shrinkage, and cell sizes or shape. This methodological comparison indicated a 32% overestimation by two-dimensional methods of Leydig cell numbers in rat testes (Mendis-Handagama & Ewing, 1990; Mendis-Handagama, 1992). Semi-quantitative studies estimating cell numbers from two-dimensional profiles are also difficult to interpret. Here, estimates of total cell numbers in the human testis have varied from 400 to 800 × 106 for Leydig cells and from 390 to 3700 × 106 for Sertoli cells (Kaler & Neaves, 1978; Neaves et al. 1985; Cortes et al. 1987; Paniagua et al. 1987a). Compared with many other organs, therefore, the testes are thus particularly sensitive to methodological problems in the estimation of total cell numbers, especially in the case of Sertoli cells.
As expected, we found an inverse correlation between age and the total number of Sertoli cells. This is in line with previous reports showing decreased numbers of Sertoli cell number with age (Harbitz, 1973; Johnson et al. 1984; Paniagua et al. 1987b), but no corresponding change in germ cell/Sertoli cell ratio (Johnson, 1986). Insofar as Sertoli cells are supportive of the spermatogonial stem cell niche, this decline may contribute to declining sperm viability and fecundity with age. Most authors also report a decrease in the number and volume of Leydig cells with age (Harbitz, 1973; Kaler & Neaves, 1978; Neaves et al. 1985; Paniagua et al. 1987b). This stands in contrast with our finding for total number of Leydig cells, which did not decline with age. These conflicting results could be explained by differences in subject characteristics, but seem more likely to reflect the differences in applied counting methods; studies from other groups did not employ the present stereological approach. Our results, however, are in line with our own earlier post mortem stereological pilot study of testes from eight males aged younger than 30 years and six males older than 50 years; this material comprised nearly half of the present extended study in 26 subjects. In that pilot study, we had found the Sertoli cell number to be 430 × 106 in the younger subgroup, vs. only 266 × 106 Sertoli cells in the older subgroup. Likewise, the Leydig cell number was 117 × 106 in the younger group, vs. 83 × 106 Leydig cells in men older than 50 years, a decline that was not statistically significant (Petersen & Pakkenberg, 2000). The range in that study of the numbers of Sertoli cells (86 × 106 to 665 × 106) and Leydig cells (47 × 106 to 245 × 106) are thus within the same range as in the present larger study.
We counted Leydig cells on the basis of morphology. Because all counted cell nuclei showed the characteristic features of a Leydig cell, it is therefore unlikely that the Leydig cells were mis-identified in the older group due to age-related changes in morphology. In addition, it might be objected that our results could be biased due to comorbidity and medication, for example, anti-epileptic treatment. Indeed, the two subjects with epilepsy were taking anti-epileptic drugs that may impair fertility (Gates, 2004; Isojarvi et al. 2004). Nonetheless, their total numbers of Sertoli cells were close to the mean for all subjects (388 and 507 × 106), and close to the values expected from the regression of Sertoli cell numbers with age. The Leydig cell numbers in these two subjects were only slightly lower than the overall mean (53 and 75 × 106).
Because the present study is cross-sectional, we cannot conclude that the reduction in cell number with age is in fact due to age, or rather a secular effect. However, as only one of the two cell populations declined over time, the secular effect is likely of only minor importance. We found no significant correlation between total numbers of Sertoli or Leydig cells and testis weight, suggesting that these cell populations may not significantly contribute to the weight of this organ. Although we were a little surprised to find a lack of correlation between the numbers of Sertoli and Leydig cells, this could be explained by the substantially different functions of these two cell types.
Concluding remarks
The unilateral number of Sertoli cells in male testes ranges from ∼85 × 106 to 670 × 106, and the Leydig cell numbers from ∼45 × 106 to 250 × 106, with a high biological variance in both populations. Quantitative stereological analysis of post mortem tissue may help understand the influence of age or disease on human testicular cell populations. Quantitative studies based on unbiased stereological principles afford more reliable estimates of cell populations in human testes.
Ethics statement
The project was approved by the ethical committee for Copenhagen and Frederiksberg municipalities (005/96).
Acknowledgments
The authors gratefully acknowledge the important technical assistance contributed by Hans Jørgen Jensen, and the inspiring scientific input and help provided by Dr Aleksander Giwercman. The professional proof-reading of the manuscript by Inglewood Biomedical Editing is also acknowledged.
Disclosure
The authors declare no financial conflicts of interest, and no other potential competing interests of a professional or personal nature relevant to this publication.
Author contributions
Peter Meidahl Petersen contributed to the planning and design of the study, performed the tissue samplings and the cell-counting, has been involved in the data analyses and has substantially written the manuscript. Karina Seierøe gathered information about the subjects, and also contributed by reviewing and editing the manuscript. Bente Pakkenberg has contributed to the planning and design of the study, to the data analyses, and to the writing and reviewing of the manuscript.
References
- Coggeshall RE. Lekan HA. Methods for determining numbers of cells and synapses: a case for more uniform standards of review. J Comp Neurol. 1996;364:6–15. doi: 10.1002/(SICI)1096-9861(19960101)364:1<6::AID-CNE2>3.0.CO;2-9. [DOI] [PubMed] [Google Scholar]
- Cortes D. Muller J. Skakkebaek NE. Proliferation of Sertoli cells during development of the human testis assessed by stereological methods. Int J Androl. 1987;10:589–596. doi: 10.1111/j.1365-2605.1987.tb00358.x. [DOI] [PubMed] [Google Scholar]
- Gates JR. Epilepsy versus antiepileptic drugs and gonadal function in men. Neurology. 2004;62:174–175. doi: 10.1212/wnl.62.2.174. [DOI] [PubMed] [Google Scholar]
- Gundersen HJ. Stereology of arbitrary particles. A review of unbiased number and size estimators and the presentation of some new ones, in memory of William R. Thompson. J Microsc. 1986;143:3–45. [PubMed] [Google Scholar]
- Gundersen HJ. Bendtsen TF. Korbo L, et al., editors. Some new, simple and efficient stereological methods and their use in pathological research and diagnosis. APMIS. 1988;96:379–394. doi: 10.1111/j.1699-0463.1988.tb05320.x. [DOI] [PubMed] [Google Scholar]
- Gundersen HJ. Jensen EB. Kieu K, et al., editors. The efficiency of systematic sampling in stereology – reconsidered. J Microsc. 1999;193:199–211. doi: 10.1046/j.1365-2818.1999.00457.x. [DOI] [PubMed] [Google Scholar]
- Harbitz TB. Morphometric studies of the Sertoli cells in elderly men with special reference to the histology of the prostate. An analysis in an autopsy series. Acta Pathol Microbiol Scand A. 1973;81:703–714. doi: 10.1111/j.1699-0463.1973.tb03563.x. [DOI] [PubMed] [Google Scholar]
- Isojarvi JI. Lofgren E. Juntunen KS, et al., editors. Effect of epilepsy and antiepileptic drugs on male reproductive health. Neurology. 2004;62:247–253. doi: 10.1212/01.wnl.0000098936.46730.64. [DOI] [PubMed] [Google Scholar]
- Johnson L. Spermatogenesis and aging in the human. J Androl. 1986;7:331–354. doi: 10.1002/j.1939-4640.1986.tb00943.x. [DOI] [PubMed] [Google Scholar]
- Johnson L. Zane RS. Petty CS, et al., editors. Quantification of the human Sertoli cell population: its distribution, relation to germ cell numbers, and age-related decline. Biol Reprod. 1984;31:785–795. doi: 10.1095/biolreprod31.4.785. [DOI] [PubMed] [Google Scholar]
- Kaler LW. Neaves WB. Attrition of the human Leydig cell population with advancing age. Anat Rec. 1978;192:513–518. doi: 10.1002/ar.1091920405. [DOI] [PubMed] [Google Scholar]
- Mendis-Handagama SM. Estimation error of Leydig cell numbers in atrophied rat testes due to the assumption of spherical nuclei. J Microsc. 1992;168:25–32. doi: 10.1111/j.1365-2818.1992.tb03247.x. [DOI] [PubMed] [Google Scholar]
- Mendis-Handagama SM. Ewing LL. Sources of error in the estimation of Leydig cell numbers in control and atrophied mammalian testes. J Microsc. 1990;159:73–82. doi: 10.1111/j.1365-2818.1990.tb03020.x. [DOI] [PubMed] [Google Scholar]
- Midzak AS. Chen H. Papadopoulos V, et al., editors. Leydig cell aging and the mechanisms of reduced testosterone synthesis. Mol Cell Endocrinol. 2009;299:23–31. doi: 10.1016/j.mce.2008.07.016. [DOI] [PubMed] [Google Scholar]
- Neaves WB. Johnson L. Petty CS. Age-related change in numbers of other interstitial cells in testes of adult men: evidence bearing on the fate of Leydig cells lost with increasing age. Biol Reprod. 1985;33:259–269. doi: 10.1095/biolreprod33.1.259. [DOI] [PubMed] [Google Scholar]
- Pakkenberg B. Gundersen HJ. Total number of neurons and glial cells in human brain nuclei estimated by the disector and the fractionator. J Microsc. 1988;150:1–20. doi: 10.1111/j.1365-2818.1988.tb04582.x. [DOI] [PubMed] [Google Scholar]
- Paniagua R. Nistal M. Amat P, et al., editors. Seminiferous tubule involution in elderly men. Biol Reprod. 1987a;36:939–947. doi: 10.1095/biolreprod36.4.939. [DOI] [PubMed] [Google Scholar]
- Paniagua R. Martin A. Nistal M, et al., editors. Testicular involution in elderly men: comparison of histologic quantitative studies with hormone patterns. Fertil Steril. 1987b;47:671–679. doi: 10.1016/s0015-0282(16)59120-1. [DOI] [PubMed] [Google Scholar]
- Petersen PM. Pakkenberg B. Stereological quantitation of Leydig and Sertoli cells in the testis from young and old men. Image Anal Stereol. 2000;19:215–218. [Google Scholar]
- Petersen PM. Pakkenberg B. Giwercman A. The human testis studied using stereological methods. Acta Sterologica. 1996;15:181–185. [Google Scholar]
- Riise J. Pakkenberg B. Stereological estimation of the total number of myelinated callosal fibers in human subjects. J Anat. 2011;218:277–284. doi: 10.1111/j.1469-7580.2010.01333.x. [DOI] [PMC free article] [PubMed] [Google Scholar]
- West MJ. Slomianka L. Gundersen HJ. Unbiased stereological estimation of the total number of neurons in the subdivisions of the rat hippocampus using the optical fractionator. Anat Rec. 1991;231:482–497. doi: 10.1002/ar.1092310411. [DOI] [PubMed] [Google Scholar]
- Wreford NG. Theory and practice of stereological techniques applied to the estimation of cell number and nuclear volume in the testis. Microsc Res Tech. 1995;32:423–436. doi: 10.1002/jemt.1070320505. [DOI] [PubMed] [Google Scholar]