

Abstract
An imaging platform based on broadband coherent anti-Stokes Raman scattering (BCARS) has been developed which provides an advantageous combination of speed, sensitivity and spectral breadth. The system utilizes a configuration of laser sources that probes the entire biologically-relevant Raman window (500 cm−1 to 3500 cm−1) with high resolution (< 10 cm−1). It strongly and efficiently stimulates Raman transitions within the typically weak “fingerprint” region using intrapulse 3-colour excitation, and utilizes the nonresonant background (NRB) to heterodyne amplify weak Raman signals. We demonstrate high-speed chemical imaging in two- and three-dimensional views of healthy murine liver and pancreas tissues and interfaces between xenograft brain tumours and the surrounding healthy brain matter.
Introduction
Raman spectroscopy is a powerful label-free technique for analyzing the chemical species within biological samples. It has been extensively applied to a variety of tissue types and pathologies1–3 providing a high degree sensitivity and specificity. In these and similar studies4–8, multiple peaks within the weakly scattering Raman fingerprint region (< 1,800 cm−1) are used to discriminate subtly different states of cells and tissues. Until now, fingerprint spectra of sufficient quality for such studies have only been available with collection times ranging (0.2 to 30) seconds4–8, seriously limiting its use in high-resolution imaging that is critical for widespread adoption in biological research and clinical practice. To bolster the inherently weak Raman scattering process, coherent Raman imaging (CRI) techniques have been developed that coherently populate selected vibrational states of molecules through their nonlinear response to multiple pulsed laser fields.
Narrowband CRI techniques, such as coherent anti-Stokes Raman scattering (CARS)9 and stimulated Raman scattering (SRS)10, 11, are capable of video-rate imaging of single Raman bands12, 13, but suffer from limitations in breadth and speed of laser tuning rates. CARS, specifically, is also limited by a nonresonant background (NRB) that distorts the Raman signal through coherent mixing and seriously limits Raman peak identification without scanning over a wide spectral range. The net effect limits narrowband CARS to species with high oscillator density and uniquely isolated Raman peaks, essentially preventing access to the chemically rich fingerprint region.
Multiplex techniques, such as multiplex SRS14–18 and BCARS19–22, provide an alternative stimulation profile in which multiple Raman transitions are probed simultaneously. Multiplex SRS is free of NRB, but it is currently limited by small bandwidths14, 16, 17, pulse shaping rates17, 18, course spectral resolution17, and competing nonlinear phenomena23. The BCARS signal is accompanied by an NRB, but, because it is a spectroscopic technique, it can be performed in a manner such that the NRB is used as a heterodyne amplifier for weak Raman peaks24, and NRB-induced spectral distortions are removed numerically25–27, but it, too, has been hampered by several challenges. BCARS techniques are capable of probing over 3000 cm−1, but inefficiently stimulate Raman transitions through 2-colour excitation (described below) that limits spectral detection in biological samples to just the CH-/OH-stretch region and the strongest few fingerprint peaks with (30 – 300) ms dwell times28, 29. Intrapulse CARS techniques use a 3-colour excitation mechanism (also described below) to address primarily the fingerprint region, but, thus far, have been limited to fingerprint imaging of only strongly scattering systems such as neat liquids and polymer films30, 31.
In this work, we present a BCARS system that efficiently stimulates Raman transitions, especially within the weak fingerprint region, using intrapulse 3-colour excitation, and exploits the strong NRB for amplifying the inherently weak fingerprint signal. The combination of these two features allows us to record spectra one to two orders-of-magnitude faster than previously possible and with high spectral clarity, paving a way toward CRI integration into widespread biological and clinical use.
Results
System Design
Figure 1a presents a schematic of the BCARS system, which uses tailored co-seeded fiber lasers to generate a narrowband flat-top probe (770 nm; ≈ 16 mW, 3.4 ps on-sample) and a supercontinuum (SC) (~900 nm to 1,350 nm; ≈ 9.5 mW, ≈ 16 fs pulses on-sample) with negligible jitter, a similar laser design to Selm et al.32. This particular configuration provides an independent, robust probe source for high-resolution spectra (< 10 cm−1); stimulates the fingerprint region using intrapulse 3-colour excitation, which is particularly strong, efficient, and maximal at the lowest energy levels; and stimulates higher energy transitions using 2-colour excitation; thus, accessing the entire biologically-relevant Raman window (~ 500–3500 cm−1). We avoid NRB-reduction schemes so as to maximally generate the resonant signal and the nonresonant signal for heterodyne amplification.
Figure 1. Coherent Raman Imaging with BCARS microspectroscopy.
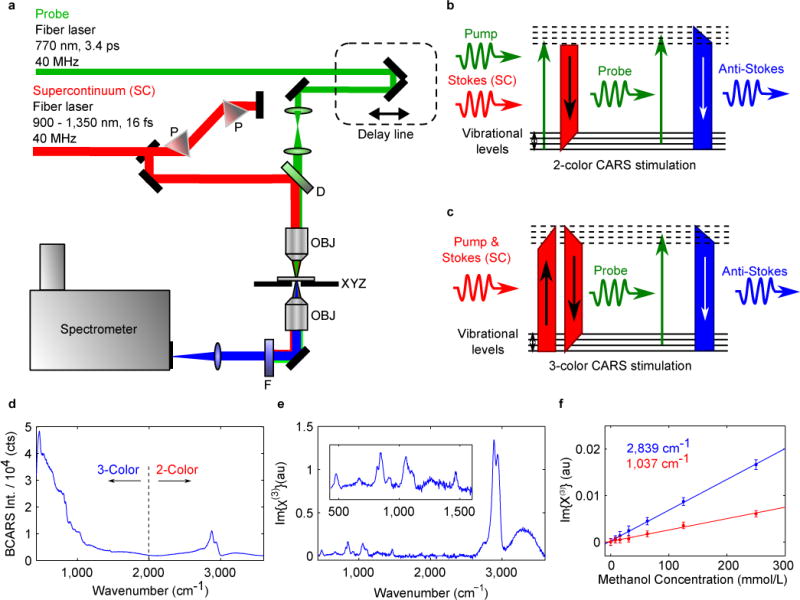
a, Schematic of the BCARS CRI system; P, SF10 prism; D, dichroic mirror; OBJ, objective lens; XYZ, piezoelectric stage; F, two short-pass filters. b, Energy diagram with 2-colour excitation. c, Energy diagram with 3-colour excitation. d, BCARS spectrum of 99 % glycerol at 3.5 ms exposure. e, Retrieved Raman spectrum of 99 % glycerol using the Kramers-Kronig transform. f, Linear dependence of the retrieved Raman spectrum on methanol concentration showing a detection limit of < 8 mmol/L using the 2,839 cm−1 peak and < 28 mmol/L using the 1,037 cm−1 peak. Error bars are ±1 standard deviation.
The developed system uses two different excitation methods. These mechanisms operate simultaneously as they are simply different permutations of the same two pulses, but their properties differ significantly. To illustrate this, we begin with an expression for the frequency-domain CARS signal intensity, ICARS(ω):
| (1) |
where ω is frequency, χ(3) is the 3rd-order nonlinear susceptibility, Ep, Es, and Epr are the pump, Stokes, and probe fields, respectively, and ⋆ and * are the cross-correlation and convolution operators, respectively. The term in square brackets is the frequency-domain coherence generation profile, which will maximize at the frequency difference between the peaks of the pump and Stokes fields. Assuming real, Gaussian fields, the integrated spectral intensity over all frequencies is given as:
| (2) |
where , , and are the pump, Stokes, and probe spectrally integrated modulus-squared field (proportional to average power), such that , where E0 is the field envelope amplitude with 1/e half-width σ.
Under “2-colour” (2C) excitation (Figure 1b), used in BCARS/MCARS systems with degenerate pump and probe sources19–22 ( ; σp,pr ≡ σp = σpr), the BCARS signal resolution is provided by the narrowband pump-probe source, and the spectral breadth is provided by the Stokes source; thus, from (2):
| (3) |
For intrapulse “3-colour” (3C) excitation (Figure 1c) in which the probe is independent and the SC provides the pump and Stokes photons ( ; σp,S ≡ σp = σS):
| (4) |
We note two important differences between these coherence generation mechanisms. One is that the 2-colour mechanism has a peak excitation profile at the difference frequency between the narrowband and SC pulses (near 2800 cm−1 for our system), whereas the intrapulse 3-colour mechanism has a peak excitation frequency at 0 cm−1, since the pump and Stokes fields are degenerate. Thus, the former excites the CH-/OH-stretch region that typically presents an intrinsically stronger response, whereas the latter excites the fingerprint region with the weaker intrinsic response. The other important difference in these mechanisms is their efficiency over a broad bandwidth. For 2-colour excitation, as described in (3), the total CARS signal is independent of the Stokes source bandwidth, σS. Thus with increasing σS, the total integrated CARS signal remains constant, but the signal at each spectral increment will decrease. In contrast, as described in (4), the total 3-colour CARS signal rises with increasing bandwidth, σp, S. Importantly, the signal at each spectral increment also increases with increasing σp, s. From this comparison, one can appreciate that the 3-colour mechanism is much more efficient than the 2-colour mechanism for the present system. We can quantify the relative efficiency as: 〈I3C〉 / 〈I2C ∝ σS/σpr ≈ 100; thus, this system provides strong and efficient excitation where it is most needed within the fingerprint region. A more thorough treatment of these topics is presented in the Supplementary Information section ‘2-Colour and 3-Colour Excitation Methods’.
Utilizing 3-colour generation is necessary, but not sufficient to achieve the required signal levels within the fingerprint region. CARS imaging with 3-colour excitation was first reported more than 10 years ago31, but until now has been limited to fingerprint imaging of only strongly scattering systems such as neat liquids and polymer films30,31. To best take advantage of the strong 3-colour stimulation, requires the full utilization of the NRB. Without the heterodyne amplification provided by the NRB, our signal-to-noise ratio (SNR) at high-speed acquisition would be less than 1 for most Raman fingerprint peaks. As previously described, the NRB limits the vibrational sensitivity and specificity of narrowband CARS techniques9,24, however, it acts as a robust local oscillator for heterodyne amplification of the resonant signal when spectral phase retrieval is applied numerically after the signal is collected25,26. This amplification can bring the weaker Raman peaks above the noise floor, increasing their effective SNR by over an order of magnitude (see Supplementary Information section ‘Nonresonant Background as Heterodyne Amplifier’).
The spectra generated by this combination of 2-colour and 3-colour excitation are collected with a spectrometer equipped with a thermoelectrically cooled charged-coupled device (CCD) camera that affords acquisition times down to 3.5 ms per spectrum. Our spectrometer detection range is sufficiently broad (> 250 nm) to acquire signal from BCARS as well as other nonlinear processes, such as second-harmonic generation (SHG) and two-photon excited fluorescence (TPEF), providing an additional layer of information for BCARS spectral interpretation. Figure 1d shows a raw BCARS spectrum of 99 % glycerol (acquisition time: 3.5 ms; SNR: 15 dB to 23 dB), which shows the intense 3-colour response in the range (≈ 425 to 2,000) cm−1 that dwarfs the 2-colour response (≈ 2,000 to 3,600) cm−1. Although the raw BCARS spectrum is distorted due to coherent mixing between the resonant CARS signal and the NRB9, Figure 1e demonstrates the use of a time-domain Kramers-Kronig (TDKK) transform to retrieve the imaginary component of the nonlinear susceptibility25, (convolved with the probe source spectral profile), that is proportional to the [spontaneous] Raman response of the molecule. See the Supplementary Information section ‘Spontaneous and Coherent Raman Spectroscopy of Glycerol’ demonstrating the significant speed enhancement. We use the TDKK for its speed advantage over competing techniques27. To examine the detection limit of the BCARS system and demonstrate molecular response linearity, we recorded spectra from a methanol-water dilution series (time-averaged over 1 second10). As shown in Figure 1f, the response of the retrieved is linear with respect to methanol concentration (starting from 1 mol/L; zoomed-in for clarity), and the detection limit of the system was determined to be < 23 mmol/L using the C-O stretch peak at ≈ 1,037 cm−1 and < 8 mmol/L using the C-H stretch peak at ≈ 2,839 cm−1, which matches closely with similar SRS measurements10.
Tissue Imaging
To date, histological analysis of tissues using CRI has relied on limited spectral information primarily in the strong CH-/OH-stretch region of the Raman spectrum (≈ 2,700 cm−1 to 3,500 cm−1)12,17,28,33. With these limitations and the complexity of tissue specimens, spectrally identifying even such common features as nuclei are nontrivial tasks. To demonstrate the sensitivity of the present CRI system using molecular fingerprint signatures, we imaged murine liver tissue sections. Figure 2a shows a pseudocolour image of liver tissue near a portal triad (hepatic artery, hepatic portal vein, and bile duct) that was collected with 3.5 ms dwell times over a 200 μm × 200 μm area (300 pixels × 300 pixels). This image contrasts nuclei in blue based on the Raman band ≈ 785 cm−1, which emanates from DNA/RNA pyrimidine ring breathing and the phosphodiester-stretch34. For further chemical contrast or specificity, one could use other nucleotide peaks at (668, 678, 728, 750, 829, 1,093, 1,488, and 1,580) cm−1. Additionally, the peak at 830 cm−1 could be used to gauge the amount of DNA in the B-conformation relative to the total genetic content providing information about the functional state of the cells. As a general protein contrast, the ring breathing contribution of phenylalanine at 1,004 cm−1 is presented in green. The collagen is highlighted in red using the 855 cm−1 C-C-stretch from the pyrrolidine ring of proline (C-C-stretch at 938 cm−1 also provides similar contrast35). Previous CRI investigations of tissue incorporated SHG and TPEF imaging to identify collagen and elastin, respectively4,36, which is shown in Figure 2b, with demonstrative spectra in Figure 2c. It should be noted, however, that SHG and TPEF provide uncertain chemical specificity as other biologically-relevant molecular species are known to generate a response as well37. Additionally, we note that Raman and SHG present differing contrasts of collagen as Raman (and by extension, BCARS) is sensitive to molecular structure35,38 while SHG is sensitive to supermolecular crystalline structure39–41.
Figure 2. CRI of murine liver tissue.
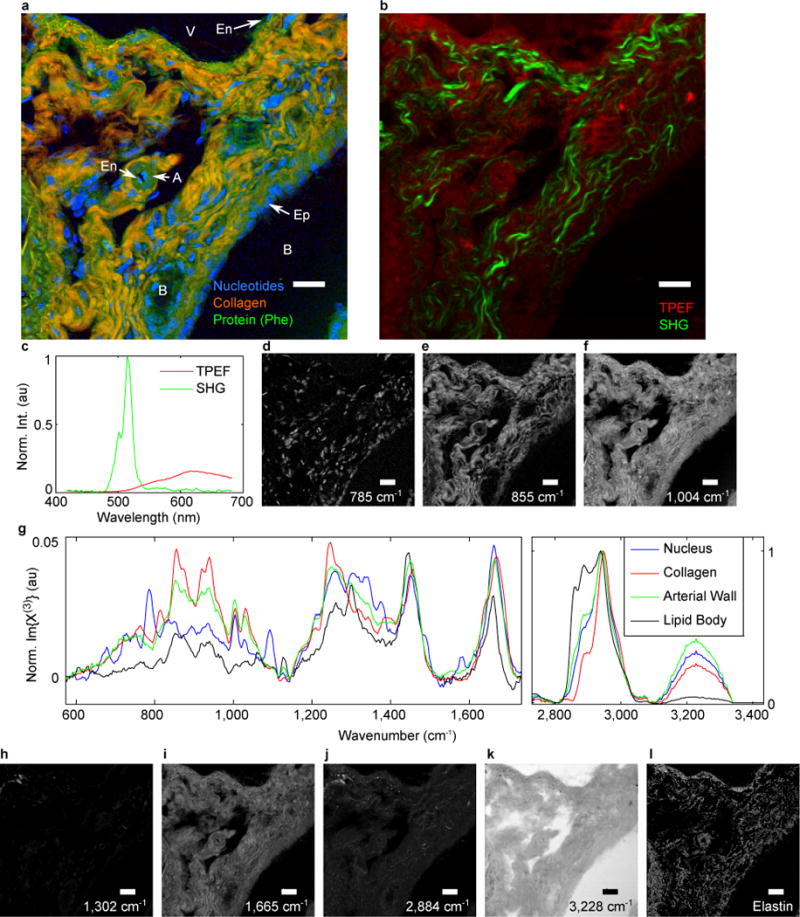
a, Spectral image of portal triad within murine liver tissue with the nuclei in blue, collagen in orange, and protein content in green. A, portal artery; B, bile duct; V, portal vein; Ep, epithelial cell; En, endothelial cell. b, SHG image highlighting the fibrous collagen network. c, SHG spectrum for a single pixel. d–f, Spectral images of individual vibrational modes represented by the colour channels in a: d, 785 cm−1; e, 855 cm−1; f, 1,004 cm−1. g, Single-pixel spectra from within the nucleus (DNA), collagen fiber, arterial wall, and a lipid droplet. h–l, Additional spectral channels that provide histochemical contrast: h, 1,302 cm−1; i, 1,665 cm−1; j, 2,884 cm−1; k, 3,228 cm−1; l, Elastin: (1,126 and 1,030) cm−1 but not (677, 817, and 1,302) cm−1. Scale bars, 20 μm.
With this level of spatial resolution and chemical contrast, several hepatic structures are identifiable by their histology: the hepatic artery with its circular protein-rich, collagen-poor band (likely smooth muscle) surrounding a thin endothelial layer and lumen, the bile ducts lined by tightly packed cuboidal epithelial cells, and the relatively large portal vein with its sparse (due to microtome sample preparation) endothelial layer. Additionally one can see the connective tissue septa (primarily collagen) that enmeshes the portal triad.
Although the pseudocolour image in Figure 2a is limited to 3 colours, which are presented in high-contrast grayscale in Figures 2d–f, one can identify significant spectral complexity in the sample as illustrated by the single-pixel spectra in Figure 2g. Using isolated peaks, one could create dozens of unique images based on vibrational susceptibilities, such as those shown in Figures 2h–k: 1,302 cm−1 (CH2-deformation), 1,665 cm−1 (Amide I/C=C-stretch), 2,884 cm−1 (CH2-stretch), 3,228 cm−1 (O-H-stretch), respectively. Additionally, multivariate analysis of contributions from several peaks, their locations, intensities, and shapes present significant avenues of chemical contrast. For example, Figure 2l highlights elastin by segmenting the chemical species that have vibrations at (1,126 and 1,030) cm−1 but lack vibrations at (677, 817, and 1,302) cm−1, which isolates elastin from collagen and other proteins, lipids, and nucleotides35. Similarities and differences between the BCARS image and the TPEF image in Figure 2b, indicate that although elastin is the most abundant fluorescent molecule, multiple chemical species contribute to the TPEF signal37.
Beyond histochemical imaging in two dimensions, nonlinear excitation in CARS makes it an intrinsically sectioning microscopy, affording the generation of “z-stack” images in three dimensions. Narrowband CARS and SRS have demonstrated this capability9,11,13,33, but three-dimensional microspectroscopy with BCARS or spontaneous Raman has been uncommon due to long acquisition times. Figure 3a is a BCARS image of murine pancreas highlighting the nuclei in blue (785 cm−1), collagen in red (855 cm−1), and a general contrast for lipids and protein in green (1,665 cm−1: lipids, C=C-stretch; proteins, Amide I). This image shows a single plane from a 10-stack collection with each plane covering 150 μm × 100 μm (0.667 μm lateral, 1 μm axial step size; < 2 minutes per image). Additionally, two reconstructed axial planes are shown. This image shows an interlobular exocrine duct surrounded by epithelial cells, the edge of a larger interlobular exocrine duct (as identified by the columnar epithelial cells), a collagen matrix, and acinar cells (and the lumen separating the acini). Figure 3b shows the reconstructed 3D image that more clearly shows the shape, size, and orientation of the individual cells and tissue constituents. Figure 3c shows single pixel spectra from the nucleus of an epithelial cell, collagen, and from the cytosol of an acinar cell.
Figure 3. Three-dimensional CRI of murine pancreatic ducts.
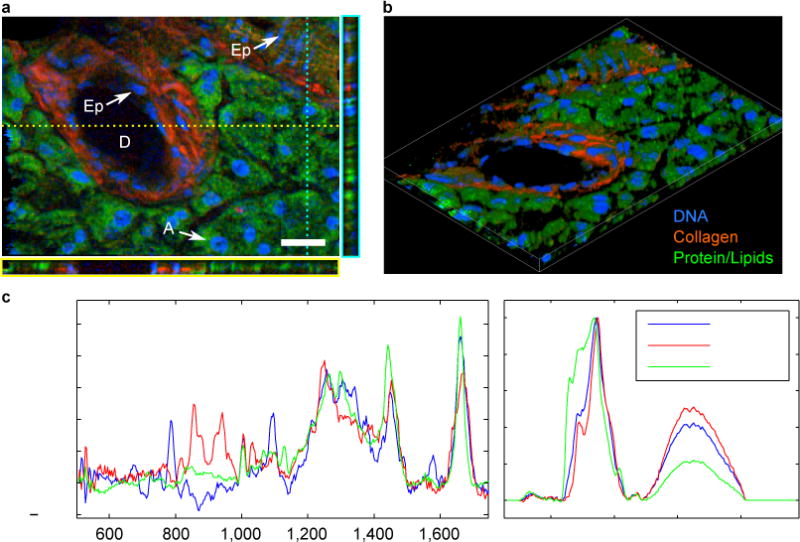
a, Pseudocolour image taken from a single plane of a Z-stack image collection of exocrine ducts highlighting nuclei (785 cm−1) in blue, collagen (855 cm−1) in red, and a composite of lipids and proteins in green (1,665 cm−1). D, exocrine duct; A, acinar cell; Ep, epithelial cell. Additionally, two axial planes are shown to provide histochemical depth information. b, Three-dimensional reconstruction of pancreatic ducts from 10 z-stack images. c, Single-pixel spectra taken from within an epithelial cell nucleus, within the fibrous collagen, and from within the cytosol of an acinar cell. Scale bar, 20 μm.
For histopathological analysis, spontaneous Raman and infrared micro/spectroscopy have demonstrated adequate chemical specificity and sensitivity to delineate a variety of neoplasms1–8, 42, but required long integration times and presented course spatial resolution, which may limit accurate tumour-boundary identification and early-stage tumour detection. Conversely, CRI techniques have demonstrated high-speed, high-spatial resolution imaging of normal and diseased brain tissue but with contrast limited to single or few Raman peaks4,28,42. We present images of orthotopic xenograft brain tumours (see Methods for more detail) within a murine brain. Figure 4a shows a brightfield image of a brain slice (10 μm nominal thickness) with an identifiable tumour mass from which we imaged several areas (Figure 4b shows a close-up polarization micrograph of the specific imaging sites). Figure 4c shows a CRI image with nuclei in blue (730 cm−1), lipid-content in red (2,850 cm−1), and red blood cells in green (1,548 cm−1 + 1,565 cm−1: C-C-stretch from hemoglobin43). This image clearly shows the large tumour mass and a projection of neoplastic cells within healthy tissue. Additionally, smaller tumour bodies are identifiable by their high density of distorted nuclei with high nuclear:cytoplasmic ratio. Figure 4d shows several small extensions of the main tumour mass invading healthy brain matter. The mesh-like appearance of the healthy tissue is likely an artifact of sectioning and the freeze-thaw cycle due to tissue density differences (see axial-scan in Figure 4d). Figure 4e shows the boundary between normal brain tissue (likely, gray matter), white matter, and tumour masses which contrasts lipids in red (2,850 cm−1); CH3-stretch – CH2-stretch (2,944 cm−1 − 2,850 cm−1), a general contrast; and nuclei in blue (785 cm−1). The image shows the fibrous texture of white matter and strands of myelination around cancer cell clusters. Figure 4f shows single-pixel spectra from an intratumoural nucleus, the white matter, and normal brain. The spectra indicate lipids are most concentrated in the white matter and least in the tumour, which agrees with previous chromatographic44 and vibrational spectroscopic studies6,45. Additionally, one sees an increase in response from phenylalanine (1,004 cm−1) and an overall reduction in the lipid-protein ratio in tumour cells relative to healthy brain tissues, both indicated in previous Raman studies42,45, but it was not established whether these changes manifested themselves across the tumour or in certain substructures. For further analysis, we spectrally segmented the tumour masses between intracellular regions and extracellular regions (Figure 4g). Figure 4h shows a histogram analysis of each pixel within the tumours indicating that the phenylalanine content is more concentrated within the nuclei, which is also indicated in the spectra in Figure 4i. Additionally the lipid-protein ratio (2,850 cm−1 / 1,004 cm−1) is largest in normal brain matter (14.5), weakest in the intranuclear tumoural space (6.9), and intermediate in the extranuclear tumoural space (12.8).
Figure 4. Histopathology using broadband CRI.
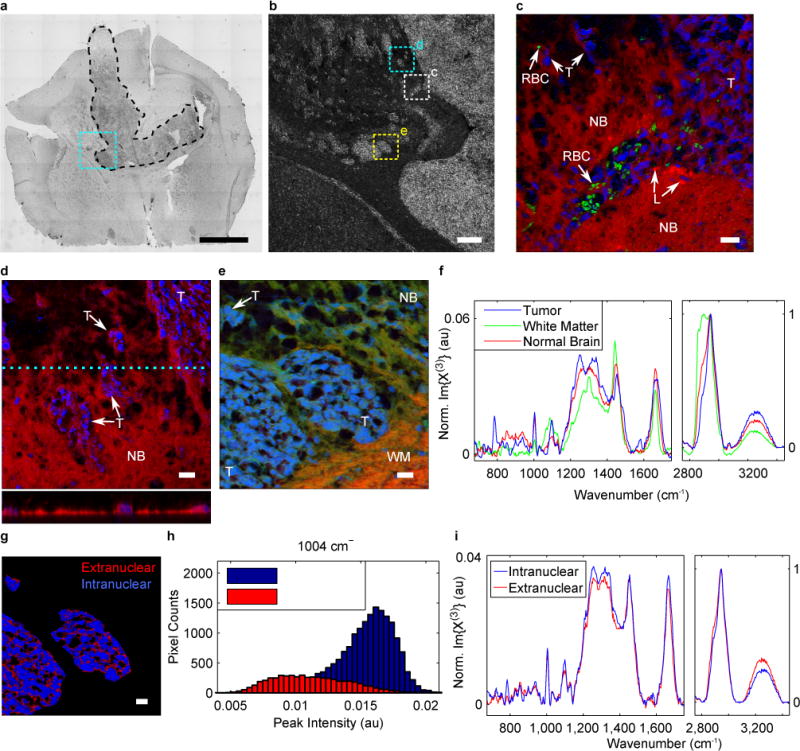
a, Brightfield image of xenograft glioblastoma in mouse brain outlining tumour hard boundary (black, dashed line). Cyan dashed box indicates region of interest (ROI). Scale bar, 2 mm. b, Phase contrast micrograph of BCARS ROIs with boxes and associated subfigure labels. Scale bar, 200 μm. c, Pseudocolour BCARS image of tumour and normal brain tissue highlighting nuclei (blue), lipid content (red), and red blood cells (green). d, BCARS image and axial scan highlighting nuclei (blue) and lipid content (red). e, BCARS image highlighting nuclei (blue), lipid content (red), and CH3-stretch – CH2-stretch (green). NB, normal brain; T, tumour cells; RBC, red blood cells; L, lipid bodies; WM, white matter. f, Single-pixel spectra. g, Spectrally segmented image of internuclear (blue) and extranuclear (red) tumoural spaces. h, Histogram analysis of phenylalanine content. i, Mean spectra from within tumour mass. c – e & g, Scale bars, 20 μm.
Discussion
In this work, we have presented results from the development of a new CRI platform with an unprecedented combination of speed, sensitivity, and spectral breadth that has real potential to propel Raman imaging into widespread adoption in biological research and clinical use. Through the use of intrapulse 3-colour stimulation in conjunction with heterodyne amplification of the small Raman signal with the strong NRB, this system provides a level of signal clarity throughout the fingerprint region previously only available through spontaneous Raman but at speeds aligned with coherent Raman techniques. For demonstrative purposes, we presented BCARS images of healthy and neoplastic tissues that indicate that BCARS could be used to practically provide a new layer of information to researchers in conjunction with other molecular analysis techniques, such as antibody-based fluorescence staining, quantitative polymerase chain reaction (qPCR) or RNA sequencing microarray data.
In addition to the aforementioned biological investigations, there are a number of opportunities for improving the utility of the BCARS system. For example, advanced pulse shaping techniques could be implemented to tailor the excitation profile to particularly enhance the sensitivity over specific spectral ranges, such as the 1,800 cm−1 to 2,200 cm−1 range, for which our system currently has the least sensitivity. Additional hardware advances such as epidetection, as recently demonstrated46, could expand imaging to thick or opaque samples and in conjunction with endoscopy could provide an opportunity for in vivo imaging.
Methods
Any mention of commercial products or services is for experimental clarity and does not signify an endorsement or recommendation by the National Institute of Standards and Technology.
BCARS Microscope
The BCARS microspectrometer is constructed from two co-seeded fiber lasers (Toptica, FemtoPro) that provide attosecond-level synchronization with the narrowband probe laser generating ≈ 3.4 ps flat-top pulses (∆Ω < 10cm−1) at 770 nm (40 MHz repetition rate), and the SC source generating ≈ 16 fs pulses (on-sample) spanning (≈ 900 nm to 1,350 nm) nm (40 MHz repetition rate). The SC beam is directed into an SF10 prism pair pulse compressor to provide a degree of chirp control as to maximize the spectral coherence window (additional laser tuning and higher-order chirp can move the 2- and 3-colour excitation regions to excite, for example, the Raman quiescent region when analyzing deuterated species or cyano groups). The probe beam is directed to a motorized optical delay line to provide temporal control between the two sources. Additionally, the probe beam size is enlarged by a refractive telescope to closely match the back aperture of the objective lens. The two beams are combined at a dichroic filter (Omega, 910DCSPXR) and coupled into an inverted microscope (Olympus, IX71). The excitation beams are focused onto the sample using a water-immersion, 60× (NA = 1.2) objective lens (Olympus, UPlanSApo IR). The sample is mounted on a 3-axis piezo stage (Physik Instrumente, P-545) that provides 200 μm × 200 μm × 200 μm movement with sub-micron precision. The excitation and generated photons are collected and collimated with a 60× objective lens (NA = 0.7) (Olympus, LUCPlanFL N) and passed through two shortpass filters (Semrock, Brightline 770SP; Chroma, HHQ765SP). The remaining anti-Stokes light is focused with an achromatic lens onto the slit of a spectrograph (Acton, SpectroPro 2300i) that is equipped with a CCD camera (Andor, DU970N-FI) for spectral recording. With typical settings, each spectrum is recorded between ≈ 470 cm−1 to 3,800 cm−1 (full spectral range covers a larger region: ≈ 268 nm). The camera is directly synchronized with the piezo stage motion controller to allow constant-velocity raster scanning. Each fast-axis line scan is recorded onto the CCD on-board memory and transferred during slow-axis movement. The camera control and acquisition software and the data storage software were developed in-house using Visual C++ and controlled through a custom LabView (National Instruments) interface. The data is processed in MATLAB (Mathworks) through an in-house developed processing suite. Raw spectral data cubes are de-noised using singular value decomposition (SVD) (it should be noted that the average spectrum in Figure 4i was taken from data that was not de-noised with SVD as averaging effectively reduced the noise level without additional processing), a time-domain Kramers-Kronig transform (TDKK) for spectral phase retrieval25, and baseline detrended. For the TDKK, the estimated NRB signal was collected from either water or glass (slide or coverslip) with the probe delayed to the earliest overlap with the SC, a region in which the NRB dominates the resonant signal; thus, providing a good approximation to the pure NRB. Baseline detrending was performed by manually selecting local minima isolated from Raman peaks6. In the event that a sample shows regions of mounting media (water or PBS), the fingerprint region below 1,600 cm−1 within these areas could be used as a model for the residual background and subtracted. All pseudocolour images, vibrational images, and spectra were generated in MATLAB, and the 3D-reconstructed image in Figure 3b was generated in ImageJ (NIH).
Tissue Sections
Fresh murine liver and pancreas tissues were commercially procured (Zyagen) pre-mounted on charged glass slides. The samples were shipped on dry ice and stored at −80 °C. Prior to imaging, the samples were thawed for 10 minutes, washed twice in PBS to remove debris and residual cutting media. The tissues were kept wet with PBS and a glass coverslip was placed over the sample and sealed with nail polish.
Glioblastoma cells (GCs) were isolated from primary surgical GBM biopsy specimens in accordance with protocols approved by the Duke University Medical Center or Cleveland Clinic Foundation Institutional Review Boards. In vivo tumour initiation studies were done with BALB/c nu/nu mice under a Cleveland Clinic Foundation Institutional Animal Care and Use Committee-approved protocol. All transplanted mice were maintained for 100 days or until development of neurologic signs, at which point they were euthanized by CO2 asphyxiation. Brains were removed and fixed in 4 % paraformaldehyde for 24 hours. Following fixation, brains were submerged in 30 % sucrose as cryoprotectant for an additional 24 hours. Samples were then frozen in optimal cutting temperature compound (OCT) and sectioned on a cryomicrotome to a nominal thickness of 10 μm. Prior to imaging, samples were thawed, washed with PBS to remove OCT and debris, then covered with a glass coverslip and sealed with nail polish.
Supplementary Material
Acknowledgments
The authors wish to thank Qiulian Wu, James Hale, and Maksim Sinyuk for preparing the pathological tissue specimens, and Stephanie Miller for preparation of neat chemical specimens. Additionally, C. H. Camp Jr., J. M. Heddleston, and C. M. Hartshorn wish to thank the National Research Council for support through the Research Associate Program (RAP). This work was supported in part by NIH/NIBIB grant 2P41EB001046-11.
Footnotes
Author contributions
C.H.C. performed all experiments, analyzed all data, and drafted the manuscript. C.H.C. and M.T.C. designed all experiments and constructed the final manuscript. M.T.C. and Y.J.L conceptualized the complimentary 2-colour/3-colour excitation scheme. C.H.C. constructed the instrument, modified the laser system, and developed the high-speed acquisition and processing software. C.H.C., Y.J.L, C.M.H., and M.T.C. developed signal processing methodology and protocols. M.T.C. developed the Kramers-Kronig transform and C.H.C. developed the parallelized, high-speed implementation. A.R.H.W., J.M.H., J.N.R., and J.D.L. provided materials and/or the tumour sections and provided histopathology insights and direction. J.M.H. assisted in performing the tumour section study, as well as contributing to the text of this manuscript. A.R.H.W., H.M.H, and C.H.C. collected the spontaneous Raman spectra of glycerol and C.H.C. performed the analysis. C.H.C. developed the presented mathematical framework of CARS generation and associated efficiencies with 2-/3-colour stimulation. M.T.C. supervised the study.
Competing financial interests
The authors declare no competing financial interests.
References
- 1.Huang Z, et al. Near-infrared Raman spectroscopy for optical diagnosis of lung cancer. Int J Cancer. 2003;107:1047–1052. doi: 10.1002/ijc.11500. [DOI] [PubMed] [Google Scholar]
- 2.Haka AS, et al. Diagnosing breast cancer by using Raman spectroscopy. P Natl Acad Sci USA. 2005;102:12371–12376. doi: 10.1073/pnas.0501390102. [DOI] [PMC free article] [PubMed] [Google Scholar]
- 3.Gniadecka M, et al. Melanoma diagnosis by Raman spectroscopy and neural networks: structure alterations in proteins and lipids in intact cancer tissue. J Invest Dermatol. 2004;122:443–449. doi: 10.1046/j.0022-202X.2004.22208.x. [DOI] [PubMed] [Google Scholar]
- 4.Meyer T, et al. Nonlinear microscopy, infrared, and Raman microspectroscopy for brain tumor analysis. J Biomed Opt. 2011;16:021113. doi: 10.1117/1.3533268. [DOI] [PubMed] [Google Scholar]
- 5.Kirsch M, Schackert G, Salzer R, Krafft C. Raman spectroscopic imaging for in vivo detection of cerebral brain metastases. Anal Bioanal Chem. 2010;398:1707–1713. doi: 10.1007/s00216-010-4116-7. [DOI] [PubMed] [Google Scholar]
- 6.Krafft C, Sobottka SB, Schackert G, Salzer R. Raman and infrared spectroscopic mapping of human primary intracranial tumors: a comparative study. J Raman Spectrosc. 2006;37:367–375. [Google Scholar]
- 7.Koljenović S, et al. Discriminating vital tumor from necrotic tissue in human glioblastoma tissue samples by Raman spectroscopy. Lab Invest. 2002;82:1265–1277. doi: 10.1097/01.lab.0000032545.96931.b8. [DOI] [PubMed] [Google Scholar]
- 8.Nijssen A, et al. Discriminating basal cell carcinoma from its surrounding tissue by Raman spectroscopy. J Invest Dermatol. 2002;119:64–69. doi: 10.1046/j.1523-1747.2002.01807.x. [DOI] [PubMed] [Google Scholar]
- 9.Zumbusch A, Holtom G, Xie XS. Three-dimensional vibrational imaging by coherent anti-Stokes Raman scattering. Phys Rev Lett. 1999;82:4142–4145. [Google Scholar]
- 10.Freudiger CW, et al. Label-free biomedical imaging with high sensitivity by stimulated Raman scattering microscopy. Science. 2008;322:1857–1861. doi: 10.1126/science.1165758. [DOI] [PMC free article] [PubMed] [Google Scholar]
- 11.Ozeki Y, Dake F, Kajiyama S, Fukui K, Itoh K. Analysis and experimental assessment of the sensitivity of stimulated Raman scattering microscopy. Opt Express. 2009;17:3651–3658. doi: 10.1364/oe.17.003651. [DOI] [PubMed] [Google Scholar]
- 12.Evans CL, et al. Chemical imaging of tissue in vivo with video-rate coherent anti-Stokes Raman scattering microscopy. P Natl Acad Sci USA. 2005;102:16807–16812. doi: 10.1073/pnas.0508282102. [DOI] [PMC free article] [PubMed] [Google Scholar]
- 13.Saar BG, et al. Video-rate molecular imaging in vivo with stimulated Raman scattering. Science. 2010;330:1368–1370. doi: 10.1126/science.1197236. [DOI] [PMC free article] [PubMed] [Google Scholar]
- 14.Bachler BR, Fermann ME, Ogilvie JP. Multiplex Raman induced Kerr effect microscopy. Opt Express. 2012;20:835–844. doi: 10.1364/OE.20.000835. [DOI] [PubMed] [Google Scholar]
- 15.Ploetz E, Laimgruber S, Berner S, Zinth W, Gilch P. Femtosecond stimulated Raman microscopy. Appl Phys B. 2007;87:389–393. [Google Scholar]
- 16.Rock W, Bonn M, Parekh SH. Near shot-noise limited hyperspectral stimulated Raman scattering spectroscopy using low energy lasers and a fast CMOS array. Opt Express. 2013;21:15113–15120. doi: 10.1364/OE.21.015113. [DOI] [PubMed] [Google Scholar]
- 17.Fu D, et al. Quantitative chemical imaging with multiplex stimulated Raman scattering microscopy. J Am Chem Soc. 2012;134:3623–3626. doi: 10.1021/ja210081h. [DOI] [PMC free article] [PubMed] [Google Scholar]
- 18.Kong L, et al. Multicolor stimulated Raman scattering microscopy with a rapidly tunable optical parametric oscillator. Opt Lett. 2013;38:145–147. doi: 10.1364/OL.38.000145. [DOI] [PMC free article] [PubMed] [Google Scholar]
- 19.Mueller M, Schins JM. Imaging the thermodynamic state of lipid membranes with multiplex CARS microscopy. J Phys Chem B. 2002;106:3715–3723. [Google Scholar]
- 20.Cheng JX, Volkmer A, Book LD, Xie XS. Multiplex coherent anti-Stokes Raman scattering microspectroscopy and study of lipid vesicles. J Phys Chem B. 2002;106:8493–8498. [Google Scholar]
- 21.Kano H, Hamaguchi H. Femtosecond coherent anti-Stokes Raman scattering spectroscopy using supercontinuum generated from a photonic crystal fiber. Appl Phys Lett. 2004;85:4298–4300. [Google Scholar]
- 22.Kee TW, Cicerone MT. Simple approach to one-laser, broadband coherent anti-Stokes Raman scattering microscopy. Opt Lett. 2004;29:2701–2703. doi: 10.1364/ol.29.002701. [DOI] [PMC free article] [PubMed] [Google Scholar]
- 23.Ploetz E, Marx B, Gilch P. Disturbing interference patterns in femtosecond stimulated Raman microscopy. J Raman Spectrosc. 2009;41:609–613. [Google Scholar]
- 24.Müller M, Zumbusch A. Coherent anti-Stokes Raman scattering microscopy. ChemPhysChem. 2007;8:2156–2170. doi: 10.1002/cphc.200700202. [DOI] [PubMed] [Google Scholar]
- 25.Liu Y, Lee YJ, Cicerone MT. Broadband CARS spectral phase retrieval using a time-domain KramersKronig transform. Opt Lett. 2009;34:1363–1365. doi: 10.1364/ol.34.001363. [DOI] [PMC free article] [PubMed] [Google Scholar]
- 26.Vartiainen EM. Phase retrieval approach for coherent anti-Stokes Raman scattering spectrum analysis. J Opt Soc Am B. 1992;9:1209–1214. [Google Scholar]
- 27.Cicerone MT, Aamer KA, Lee YJ, Vartiainen E. Maximum entropy and time-domain Kramers-Kronig phase retrieval approaches are functionally equivalent for CARS microspectroscopy. J Raman Spectrosc. 2012;43:637–643. [Google Scholar]
- 28.Pohling C, Buckup T, Pagenstecher A, Motzkus M. Chemoselective imaging of mouse brain tissue via multiplex CARS microscopy. Biomed Opt Express. 2011;2:2110–2116. doi: 10.1364/BOE.2.002110. [DOI] [PMC free article] [PubMed] [Google Scholar]
- 29.Parekh SH, Lee YJ, Aamer KA, Cicerone MT. Label-free cellular imaging by broadband coherent anti-Stokes Raman scattering microscopy. Biophys J. 2010;99:2695–2704. doi: 10.1016/j.bpj.2010.08.009. [DOI] [PMC free article] [PubMed] [Google Scholar]
- 30.Lim SH, Caster AG, Nicolet O, Leone SR. Chemical imaging by single pulse interferometric coherent anti-stokes Raman scattering microscopy. J Phys Chem B. 2006;110:5196–5204. doi: 10.1021/jp057493k. [DOI] [PubMed] [Google Scholar]
- 31.Dudovich N, Oron D, Silberberg Y. Single-pulse coherently controlled nonlinear Raman spectroscopy and microscopy. Nature. 2002;418:512–514. doi: 10.1038/nature00933. [DOI] [PubMed] [Google Scholar]
- 32.Selm R, et al. Ultrabroadband background-free coherent anti-Stokes Raman scattering microscopy based on a compact Er:fiber laser system. Opt Lett. 2010;35:3282–3284. doi: 10.1364/OL.35.003282. [DOI] [PubMed] [Google Scholar]
- 33.Ozeki Y, et al. High-speed molecular spectral imaging of tissue with stimulated Raman scattering. Nature Photon. 2012;6:845–851. [Google Scholar]
- 34.Deng H, Bloomfield VA, Benevides JM, Thomas GJ. Dependence of the Raman signature of genomic B-DNA on nucleotide base sequence. Biopolymers. 1999;50:656–666. doi: 10.1002/(SICI)1097-0282(199911)50:6<656::AID-BIP10>3.0.CO;2-9. [DOI] [PubMed] [Google Scholar]
- 35.Frushour BG, Koenig JL. Raman scattering of collagen, gelatin, and elastin. Biopolymers. 1975;14:379–391. doi: 10.1002/bip.1975.360140211. [DOI] [PubMed] [Google Scholar]
- 36.Le TT, Langohr IM, Locker MJ, Sturek M, Cheng JX. Label-free molecular imaging of atherosclerotic lesions using multimodal nonlinear optical microscopy. J Biomed Opt. 2007;12:054007. doi: 10.1117/1.2795437. [DOI] [PMC free article] [PubMed] [Google Scholar]
- 37.Zipfel WR, et al. Live tissue intrinsic emission microscopy using multiphoton-excited native fluorescence and second harmonic generation. P Natl Acad Sci USA. 2003;100:7075–7080. doi: 10.1073/pnas.0832308100. [DOI] [PMC free article] [PubMed] [Google Scholar]
- 38.Dong R, Yan X, Pang X, Liu S. Temperature-dependent Raman spectra of collagen and DNA. Spectrochim Acta A. 2004;60:557–561. doi: 10.1016/s1386-1425(03)00262-2. [DOI] [PubMed] [Google Scholar]
- 39.Sun Y, et al. Investigating mechanisms of collagen thermal denaturation by high resolution second-harmonic generation imaging. Biophys J. 2006;91:2620–2625. doi: 10.1529/biophysj.106.085902. [DOI] [PMC free article] [PubMed] [Google Scholar]
- 40.Fu Y, Wang H, Shi R, Cheng JX. Second harmonic and sum frequency generation imaging of fibrous astroglial filaments in ex vivo spinal tissues. Biophys J. 2007;92:3251–3259. doi: 10.1529/biophysj.106.089011. [DOI] [PMC free article] [PubMed] [Google Scholar]
- 41.Theodossiou T, et al. Thermally induced irreversible conformational changes in collagen probed by optical second harmonic generation and laser-induced fluorescence. Lasers Med Sci. 2002;17:34–41. doi: 10.1007/s10103-002-8264-7. [DOI] [PubMed] [Google Scholar]
- 42.Krafft C, et al. FTIR, Raman, and CARS microscopic imaging for histopathologic assessment of brain tumors. Proc SPIE. 2010;7560:756007. [Google Scholar]
- 43.Wood BR, McNaughton D. Raman excitation wavelength investigation of single red blood cells in vivo. J Raman Spectrosc. 2002;33:517–523. [Google Scholar]
- 44.Yates AJ, Thompson DK, Boesel CP, Albrightson C, Hart RW. Lipid composition of human neural tumors. J Lipid Res. 1979;20:428–436. [PubMed] [Google Scholar]
- 45.Krafft C, Sobottka SB, Schackert G, Salzer R. Analysis of human brain tissue, brain tumors and tumor cells by infrared spectroscopic mapping. Analyst. 2004;129:921–925. doi: 10.1039/b408934k. [DOI] [PubMed] [Google Scholar]
- 46.Hartshorn CM, et al. Multicomponent chemical imaging of pharmaceutical solid dosage forms with broadband CARS microscopy. Anal Chem. 2013;85:8102–8111. doi: 10.1021/ac400671p. [DOI] [PMC free article] [PubMed] [Google Scholar]
Associated Data
This section collects any data citations, data availability statements, or supplementary materials included in this article.