

Abstract
The study of conserved protein interaction networks seeks to better understand the evolution and regulation of protein interactions. Here, we present a quantitative proteomic analysis of 18 orthologous baits from three distinct chromatin-remodeling complexes in Saccharomyces cerevisiae and Homo sapiens. We demonstrate that abundance levels of orthologous proteins correlate strongly between the two organisms and both networks have highly similar topologies. We therefore used the protein abundances in one species to cross-predict missing protein abundance levels in the other species. Lastly, we identified a novel conserved low-abundance subnetwork further demonstrating the value of quantitative analysis of networks.
Keywords: human, multidimensional protein identification technology, quantitative proteomics, topological data analysis, yeast
Introduction
Significant effort has gone into the assembly of protein interaction networks and the subsequent use of these datasets to develop new computational tools to determine protein complex identity 1,2, to identify modularity within networks 3,4, to investigate the regulation of networks 2, and to determine the conservation of networks 3,5,6,7. While these important studies have generated new insights into protein interaction networks, they have largely used qualitative or binary protein interaction network datasets 1,2,3,4,5,6,7. In contrast, protein interaction network analyses utilizing protein mass spectrometry (MS) are now based on quantitative proteomic approaches, which provide deeper insights into networks 8,9,10,11 and have facilitated the development of computational approaches to determine protein complexes 11,12,13.
The evolutionary conservation of networks is of high interest because conserved features are likely functionally important to an organism 4,14,15. When conserved features are identified, information from one organism can be used to drive the biological research in another organism. Quantitative proteomic studies of whole cell lysates have reported positive abundance correlations between different species, suggesting the general conservation of proteomes 16,17. To facilitate this research in the area of conservation of protein interaction networks, quantitative datasets would be needed where matched protein complexes from more than one organism were analyzed.
Here, we present an integrated quantitative dataset of orthologous proteins from three conserved protein complexes analyzed from S. cerevisiae and H. sapiens. Bait proteins from the yeast NuA4/human TIP60 complexes 18, the yeast Swr1/human SRCAP complexes 19, and the yeast INO80 and/human INO80 complexes 19 were analyzed using label-free quantitative proteomics. These complexes are involved in chromatin-remodeling processes and in human diseases such as cancer 20,21. With this quantitative proteomic-based protein interaction network dataset, we demonstrate that this chromatin-remodeling network is conserved at the levels of core complex content, individual protein abundance, overall topology, and low-abundance protein interactions.
Results and Discussion
Quantitative analysis of matched yeast and human protein complexes
A total of 15 orthologous yeast/human protein pairs were initially selected, used as baits in affinity purification experiments, and analyzed by label-free quantitative proteomics (Supplementary Fig S1). To ensure for a robust, reproducible dataset, we performed replicates on selected yeast and human baits, resulting in 69 total purifications, and we constructed two tables consisting of protein abundances identified in all yeast and human purifications (Supplementary Tables S1 and S2). In yeast, the genomic locus contained the Tandem Affinity Purification (TAP) tag 22, and in human cells, genes contained the N-terminal FLAG-tag 23. Depicted via an asterisk in Fig1, we purified five orthologous proteins between the human SRCAP and yeast Swr1 complexes 19, three orthologous proteins between the human TIP60 and yeast NuA4 complexes 18, five orthologous proteins between the human and yeast INO80 complexes 19, and two subunits shared in all three complexes.
Figure 1. Orthologous yeast and human subunits in three chromatin-remodeling complexes.
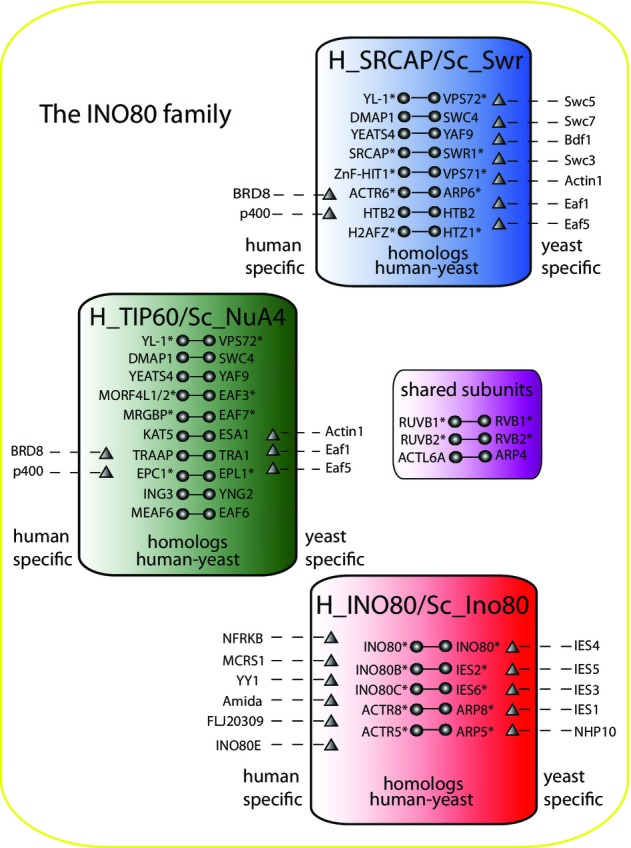
A total of 26 orthologous proteins were identified from yeast INO80/human_INO80 (red), yeast NuA4/human_TIP60 (green), and yeast Swr1/human_SRCAP (blue) complexes. Specific proteins to yeast and human are represented by triangles. Three conserved proteins were shared between all three complexes and are represented in a separate purple box. Overlapping core subunit composition of yeast INO80/human_INO80, yeast NuA4/human_TIP60, and yeast Swr1/human_SRCAP complexes is also shown. Asterisks indicate that a particular protein was used as a bait.
First, we analyzed the quantitative similarities between respective yeast and human complexes, and we focused only on subunits of the three complexes that were orthologs between the two species 24,25. There are 8 orthologous pairs in the SRCAP/Swr1 complexes, 10 orthologous pairs in the TIP60/NuA4 complexes, 5 orthologous pairs in the INO80/INO80 complexes, and 3 orthologous pairs shared between complexes. Three of the orthologous pairs in SRCAP/Swr1 and TIP60/NuA4 are shared between these two complexes (Fig1). A matrix containing the spectral count and peptide (Supplementary Table S3) data from these 26 prey proteins from 69 bait purifications was constructed and subjected to further analysis to determine the similarity of protein abundance between these yeast and human chromatin-remodeling complexes.
To measure the conservation of protein complex abundances, we computed the Spearman rank correlation (ρ) on the protein abundances in yeast baits versus protein abundances in human baits for the 26 prey proteins (Fig2). We constructed two separate 41 × 28 matrices illustrated as heat maps, where one calculated ρ on spectral counts (Fig2A and Supplementary Table S4) and the second calculated ρ using the number of identified peptides (Fig2B and Supplementary Table S4). We observed high correlations for these 26 prey proteins from the orthologous protein purifications. For example, for the INO80 complex, a ρ > 0.9 was obtained for the orthologous prey proteins for the following pairs of orthologous baits of yeast TAP-ARP5/human FLAG-ACTR5, yeast TAP-ARP8/human FLAG-ACTR8, and yeast TAP-IES2/human FLAG-INO80B (Fig2 and Supplementary Table S4). For the SRCAP/Swr1 and the TIP60/Nua4 complexes, the correlation was similarly high for the orthologous proteins when compared between the baits that belong to the same complex. In contrast, lower correlations were obtained between the baits that are shared subunits of multiple complexes with a ρ > 0.6 for yeast TAP-VPS72/human FLAG-YL1, which are components shared between the SRCAP/Swr1 and TIP60/NuA4 complexes (Fig2). Using either spectral counts (Fig2A) or total number of peptides identified (Fig2B), nearly identical results were obtained. High correlations were observed for the core specific subunits of the three complexes and slightly lower correlations for the shared subunits. Our results indicate that the Spearman rank correlation on selected protein complexes is higher than the correlation on overall orthologous proteins in these two organisms, which has been previously shown to be 0.64 16.
Figure 2. Correlation of prey abundance between bait proteins.
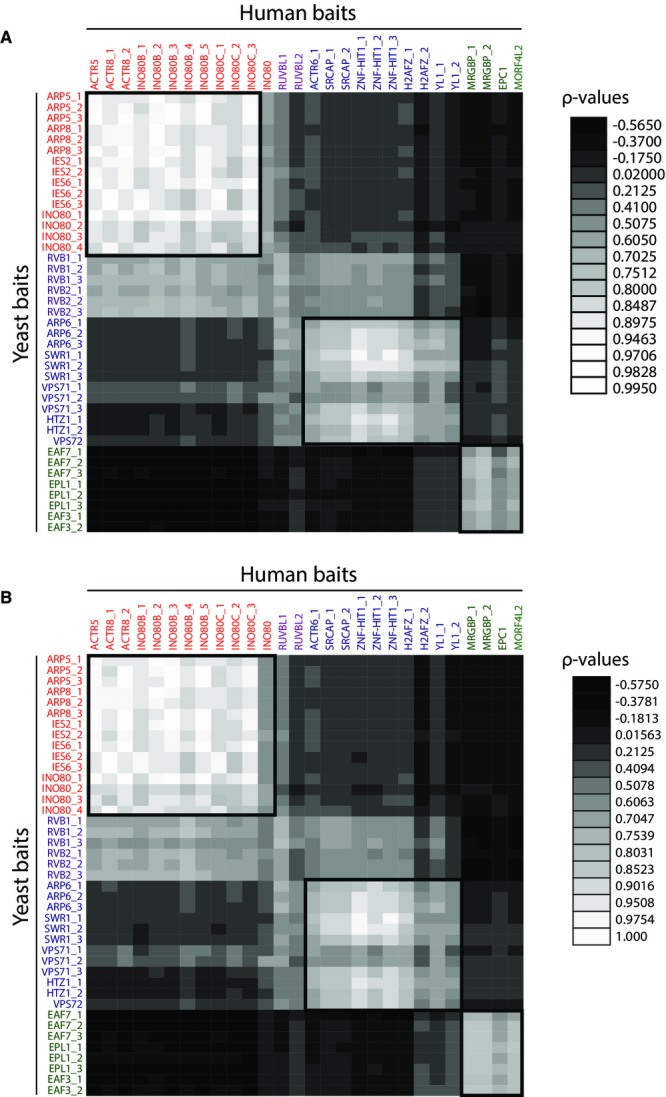
- A heat map with Spearman correlation coefficients calculated from spectral counts is shown. High correlations are shown in light gray, whereas low correlation coefficients are displayed by dark gray.
- Spearman correlation coefficients calculated based on peptide numbers are represented in the heat map with the same color code as in (A).
Conservation of topology between species
Next, we explored the shape of the data using the protein abundance in all the yeast and human purifications using topological data analysis (TDA) 26. Unlike a traditional network, where a node corresponds to a single protein, in a topological network, a node can contain multiple proteins 26. Topological networks were generated on orthologous proteins from the three complexes (Fig3A) and on all identified orthologous proteins between the yeast and human datasets (Fig3B and C). TDA correctly grouped the proteins in separate complexes as shown in Fig3A. Furthermore, TDA separated proteins located far from the center of the dataset (colored in red) from the proteins situated closer to the center (colored in blue/green) (Fig3A). For example, RVB1 and RVB2 proteins, which are the only two proteins pulled down by most of the baits, therefore having the highest abundance in the dataset, were grouped together distant from the connected network (Fig3A).
Figure 3. Topological data analysis of the core network and entire yeast and human networks.
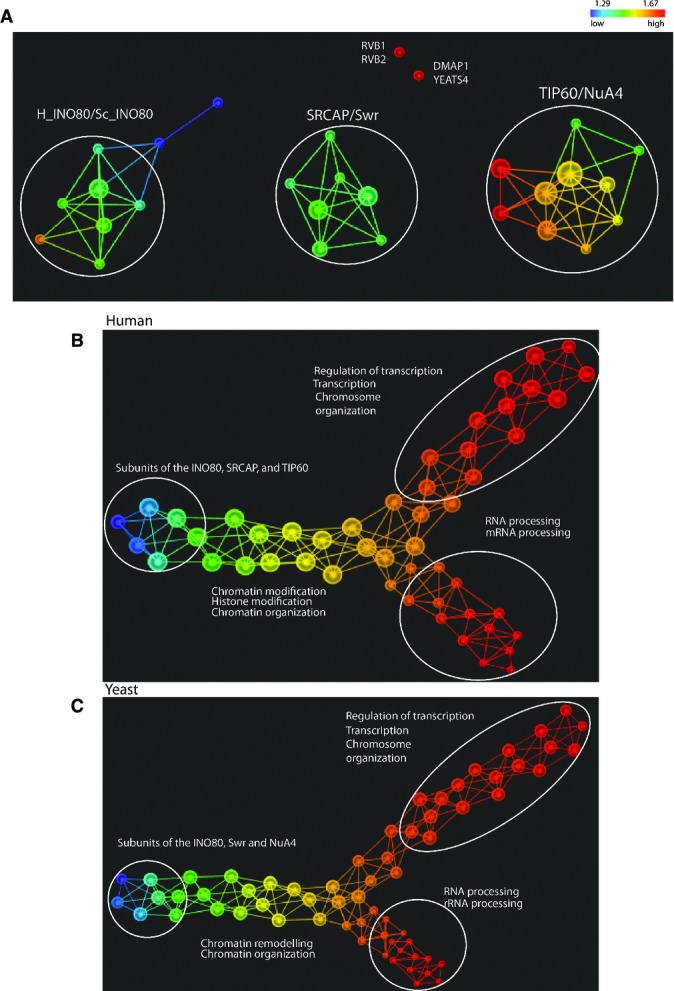
- A A Topological data analysis of the core network was performed on the protein abundance dataset of the 26 conserved proteins in the 69 yeast and human purifications. Principal metric SVD filters with normalized correlation were used (resolution 20, gain 4.0x). The size of a node in the topological network was proportional to the number of proteins. Proteins are colored based on the L-infinity centrality where red indicates high values and blue indicates low values. For simplicity, we listed only the human proteins names where individual proteins are shown.
- B,C Topological data analysis was performed on protein abundance of all yeast baits (B) and all human baits (C). L-infinity centrality filter with normalized correlation was used (resolution 35, gain 4.0x in B and resolution 45, gain 4.0x in C). Proteins are colored based on the L-infinity centrality. Color bar: red indicates high values and blue indicates low values. Biological functions of proteins in the respective flares which exhibit the lowest P-values or highest count as determined by DAVID annotation tool are listed. For simplicity, we show the GO terms that statistically best explain the protein list.
We next constructed three separate networks corresponding to the human (Fig3B), yeast (Fig3C), and merged yeast/human dataset (Supplementary Fig S2) which included all identified orthologous proteins and their corresponding abundance values. We observed that human and yeast data exhibit a similar horizontal Y-shaped topology 26. Next, we investigated the biological functions in each of the three main flares of the yeast and human networks using the DAVID annotation tool 27 (FigA and B and Supplementary Fig S2). Proteins involved in similar biological pathways were grouped together in the same flare in both datasets, indicating a conserved structure of associated proteins. For example, proteins that were located at the center of the data were members of the three complexes and associated proteins involved in chromatin machinery. These proteins were always located at the end of the Y shape as colored in blue (Fig3A and B and Supplementary Fig S2). Conversely, associated proteins that were far from the center and involved in transcription or RNA processing were colored in red as illustrated in the upper and lower flares in Fig3A and B and Supplementary Fig S2. Finally, an analysis of the percent overlap of the proteins between yeast and human for each main network flare demonstrated that both the upper and tail flares have the largest intersection with about 50% of proteins in each flare overlapping between yeast and human (Supplementary Table S5). On the other hand, the lower flares have the lowest number of proteins with 16% overlap. Overall, TDA demonstrates that the topology of the yeast and human datasets presented here are highly similar.
Cross species prediction of missing protein abundance
The high degree of conservation of abundance and topology between the yeast and human datasets suggested that we could use the protein abundance levels for a protein complex member in one species to predict the abundance level of its counterpart in another species. Human networks are generally sparse and complex 10,13; therefore, finding methods that deal with missing values is important for the interpretation of protein interaction networks. In our dataset, for example, in a FLAG-INO80 purification, Ino80C was not detected, and in a FLAG-INO80C purification, INO80B was not detected (Supplementary Fig S3). Multiple approaches have been employed to estimate missing values in microarray datasets 28,29,30. However, depending on the data structure, some approaches can generate results with better accuracy than others. For example, Troyanskaya et al 28 showed that the row average approach yielded drastically lower accuracy than either KNN- or SVD-based estimation. Designed for microarray datasets, the SVDimpute method provides fast and accurate ways of estimating missing values 28. Here, we investigated estimating missing values in the human dataset using the yeast dataset.
In order to validate the predictor and learn the parameter of the SVDimpute 28, we used a training set of human runs from which we randomly removed about 5% of proteins from the complex. Next, we calculated the correlation between the experimentally measured abundance values and the predicted abundance values for the proteins in the training dataset to see whether the predicted values were correctly estimated. Our human purifications encompass a wide range of spectra values depending on the bait or on the type of cells used. For example, experiments using the human baits INO80B and VPS71 in HeLa cells generated datasets containing in the range of hundreds-to-thousands of spectra, whereas some purifications performed in HEK293 cells generated spectral count values lower than a hundred (Supplementary Table S1).
To determine the optimal model parameter k for our proteomic dataset, we evaluated the method using a range from 2 to 8. We observed that for the baits consisting of proteins with large spectral counts (typically > 3,000 spectral counts), the optimal value for k was 6, whereas for the baits with medium to low spectral counts (typically < 1,000 spectral counts), the optimal value of k was 3 (Fig4A). The correlations obtained between experimentally measured and predicted abundance values were close to 1 with estimated values showing 1.5–27% error, indicating a good rank estimated prediction (Fig4). Based on these results, we next used the model parameter k = 3 to predict the missing values in the INO80 and INO80C purifications based upon the measured abundances in the orthologous yeast purifications (Fig4A–C). Unlike the training set, we could not compare the predicted values with their true values. Therefore, we used linear regression based spectral counts to describe the relation between protein abundances in yeast versus human for those two baits and determined the correlation coefficient. The resulting R2 values were high with significant P-values, indicating a good prediction (Fig4B and C).
Figure 4. Estimation of missing values across species.

- A Protein abundances in the yeast INO80 complex were used to predict missing values for the human baits. Training human values were used to test the predictor. The prey proteins whose values were removed are shown. The experimental spectral count, the predicted value, and the Spearman correlation between them are also represented. The optimal k-value for each bait is also displayed. aTrue spectral count of prey proteins in the bait in human INO80 complex. bPredicted spectral count for human data using yeast data of INO80 complex. *Baits that consist of proteins with zero abundance values.
- B, C Regressions between yeast and human data for the INO80 and INO80C (replicate #2) baits are displayed. Regressions were performed only after predicting missing values of INO80C and INO80B prey proteins.
Next, we clustered the yeast/human baits on the original spectral count values corresponding to the 26 orthologous prey proteins. We then applied the cluster analysis to the data, which include the fitted abundance values from the regression for the proteins in the INO80 and INO80C human baits. Comparing the groups obtained from both analyses, we found that by incorporating the fitted values into the dataset, the clustering analysis produced an improvement to the first result and correctly located the human INO80 bait in close proximity with the yeast and human baits of the INO80 complex (Supplementary Fig S4). The estimation of missing values in protein baits consisting of low total spectral counts resulted in accurate results using a small k-value, whereas in the case of baits with high total spectral counts, a larger k-value was optimal. In summary, we demonstrated that quantitative APMS data obtained from yeast can be employed to predict missing values in human purifications, which will improve the interpretation of human protein–protein interaction networks.
Conservation of low-abundance interactions in the chromatin network
In order to assess the evolutionary conservation of the protein network of the INO80 subfamily, we extended our analysis to the entire yeast and human datasets. We asked whether these identified conserved associations within the network are strongly related to the chromatin-remodeling machinery. We first looked for orthologous proteins that were consistently present in both yeast and human datasets. We only considered an interaction to be confident if a protein was present in at least two yeast baits and in their human orthologous counterparts. These 214 proteins were also hierarchical clustered (Supplementary Fig S5). In general, yeast and human baits that were members of the same complex converged into the same or closely related clusters, indicating similar abundance levels between the yeast and human pulled-down proteins. In addition, we incorporated a subset from a large dataset of yeast microarray expression profiles generated by Lenstra et al 31 as a complementary source to confirm our conserved interactions. The selected subset consisted of gene expression profiles generated from 11 deletion mutants lacking chromatin machinery components of the three complexes (Supplementary Table S6). We added a new filter to our dataset where a gene that corresponds to a conserved interaction must significantly change in at least one mutant, resulting in a list of 203 conserved interactions from the three complexes (Supplementary Table S6).
Three proteins that passed the criteria (Supplementary Fig S6) were selected from the above list in order to experimentally validate these novel associations. The three low abundant proteins in yeast were TMA19, YAP1802, and DHH1 which were 38, 21, and 16 fold lower in abundance than core proteins in the three complexes, respectively (Supplementary Tables S1 and S2). These proteins are highly conserved and display significant sequence homology to orthologs in human, TPT1, PICALM, and DDX6. To determine whether yTMA19/hTPT1, yYAP1802/hPICALM, and yDDH1/hDDX6 are associated with proteins of the chromatin machinery pathway, we in parallel performed 20 replicate MudPIT analyses from yeast and human purifications of these proteins (Supplementary Table S7). Our yeast and human proteomic results revealed high overlap between the proteins associated with these selected baits and several complexes with roles in chromatin regulation (Fig5A). To illustrate these associations, we constructed a conserved subnetwork in which the selected 3 pairwise yeast/human ortholog protein baits were used as nodes and the edges represent interactions with proteins involved in chromatin regulation. Using a hypergeometric test with a significance threshold of 1%, we identified six conserved complexes (Fig5A). Subunits of the histone deacetylase (RPD3) (HDAC/Sin3A in human), SWI/SNF, INO80, NuA4 (TIP60 in human), SWR (SRCAP in human), and SAGA (STAGA in human) complexes were identified, suggesting that the yTMA19/hTPT1, yYAP1802/hPICALM, and yDDH1/hDDX6 proteins could be involved in these biological pathways. Furthermore, an unexpected observation that came from our yeast and human proteomic analyses was that yTMA19/hTPT1, yYAP1802/hPICALM, and yDDH1/hDDX6 form a small subnetwork (Fig5B and C and Supplementary Table S7).
Figure 5. Conserved subnetwork and association with chromatin-remodeling complexes.

- A A conserved interaction network was constructed where nodes depicted by yellow diamonds represent the yeast/human baits and their edges are connected with proteins involved in the chromatin machinery. These prey proteins are illustrated by circles and are colored in brown. Conserved proteins between the two species were colored in dark orange. Significant P-values obtained from the hypergeometric distribution are also included on the top of each identified complex. Hypergeometric distribution accounts for the identified proteins in SAGA/STAGA, INO80, SIN3/HDAC, SWR/SRCAP, SWI/SNF, and NuA4/TIP60 and total number of proteins assigned by CORUM or SGD in these complexes.
- B, C Yeast and human proteins used as baits are indicated by a circle and associated chromatin complexes are included in rectangles. (B) In yeast, the bidirectional edge between YAP1802 and DHH1 as well as between TMA19 and DHH1 indicates that either one as a bait pulled down the other one as a prey. The directed edge from YAP1802 to TMA19 indicates that YAP1802 as a bait pulled-down TMA19 but not vice versa. (C) In human, the bidirectional edge between PICALM and DDX6 indicates that either one as a bait pulled down the other one as a prey. The directed edges from PICALM and DDX6 to TPT1 indicates that TPT1 as a bait did not pull down PICALM or DDX6 as a prey. The chromatin complexes are pulled down by at least one of the three baits in the subnetwork.
It is important to note that yeast YAP1802/human PICALM, yeast TMA19/human TPT1, and yeast DHH1/human DDX6 interactions are not primarily with chromatin-remodeling proteins (Supplementary Fig S7). For example, the chromatin-remodeling interactions found in DDX6 had lower abundance than the LSM proteins (Supplementary Table S7). Also, the human forms of these three proteins also have strong links to disease. For instance, mutations in the hPICALM gene have been implicated in oncogenesis 32, PICALM is implicated in Alzheimer's disease 33, TPT1 is implicated in tumorigenesis 34, and DDX6 is involved in gene expression in RNA viruses like HIV 35. Of these, yeast two hybrid analysis has linked TPT1 to the SWI/SNF complex 36, providing support for our results that these proteins not only form a subnetwork among themselves but have intriguing links to chromatin remodeling that warrants further study.
In this study, we analyzed the conservation within and between chromatin-remodeling protein interaction networks from S. cerevisiae and H. sapiens. We built a matched affinity purification dataset analyzed via MudPIT and quantitative proteomic analysis in order to assemble a comprehensive list of protein abundance of three chromatin-remodeling protein complexes. We demonstrated that members of chromatin-remodeling complexes are conserved among species at the protein abundance level. We further used TDA 26 to determine that the topology of the networks was conserved both at the level of core protein complexes and low-abundance protein interactions. This led us to demonstrate that we could use yeast data to predict missing abundance values of human datasets. Finally, we found a low-abundance subnetwork that has conserved associations with chromatin-remodeling complexes in both S. cerevisiae and H. sapiens. These results demonstrate that quantitative proteomic-based protein interaction networks open the door for the use of advanced data analysis tools and provide novel insights into networks. Such quantitative proteomic-based datasets will be of great value to the systems biology community that has previously generated important insights into networks using qualitative or binary datasets 1,2,3,4,5,6,7.
Materials and Methods
Cloning and cell lines
All tandem affinity purification (TAP)-tagged strains were obtained from Open Biosystems (now part of GE Healthcare, Pittsburgh, PA, USA). Kazusa Flexi Halo-Tagged clones (pFN21A) TPT1, PICALM, and DDX6 were obtained from Promega (Madison, WI, USA). The N-terminal Halo Tag fusion constructs were subcloned into pcDNA5 using SgfI/PmeI and PacI/PmeI. Stable cell lines were created using the Flp-In System in HEK293 cells from Life Technologies (Grand Island, NY, USA).
Culture and purifications
All S. cerevisiae baits were grown in YPD to an absorbance of OD600 1.5–2.0. TAP was performed as described previously 37. The human ACTR5, ACTR8, INO80B, INO80C, RVBL1, RVBL2, SRCAP, ACTR6, H2AFZ, Zn-HIT1, and MRGBP baits of the H_INO80, H_TIP60, and H_SRCAP complexes were used from Sardiu et al 11 and researched against an updated database. Additionally, N-terminally FLAG-tagged INO80, MORF4L2, and EPC were subcloned and purified as described previously 38. Nuclear extracts were prepared according to the method of Dignam et al 39 from 10 × 109 HEK293FRT cells stably expressing N-terminally Halo-tagged TPT1, DDX6, and PICALM. Nuclear extracts were subjected to the HaloLink Resin (Promega, Madison, WI, USA) equilibrated in 1x TBS and 0.1% NP-40 and allowed to incubate for 1 h at 4°C. Three washes using the equilibration buffer were performed, and proteins of interest were eluted in 100 μl by cleaving the TEV recognition sequence with AcTEV Protease (Life Technologies, Grand Island, NY, USA) in 1x TEV Buffer for 1 h at 27°C as described previously 40.
MudPIT mass spectrometry and data analysis
In order to analyze the purified protein complexes, TCA precipitation, LysC/trypsin digestion, and multidimensional protein identification technology (MudPIT) analyses were performed as previously described 37. For details, please see the Supplementary Methods section. New mass spectrometry data from this publication have been submitted to the PeptideAtlas database (http://www.peptideatlas.org/), assigned the identifier PASS00491 (password JM6934n) at http://PASS00491:JM6934n@ftp.peptideatlas.org/.
Statistical tests
Spearman correlation, denoted by ρ, is a nonparametric measure of statistical dependence between two variables and it is defined as:
| (1) |
where di = xi–yi and it represent the difference between the ranks of each observation and n is the sample size. Spearman correlation test were used to correlate protein abundances on orthologs between yeast and human datasets. This test was calculated using R environment and corr.test() as function and “spearman” as method.
Topological data analysis
TDA 26 was performed on the orthologous proteins in yeast and human purifications with the Ayasdi Iris software platform (Menlo Park, CA) using a free trail at http://www.ayasdi.com/terms-of-service/. Proteins with similar abundance were grouped in a single node as defined by the imposed metric correlation (i.e. norm correlation) and colored by the values of the geometric lens (i.e. L-infinity centrality) 26. A lens is a filter that converts the dataset into a vector, where each row in the original dataset contributes to a real number in the vector. Basically, a lens operation turns every row into a single number. This lens associates to each point x the maximal distance from x to any other data point in the dataset. The connectivity between nodes is one of the most important features of TDA. Nodes are connected if and only if they have a protein in common 26. We used as a distance metric the normalized correlation and for filter function, we used L-infinity centrality in order to generate the shape composed of the three main network flares. Nodes are colored by the values of the filter function (i.e. L-infinity centrality). Large values of this L-infinity centrality function correspond to proteins that are far from the center of the data set. L-infinity centrality considers each row using the maximal distance from all other data points.
where X is a collection of all data points in a dataset; x and y are data points.
Estimation of the missing abundance values using SVDimpute method
The input matrix consists of spectral counts of the proteins identified in the yeast INO80 complex, and the human data comprising missing values. The method uses singular value decomposition to obtain the most significant eigenvectors, which are subsequently combined and linearly regressed against proteins with missing values. Next, the coefficients of the regression are used to approximate the values of undetected proteins. The estimation performance of the SVDimpute depends on a model parameter (k) that is the number of components that should resemble the internal structure of the data 28. The SVDimpute algorithm 28 is based on the method described by Alter et al 41 that is similar to the principal components analysis which uses the following equation
| (3) |
to determine the most significant eigengenes. We employed SVDimpute function in pcaMethods library using R environment to estimate missing abundance values in human from yeast data (http://artax.karlin.mff.cuni.cz/r-help/library/bcv/html/impute.svd.html).
Orthologs
We constructed a set of orthologs between yeast and human datasets using Ensemble. In addition, we also used STRING 42 and YOGY 43: a web-based tool to retrieve orthologs pairs that were not founded by Ensemble. This resulted in 940 orthologs pairs across two species. Note that isoforms map to a single ortholog protein.
Hypergeometric distribution
The distribution was calculated using R environment and the function dhyper(). The human proteins were mapped to the complexes using the CORUM database (http://mips.helmholtz-muenchen.de/genre/proj/corum), and the yeast proteins were separated into complexes using GO SlimMapper from the SGD database (http://www.yeastgenome.org/).
Acknowledgments
This work was supported by the Stowers Institute for Medical Research and NIH grant GM041628 to RCC and JWC.
Author contributions
Study concept and design: MES, JMG, BDG, MPW, Acquisition of data: YC, JJ, BDG, JMG, SRR, Analysis and interpretation of data: MES, JMG, BDG, DH, SRR, YC, JJ, RCC, JWC, LF, MPW, Drafting of manuscript: MES, JMG, BDG, MPW.
Conflict of interest
Damir Herman is an employee of Ayasdi, Inc.
Supporting Information
Supplementary Table S1
Supplementary Table S2
Supplementary Table S3
Supplementary Table S4
Supplementary Table S5
Supplementary Table S6
Supplementary Table S7
Supplementary Information
Review Process File
References
- Xu B, Lin H, Chen Y, Yang Z, Liu H. Protein complex identification by integrating protein-protein interaction evidence from multiple sources. PLoS ONE. 2013;8:e83841. doi: 10.1371/journal.pone.0083841. [DOI] [PMC free article] [PubMed] [Google Scholar]
- Wu H, Gao L, Dong J, Yang X. Detecting overlapping protein complexes by rough-fuzzy clustering in protein-protein interaction networks. PLoS ONE. 2014;9:e91856. doi: 10.1371/journal.pone.0091856. [DOI] [PMC free article] [PubMed] [Google Scholar]
- Zinman GE, Zhong S, Bar-Joseph Z. Biological interaction networks are conserved at the module level. BMC Syst Biol. 2011;5:134. doi: 10.1186/1752-0509-5-134. [DOI] [PMC free article] [PubMed] [Google Scholar]
- Mitra K, Carvunis AR, Ramesh SK, Ideker T. Integrative approaches for finding modular structure in biological networks. Nat Rev Genet. 2013;14:719–732. doi: 10.1038/nrg3552. [DOI] [PMC free article] [PubMed] [Google Scholar]
- Bell R, Hubbard A, Chettier R, Chen D, Miller JP, Kapahi P, Tarnopolsky M, Sahasrabuhde S, Melov S, Hughes RE. A human protein interaction network shows conservation of aging processes between human and invertebrate species. PLoS Genet. 2009;5:e1000414. doi: 10.1371/journal.pgen.1000414. [DOI] [PMC free article] [PubMed] [Google Scholar]
- Brown KR, Jurisica I. Unequal evolutionary conservation of human protein interactions in interologous networks. Genome Biol. 2007;8:R95. doi: 10.1186/gb-2007-8-5-r95. [DOI] [PMC free article] [PubMed] [Google Scholar]
- Sharan R, Suthram S, Kelley RM, Kuhn T, McCuine S, Uetz P, Sittler T, Karp RM, Ideker T. Conserved patterns of protein interaction in multiple species. Proc Natl Acad Sci USA. 2005;102:1974–1979. doi: 10.1073/pnas.0409522102. [DOI] [PMC free article] [PubMed] [Google Scholar]
- Breitkreutz A, Choi H, Sharom JR, Boucher L, Neduva V, Larsen B, Lin ZY, Breitkreutz BJ, Stark C, Liu G. A global protein kinase and phosphatase interaction network in yeast. Science. 2010;328:1043–1046. doi: 10.1126/science.1176495. [DOI] [PMC free article] [PubMed] [Google Scholar]
- Hauri S, Wepf A, van Drogen A, Varjosalo M, Tapon N, Aebersold R, Gstaiger M. Interaction proteome of human Hippo signaling: modular control of the co-activator YAP1. Mol Syst Biol. 2013;9:713. doi: 10.1002/msb.201304750. [DOI] [PMC free article] [PubMed] [Google Scholar]
- Joshi P, Greco TM, Guise AJ, Luo Y, Yu F, Nesvizhskii AI, Cristea IM. The functional interactome landscape of the human histone deacetylase family. Mol Syst Biol. 2013;9:672. doi: 10.1038/msb.2013.26. [DOI] [PMC free article] [PubMed] [Google Scholar]
- Sardiu ME, Cai Y, Jin J, Swanson SK, Conaway RC, Conaway JW, Florens L, Washburn MP. Probabilistic assembly of human protein interaction networks from label-free quantitative proteomics. Proc Natl Acad Sci USA. 2008;105:1454–1459. doi: 10.1073/pnas.0706983105. [DOI] [PMC free article] [PubMed] [Google Scholar]
- Choi H, Larsen B, Lin ZY, Breitkreutz A, Mellacheruvu D, Fermin D, Qin ZS, Tyers M, Gingras AC, Nesvizhskii AI. SAINT: probabilistic scoring of affinity purification-mass spectrometry data. Nat Methods. 2011;8:70–73. doi: 10.1038/nmeth.1541. [DOI] [PMC free article] [PubMed] [Google Scholar]
- Stukalov A, Superti-Furga G, Colinge J. Deconvolution of targeted protein-protein interaction maps. J Proteome Res. 2012;11:4102–4109. doi: 10.1021/pr300137n. [DOI] [PubMed] [Google Scholar]
- Sun MG, Sikora M, Costanzo M, Boone C, Kim PM. Network evolution: rewiring and signatures of conservation in signaling. PLoS Comput Biol. 2012;8:e1002411. doi: 10.1371/journal.pcbi.1002411. [DOI] [PMC free article] [PubMed] [Google Scholar]
- Ryan CJ, Roguev A, Patrick K, Xu J, Jahari H, Tong Z, Beltrao P, Shales M, Qu H, Collins SR, et al. Hierarchical modularity and the evolution of genetic interactomes across species. Mol Cell. 2012;46:691–704. doi: 10.1016/j.molcel.2012.05.028. [DOI] [PMC free article] [PubMed] [Google Scholar]
- Weiss M, Schrimpf S, Hengartner MO, Lercher MJ, von Mering C. Shotgun proteomics data from multiple organisms reveals remarkable quantitative conservation of the eukaryotic core proteome. Proteomics. 2010;10:1297–1306. doi: 10.1002/pmic.200900414. [DOI] [PubMed] [Google Scholar]
- Schrimpf SP, Weiss M, Reiter L, Ahrens CH, Jovanovic M, Malmström J, Brunner E, Mohanty S, Lercher MJ, Hunziker PE, et al. Comparative functional analysis of the Caenorhabditis elegans and Drosophila melanogaster proteomes. PLoS Biol. 2009;7:e48. doi: 10.1371/journal.pbio.1000048. [DOI] [PMC free article] [PubMed] [Google Scholar]
- Doyon Y, Cote J. The highly conserved and multifunctional NuA4 HAT complex. Curr Opin Genet Dev. 2004;14:147–154. doi: 10.1016/j.gde.2004.02.009. [DOI] [PubMed] [Google Scholar]
- Morrison AJ, Shen X. Chromatin remodelling beyond transcription: the INO80 and SWR1 complexes. Nat Rev Mol Cell Biol. 2009;10:373–384. doi: 10.1038/nrm2693. [DOI] [PMC free article] [PubMed] [Google Scholar]
- Kouzarides T. Chromatin modifications and their function. Cell. 2007;128:693–705. doi: 10.1016/j.cell.2007.02.005. [DOI] [PubMed] [Google Scholar]
- Clapier CR, Cairns BR. The biology of chromatin remodeling complexes. Annu Rev Biochem. 2009;78:273–304. doi: 10.1146/annurev.biochem.77.062706.153223. [DOI] [PubMed] [Google Scholar]
- Rigaut G, Shevchenko A, Rutz B, Wilm M, Mann M, Seraphin B. A generic protein purification method for protein complex characterization and proteome exploration. Nat Biotechnol. 1999;17:1030–1032. doi: 10.1038/13732. [DOI] [PubMed] [Google Scholar]
- Chiang CM, Roeder RG. Expression and purification of general transcription factors by FLAG epitope-tagging and peptide elution. Pept Res. 1993;6:62–64. [PubMed] [Google Scholar]
- Lu PY, Levesque N, Kobor MS. NuA4 and SWR1-C: two chromatin-modifying complexes with overlapping functions and components. Biochem Cell Biol. 2009;87:799–815. doi: 10.1139/O09-062. [DOI] [PubMed] [Google Scholar]
- Chen L, Cai Y, Jin J, Florens L, Swanson SK, Washburn MP, Conaway JW, Conaway RC. Subunit organization of the human INO80 chromatin remodeling complex: an evolutionarily conserved core complex catalyzes ATP-dependent nucleosome remodeling. J Biol Chem. 2011;286:11283–11289. doi: 10.1074/jbc.M111.222505. [DOI] [PMC free article] [PubMed] [Google Scholar]
- Lum PY, Singh G, Lehman A, Ishkanov T, Vejdemo-Johansson M, Alagappan M, Carlsson J, Carlsson G. Extracting insights from the shape of complex data using topology. Sci Rep. 2013;3:1236. doi: 10.1038/srep01236. [DOI] [PMC free article] [PubMed] [Google Scholar]
- Huang da W, Sherman BT, Stephens R, Baseler MW, Lane HC, Lempicki RA. DAVID gene ID conversion tool. Bioinformation. 2008;2:428–430. doi: 10.6026/97320630002428. [DOI] [PMC free article] [PubMed] [Google Scholar]
- Troyanskaya O, Cantor M, Sherlock G, Brown P, Hastie T, Tibshirani R, Botstein D, Altman RB. Missing value estimation methods for DNA microarrays. Bioinformatics. 2001;17:520–525. doi: 10.1093/bioinformatics/17.6.520. [DOI] [PubMed] [Google Scholar]
- Oba S, Sato MA, Takemasa I, Monden M, Matsubara K, Ishii S. A Bayesian missing value estimation method for gene expression profile data. Bioinformatics. 2003;19:2088–2096. doi: 10.1093/bioinformatics/btg287. [DOI] [PubMed] [Google Scholar]
- Chiu CC, Chan SY, Wang CC, Wu WS. Missing value imputation for microarray data: a comprehensive comparison study and a web tool. BMC Syst Biol. 2013;7(Suppl. 6):S12. doi: 10.1186/1752-0509-7-S6-S12. [DOI] [PMC free article] [PubMed] [Google Scholar]
- Lenstra TL, Benschop JJ, Kim T, Schulze JM, Brabers NA, Margaritis T, van de Pasch LA, van Heesch SA, Brok MO, Groot Koerkamp MJ, et al. The specificity and topology of chromatin interaction pathways in yeast. Mol Cell. 2011;42:536–549. doi: 10.1016/j.molcel.2011.03.026. [DOI] [PMC free article] [PubMed] [Google Scholar]
- Osheim YN, French SL, Keck KM, Champion EA, Spasov K, Dragon F, Baserga SJ, Beyer AL. Pre-18S ribosomal RNA is structurally compacted into the SSU processome prior to being cleaved from nascent transcripts in Saccharomyces cerevisiae. Mol Cell. 2004;16:943–954. doi: 10.1016/j.molcel.2004.11.031. [DOI] [PubMed] [Google Scholar]
- Parikh I, Fardo DW, Estus S. Genetics of PICALM expression and Alzheimer's disease. PLoS ONE. 2014;9:e91242. doi: 10.1371/journal.pone.0091242. [DOI] [PMC free article] [PubMed] [Google Scholar]
- Acunzo J, Baylot V, So A, Rocchi P. TCTP as therapeutic target in cancers. Cancer Treat Rev. 2014;40:760–769. doi: 10.1016/j.ctrv.2014.02.007. [DOI] [PubMed] [Google Scholar]
- Ostareck DH, Naarmann-de Vries IS, Ostareck-Lederer A. DDX6 and its orthologs as modulators of cellular and viral RNA expression. Wiley Interdiscip Rev RNA. 2014;5:659–678. doi: 10.1002/wrna.1237. [DOI] [PubMed] [Google Scholar]
- Amson R, Pece S, Marine JC, Di Fiore PP, Telerman A. TPT1/ TCTP-regulated pathways in phenotypic reprogramming. Trends Cell Biol. 2013;23:37–46. doi: 10.1016/j.tcb.2012.10.002. [DOI] [PubMed] [Google Scholar]
- Gilmore JM, Sardiu ME, Venkatesh S, Stutzman B, Peak A, Seidel CW, Workman JL, Florens L, Washburn MP. Characterization of a highly conserved histone related protein, Ydl156w, and its functional associations using quantitative proteomic analyses. Mol Cell Proteomics. 2012;11:M111–M011544. doi: 10.1074/mcp.M111.011544. [DOI] [PMC free article] [PubMed] [Google Scholar]
- Cai Y, Jin J, Yao T, Gottschalk AJ, Swanson SK, Wu S, Shi Y, Washburn MP, Florens L, Conaway RC, et al. YY1 functions with INO80 to activate transcription. Nat Struct Mol Biol. 2007;14:872–874. doi: 10.1038/nsmb1276. [DOI] [PubMed] [Google Scholar]
- Dignam JD, Lebovitz RM, Roeder RG. Accurate transcription initiation by RNA polymerase II in a soluble extract from isolated mammalian nuclei. Nucleic Acids Res. 1983;11:1475–1489. doi: 10.1093/nar/11.5.1475. [DOI] [PMC free article] [PubMed] [Google Scholar]
- Banks CA, Lee ZT, Boanca G, Lakshminarasimhan M, Groppe BD, Wen Z, Hattem GL, Seidel CW, Florens L, Washburn MP. Controlling for gene expression changes in transcription factor protein networks. Mol Cell Proteomics. 2014;13:1510–1522. doi: 10.1074/mcp.M113.033902. [DOI] [PMC free article] [PubMed] [Google Scholar]
- Alter O, Brown PO, Botstein D. Singular value decomposition for genome-wide expression data processing and modeling. Proc Natl Acad Sci USA. 2000;97:10101–10106. doi: 10.1073/pnas.97.18.10101. [DOI] [PMC free article] [PubMed] [Google Scholar]
- Franceschini A, Szklarczyk D, Frankild S, Kuhn M, Simonovic M, Roth A, Lin J, Minguez P, Bork P, von Mering C, et al. STRING v9.1: protein-protein interaction networks, with increased coverage and integration. Nucleic Acids Res. 2013;41:D808–D815. doi: 10.1093/nar/gks1094. [DOI] [PMC free article] [PubMed] [Google Scholar]
- Penkett CJ, Morris JA, Wood V, Bahler J. YOGY: a web-based, integrated database to retrieve protein orthologs and associated Gene Ontology terms. Nucleic Acids Res. 2006;34:W330–W334. doi: 10.1093/nar/gkl311. [DOI] [PMC free article] [PubMed] [Google Scholar]
Associated Data
This section collects any data citations, data availability statements, or supplementary materials included in this article.
Supplementary Materials
Supplementary Table S1
Supplementary Table S2
Supplementary Table S3
Supplementary Table S4
Supplementary Table S5
Supplementary Table S6
Supplementary Table S7
Supplementary Information
Review Process File