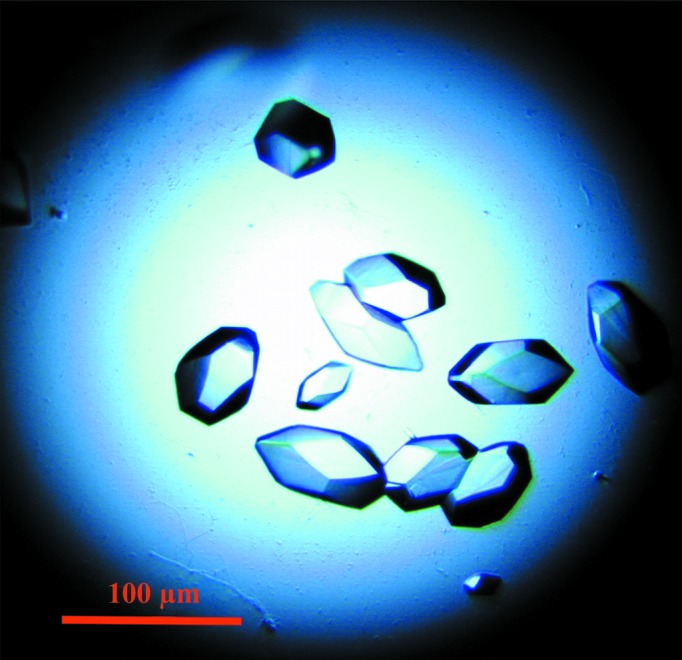
Crystals of the C-terminal part of PorM obtained by limited proteolysis of the purified recombinant protein and grown from PEG solutions were tetragonal (space group P43212) and diffracted to 2.85 Å resolution.
Keywords: Porphyromonas gingivalis, T9SS
Abstract
PorM is a membrane protein involved in the assembly of the type IX secretion system (T9SS) from Porphyromonas gingivalis, a major bacterial pathogen responsible for periodontal disease in humans. The periplasmic domain of PorM was overexpressed in Escherichia coli and purified. A fragment of the purified protein was obtained by limited proteolysis. Crystals of this fragment belonged to the tetragonal space group P43212. Native and MAD data sets were recorded to 2.85 and 3.1 Å resolution, respectively, using synchrotron radiation.
1. Introduction
Periodontal disease, the major cause of tooth loss in industrial nations, is one of the most frequently occurring infectious diseases in humans (Armitage, 1996 ▶). The Gram-negative anaerobic bacterium Porphyromonas gingivalis is a major periodontal pathogen (Bostanci & Belibasakis, 2012 ▶). Tissue damage caused by P. gingivalis is mainly induced by a cocktail of secreted specialized toxin proteins, the gingipains (Fitzpatrick et al., 2009 ▶). The active release of gingipains at the bacterial cell surface is catalyzed by a recently identified multi-protein complex called the type IX secretion system (T9SS; Sato et al., 2010 ▶). This secretion system is composed of at least 14 subunits that are thought to assemble a trans-envelope channel that specifically recruits the gingipains and transports them to the cell surface (Sato et al., 2010 ▶; McBride & Zhu, 2013 ▶). In P. gingivalis, 16 genes have been shown to be involved in gingipain cell-surface display. Among these genes, porX and porY encode a two-component system that is thought to positively regulate the expression of the 14 structural genes porK, porL, porM, porN, porP, porQ, porT, porU, porV, porW, PG26, PG27, PG0534 and sov (Ishiguro et al., 2009 ▶; Sato et al., 2010 ▶; Glew et al., 2012 ▶; Saiki & Konishi, 2010a ▶). Although 14 components of this secretion system have been identified to date, very little is known about the structure of the trans-envelope apparatus and its mechanism of recruitment, selection and transport of gingipains. The PorT and Sov proteins fractionate with the outer membrane (Nguyen et al., 2009 ▶; Saiki & Konishi, 2010b ▶), while the membrane-associated PorK, PorL, PorM and PorN proteins are part of a >1.2 MDa membrane complex (Sato et al., 2010 ▶).
Here, we present the crystallization and preliminary X-ray analysis of the C-terminal fragment of the recombinant PorM periplasmic domain.
2. Materials and methods
2.1. Macromolecule production
The sequence corresponding to the periplasmic domain of the PorM protein (residues 36–516; hereafter denoted pPorM) was amplified from P. gingivalis ATCC33277 (NCBI Protein and Gene accession Nos. PGN_1674 and gi:188595218, respectively) using the primers 5′-CCGAGAACCTGTACTTCCAATCAGATGGTTTCGACAAAGTGGATAAG and 5′-CGGAGCTCGAATTCGGATCCTTATTAGTTCACAATTACTTCAATGGC (sequences annealing on the porM gene are italicized) and cloned into the pLIC03 vector (kindly provided by BioXtal; unpublished work) (Table 1 ▶). The pLIC03 vector was designed for ligation-independent cloning (LIC; Aslanidis & de Jong, 1990 ▶) and is a derivative of the pET-28a+ expression vector (Novagen) in which a cassette coding for a 6×His tag and a Tobacco etch virus (TEV) protease-cleavage site followed by the suicide gene sacB flanked by BsaI restriction sites was introduced downstream of the ATG start codon.
Table 1. Macromolecule-production information.
| Source organism | P. gingivalis |
| DNA source | Chromosomal DNA |
| Forward primer | CCGAGAACCTGTACTTCCAATCAGATGGTTTCGACAAAGTGGATAAG |
| Reverse primer | CGGAGCTCGAATTCGGATCCTTATTAGTTCACAATTACTTCAATGGC |
| Cloning vector | pLIC03 |
| Expression vector | pLIC03:pPorM |
| Expression host | E. coli Rosetta pLysS |
| Complete amino-acid sequence of the construct produced† | MGHHHHHHSSGVDLGTENLYFQSDGFDKVDKSLTSSIDGSDKRNNLVLSELNTAYRTNPEKVKVWYERSLVLQKEADSLCTFIDDLKLAIARESDGKDAKVNDIRRKDNLDASSVVMLNPINGKGSTLRKEVDKFRELVATLMTDKAKLKLIEQALNTESGTKGKSWESSLFENMPTVAAITLLTKLQSDVRYAQGEVLADLVKSVDVGDYRVNSITAQVIPQSQIVMSGDTYKANIVLSSVDTTQRPDVFVNGKLLSPENMGLFTATAGAPGTYPVKGYIEMMGNDGVKIRRDFESEYFVTEPMASVAPTMMNVLYAGIDNPINIAVPGVAQQNVSATINNGTLTRRGNLWIARPTKVGSEAIISVTAQSGGRTIQMAKTTLRVRALPDPLPYIEYKDVQGNTKRFKGGRLGKREILAAGGIKAALDDDLLEVNYTVVKFQLVFYDSMGNSIPEVSDGASFSERQKRQIQNLGKGKRFYVTEVIARGPDGIERKIPAIEVIVN |
The first residue of pPorM is underlined.
pPorM was produced in Rosetta (DE3) pLysS Escherichia coli cells (Novagen) cultured in ZYP-5052 auto-induction medium (Studier, 2005 ▶) at 37°C for 4 h. At this stage, the temperature was decreased to 17°C and the cells were grown for an additional 18 h. The cells were harvested by centrifugation (4000g for 10 min) and the pellet was homogenized and frozen in lysis buffer [50 mM Tris pH 8.0, 300 mM NaCl, 10 mM imidazole, 0.1 mg ml−1 lysozyme, 1 mM phenylmethylsulfonyl fluoride (PMSF)]. After thawing, DNAse I (20 µg ml−1) and MgSO4 (1 mM) were added and the cells were lysed by sonication. The pellet and soluble fractions were separated by centrifugation (16 000g for 30 min). The pPorM domain was purified from the soluble fraction by immobilized metal ion-affinity chromatography using a 5 ml HisTrap Crude (GE Healthcare) Ni2+-chelating column equilibrated in buffer A (50 mM Tris pH 8.0, 300 mM NaCl, 10 mM imidazole). The protein was eluted with buffer A supplemented with 250 mM imidazole and was further purified by size-exclusion chromatography (HiLoad 16/60 Superdex 200 Prep Grade, GE Healthcare) equilibrated in 10 mM HEPES pH 7.5, 150 mM NaCl. For crystallization trials, the purified pPorM domain was concentrated by centrifugation to 5.8 mg ml−1 in the same buffer as used for size-exclusion chromatography using an Amicon 30 kDa cutoff concentrator. The protein concentration was determined by the absorbance of the sample at 280 nm using a NanoDrop 2000 (Thermo Scientific).
For the limited proteolysis assay, 15 µg purified pPorM was incubated with 1:10, 1:100 and 1:1000(w:w) subtilisin, porcine trypsin and endoproteinase Glu-C at 23°C for 1 h. The samples were directly mixed with SDS loading buffer and analysed by SDS–PAGE.
For large-scale limited proteolysis, pPorM purified by nickel-affinity chromatography was incubated overnight at 23°C with 1:1000(w:w) porcine trypsin (Sigma). Proteolysis was quenched by the addition of cOmplete Protease Inhibitor Cocktail (Roche) and the digested pPorM fragment (hereafter called pPorM-T) was purified by size-exclusion chromatography in 10 mM HEPES pH 7.5, 150 mM NaCl. For crystallization trials, the purified pPorM-T was concentrated to 5.9 mg ml−1 using an Amicon concentrator, as described above.
Selenomethionine-substituted (SeMet) pPorM was produced in Rosetta (DE3) pLysS E. coli cells (Novagen) cultured in PASM-5052 auto-induction medium (Studier, 2005 ▶), and the digested SeMet pPorM (SeMet pPorM-T) was purified and concentrated identically to the native pPorM-T. The final concentration of the purified SeMet pPorM-T was 5.5 mg ml−1.
For the size-exclusion chromatography–multi-angle light scattering (SEC-MALS) analysis, the pure pPorM and pPorM-T proteins were concentrated to 5.8 and 5.0 mg ml−1, respectively. Size-exclusion chromatography was carried out on an Alliance 2695 HPLC system (Waters) using a Silica Gel KW803 column (Shodex) equilibrated in 10 mM HEPES pH 7.5, 150 mM NaCl at a flow rate of 0.5 ml min−1. Detection was performed using a triple-angle light-scattering detector (miniDAWN TREOS, Wyatt Technology), a quasi-elastic light-scattering instrument (DynaPro, Wyatt Technology) and a differential refractometer (Optilab rEX, Wyatt Technology).
2.2. Crystallization
Initial crystallization trials of pPorM were performed by the sitting-drop vapour-diffusion method at 293 K in 96-well Greiner plates with Wizard I and II (Emerald Bio), The PEGs Suite (Qiagen) and Crystal Screen and Crystal Screen 2 (Hampton Research) using a Cartesian Honeybee robot (Genomic Solutions). Drops were prepared by mixing different volumes (100, 200 and 300 nl) of protein solution and 100 nl precipitant solution and were equilibrated against a 150 µl reservoir. Crystallization trials of pPorM-T and SeMet pPorM-T were performed as for pPorM with The PEGs Suite (Qiagen). Crystallization hits occurred in several conditions, particularly condition No. 74 [0.2 M zinc acetate, 20%(w/v) PEG 8000]. After optimization (Lartigue et al., 2003 ▶), the final crystallization conditions were 0.02 M sodium acetate pH 4.8–5.8, 0.2 M zinc acetate, 15–25%(w/v) PEG 3350, with a protein-to-well ratio of 3:1(v:v).
2.3. Data collection and processing
Crystals, which appeared within a few days, were mounted in cryo-loops (Hampton CrystalCap Magnetic) and were briefly soaked in crystallization solution [0.2 M zinc acetate, 21.7%(w/v) PEG 3350, 0.02 M sodium acetate pH 4.8 and pH 4.88 for native and SeMet pPorM-T, respectively] supplemented with 20%(v/v) propylene glycol. The crystals were flash-cooled in a nitrogen-gas stream at 100 K using a home cryocooling device (Oxford Cryosystems) and were stored in a basket (Molecular Dimensions). Native pPorM-T diffraction data were collected to 2.85 Å resolution on beamline ID23-1 at the European Synchrotron Research Facility (ESRF), Grenoble, France using a PILATUS 6M-F detector with an active area of 424 × 435 mm (2463 × 2527 pixels of 172 µm). SeMet pPorM-T MAD data were collected to 3.1 Å resolution on the same beamline using a mini-kappa goniometer (Brockhauser et al., 2013 ▶). A fluorescence scan was performed to determine the peak and inflection wavelengths; the exact values were 0.979109 and 0.979336 Å for the peak and inflection, respectively. The remote wavelength was set to 0.976256 Å.
The data sets were integrated with XDS (Kabsch, 2010 ▶) and were scaled with SCALA (Evans, 2006 ▶) from the CCP4 suite v.6.3.0 (Winn et al., 2011 ▶). Data-collection statistics are reported in Table 2 ▶. The Matthews coefficient was calculated with MATTHEWS_COEF (Kantardjieff & Rupp, 2003 ▶) from the CCP4 suite v.6.3.0. Heavy-atom substructure determination, positional refinement, phase calculations and solvent flattening were performed using autoSHARP (Vonrhein et al., 2007 ▶), SHARP (Bricogne et al., 2003 ▶) and SOLOMON (Abrahams & Leslie, 1996 ▶).
Table 2. Data collection and processing.
Values in parentheses are for the outer shell.
| SeMet pPorM-T | ||||
|---|---|---|---|---|
| Native pPorM-T | Se peak | Se inflection | Se remote | |
| Diffraction source | ID23-1, ESRF | ID23-1, ESRF | ||
| Temperature (K) | 100 | 100 | ||
| Detector | PILATUS | PILATUS | ||
| Crystal-to-detector distance (mm) | 533.39 | 608.90 | ||
| Rotation range per image () | 0.1 | 0.1 | ||
| Total rotation range () | 115 | 130 | ||
| Exposure time per image (s) | 0.037 | 0.037 | ||
| Space group | P43212 | P43212 | ||
| a, b, c () | 77.0, 77.0, 228.6 | 77.4, 77.4, 226.9 | ||
| , , () | 90.0, 90.0, 90.0 | 90.0, 90.0, 90.0 | ||
| Resolution range () | 402.85 (3.02.85) | 503.10 (3.273.10) | ||
| Wavelength () | 0.97888 | 0.979109 | 0.979336 | 0.976256 |
| Mosaicity () | 0.06 | 0.07 | 0.07 | 0.08 |
| Total No. of reflections | 135682 (19234) | 118613 (17801) | 119876 (18048) | 120091 (17927) |
| No. of unique reflections | 16929 (2392) | 13029 (1831) | 13060 (1841) | 13069 (1834) |
| Completeness (%) | 99.9 (100.0) | 98.8 (98.8) | 98.8 (98.7) | 99.0 (98.8) |
| Multiplicity | 8.0 (8.0) | 9.1 (9.7) | 9.2 (9.8) | 9.2 (9.8) |
| I/(I) | 14.8 (2.2) | 13.2 (2.8) | 13.1 (2.5) | 16.8 (3.7) |
| R merge † (%) | 7.6 (76.4) | 9.0 (70.9) | 9.2 (81.4) | 7.3 (55.8) |
| CC1/2 ‡ | 99.9 (85.4) | 99.9 (85.1) | 99.7 (80.4) | 99.9 (89.9) |
| Overall B factor from Wilson plot (2) | 92.3 | 108.1 | 109.9 | 104.9 |
| Anomalous completeness (%) | 99.1 (99.3) | 99.2 (99.3) | 99.3 (99.3) | |
| Anomalous multiplicity | 5.1 (5.2) | 5.1 (5.3) | 5.1 (5.3) | |
R
merge = 
 , where I
i(hkl) and I(hkl) are the observed individual and mean intensities of a reflection, respectively,
  is the sum over the individual measurements of a reflection and
  is the sum over all reflections.
CC1/2 is the half data set correlation coefficient (Karplus Diederichs, 2012 ▶).
3. Results and discussion
The Por proteins have recently been identified as components of a novel bacterial secretion system, the T9SS, which is directly related to the pathogenesis of P. gingivalis, the causative bacterial agent of periodontal diseases in humans. Thus, inhibition of the T9SS represents a valuable strategy to block the deleterious action of P. gingivalis. There is therefore a need to gain insight into the composition, assembly and mode of action of the T9SS. To this purpose, we have initiated a structural study on the PorM membrane protein, one of the components of the >1.2 MDa T9SS core complex.
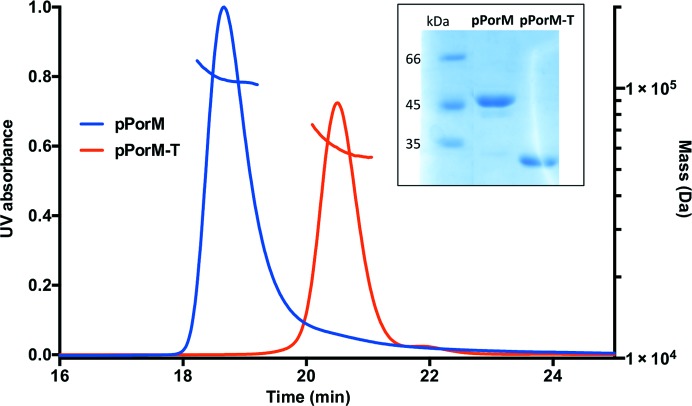
The sequence corresponding to the periplasmic domain of PorM (residues 36–516; pPorM) was cloned and the fragment was produced in E. coli. The purified recombinant pPorM is dimeric in solution, as revealed by SEC-MALS analysis (Fig. 1 ▶). Despite ample crystallization screening, no crystals appeared after the standard 21 d visualization protocol. However, after six months small crystals appeared in a single condition. Meanwhile, we found that the protein was sensitive to degradation. SDS–PAGE analysis of a pPorM protein sample stored at 4°C for a few weeks revealed the presence of low-molecular-weight bands corresponding to degradation products (data not shown). We carried out a limited proteolysis assay with different proteases at different ratios for 1 h. The largest digestion products were obtained with endoproteinase Glu-C and trypsin. However, only overnight incubation with 1:1000(w:w) trypsin resulted in the complete digestion of pPorM to a stable and dimeric protein (pPorM-T; Fig. 1 ▶). Crystals of pPorM-T were obtained in a few days in several conditions and diffracted to 2.85 Å resolution (Fig. 2 ▶). The Matthews coefficient calculated with two molecules in the asymmetric unit is 2.61 Å3 Da−1, corresponding to an estimated solvent content of 53.0%.
Figure 1.
Size-exclusion chromatography–multi-angle light scattering (SEC-MALS) analysis of the periplasmic domain of PorM. Chromatograms of the purified periplasmic domain of PorM (pPorM; blue) and of the digested pPorM (pPorM-T; red) are shown. The measured molar masses are ∼110 and ∼60 kDa for pPorM and pPorM-T, respectively. The inset shows an SDS–PAGE of the samples used for SEC-MALS analysis.
Figure 2.

Crystals of the periplasmic domain of PorM obtained by limited proteolysis of the purified protein (pPorM-T).
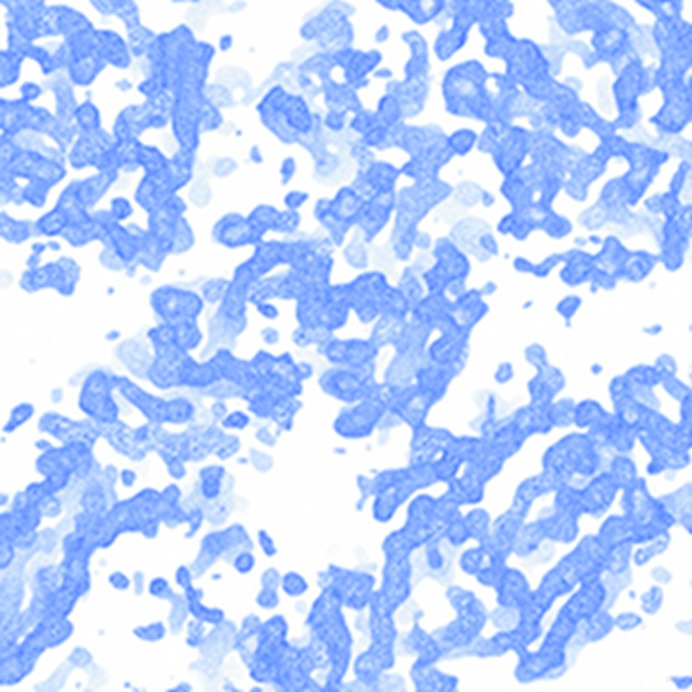
PorM does not share sequence homology with any protein of known structure. In a first attempt to solve the phase problem, we soaked crystals of native pPorM-T in various heavy-atom derivatives. In some cases a weak anomalous signal was detected, but determination of the substructure was not possible. We therefore produced SeMet pPorM-T derivatives, which crystallized readily to give crystals isomorphous to the native pPorM-T crystals. A three-wavelength MAD data set was collected to 3.1 Å resolution and phases were calculated (Fig. 3 ▶). However, automatic model building failed to provide a realistic model. Manual building of the model into the experimental map is currently under way.
Figure 3.
Electron-density map (contoured at 1σ) of the periplasmic domain of PorM obtained by limited proteolysis (pPorM-T).
Acknowledgments
We would like to thank BioXtal for providing the pLIC03 vector and the staff of the European Synchrotron Research Facility (ESRF), Grenoble, France for assistance.
References
- Abrahams, J. P. & Leslie, A. G. W. (1996). Acta Cryst. D52, 30–42. [DOI] [PubMed]
- Armitage, G. C. (1996). Ann. Periodontol. 1, 37–215. [DOI] [PubMed]
- Aslanidis, C. & de Jong, P. J. (1990). Nucleic Acids Res. 18, 6069–6074. [DOI] [PMC free article] [PubMed]
- Bostanci, N. & Belibasakis, G. N. (2012). FEMS Microbiol. Lett. 333, 1–9. [DOI] [PubMed]
- Bricogne, G., Vonrhein, C., Flensburg, C., Schiltz, M. & Paciorek, W. (2003). Acta Cryst. D59, 2023–2030. [DOI] [PubMed]
- Brockhauser, S., Ravelli, R. B. G. & McCarthy, A. A. (2013). Acta Cryst. D69, 1241–1251. [DOI] [PMC free article] [PubMed]
- Evans, P. (2006). Acta Cryst. D62, 72–82. [DOI] [PubMed]
- Fitzpatrick, R. E., Wijeyewickrema, L. C. & Pike, R. N. (2009). Future Microbiol. 4, 471–487. [DOI] [PubMed]
- Glew, M. D., Veith, P. D., Peng, B., Chen, Y.-Y., Gorasia, D. G., Yang, Q., Slakeski, N., Chen, D., Moore, C., Crawford, S. & Reynolds, E. C. (2012). J. Biol. Chem. 287, 24605–24617. [DOI] [PMC free article] [PubMed]
- Ishiguro, I., Saiki, K. & Konishi, K. (2009). FEMS Microbiol. Lett. 292, 261–267. [DOI] [PubMed]
- Kabsch, W. (2010). Acta Cryst. D66, 133–144. [DOI] [PMC free article] [PubMed]
- Kantardjieff, K. A. & Rupp, B. (2003). Protein Sci. 12, 1865–1871. [DOI] [PMC free article] [PubMed]
- Karplus, P. A. & Diederichs, K. (2012). Science, 336, 1030–1033. [DOI] [PMC free article] [PubMed]
- Lartigue, A., Gruez, A., Briand, L., Pernollet, J.-C., Spinelli, S., Tegoni, M. & Cambillau, C. (2003). Acta Cryst. D59, 919–921. [DOI] [PubMed]
- McBride, M. J. & Zhu, Y. (2013). J. Bacteriol. 195, 270–278. [DOI] [PMC free article] [PubMed]
- Nguyen, K.-A., Zylicz, J., Szczesny, P., Sroka, A., Hunter, N. & Potempa, J. (2009). Microbiology, 155, 328–337. [DOI] [PMC free article] [PubMed]
- Saiki, K. & Konishi, K. (2010a). FEMS Microbiol. Lett. 310, 168–174. [DOI] [PubMed]
- Saiki, K. & Konishi, K. (2010b). FEMS Microbiol. Lett. 302, 166–174. [DOI] [PubMed]
- Sato, K., Naito, M., Yukitake, H., Hirakawa, H., Shoji, M., McBride, M. J., Rhodes, R. G. & Nakayama, K. (2010). Proc. Natl Acad. Sci. USA, 107, 276–281. [DOI] [PMC free article] [PubMed]
- Studier, F. W. (2005). Protein Expr. Purif. 41, 207–234. [DOI] [PubMed]
- Vonrhein, C., Blanc, E., Roversi, P. & Bricogne, G. (2007). Methods Mol. Biol. 364, 215–230. [DOI] [PubMed]
- Winn, M. D. et al. (2011). Acta Cryst. D67, 235–242.


