

Abstract
This study tests the hypothesis that prediagnostic serum levels of 20 cancer-associated inflammatory biomarkers correlate directly with future development of head and neck, esophageal, and lung cancers in a high-risk prospective cohort. This is a nested case–control pilot study of subjects enrolled in the Golestan Cohort Study, an ongoing epidemiologic project assessing cancer trends in Golestan, Iran. We measured a panel of 20 21cytokines, chemokines, and inflammatory molecules using Luminex technology in serum samples collected 2 or more years before cancer diagnosis in 78 aerodigestive cancer cases and 81 controls. Data was analyzed using Wilcoxon rank sum test, odds ratios, receiver operating characteristic areas of discrimination, and multivariate analysis. Biomarkers were profoundly and globally elevated in future esophageal and lung cancer patients compared to controls. Odds ratios were significant for association between several biomarkers and future development of esophageal cancer, including interleukin-1Rα (IL-1Ra; 35.9), interferon α2 (IFN-a2; 34.0), fibroblast growth factor-2 (FGF-2; 17.4), and granulocyte/macrophage colony-stimulating factor (GM-CSF; 17.4). The same pattern was observed among future lung cancer cases for G-CSF (27.7), GM-CSF (13.3), and tumor necrosis factor-α (TNF-a; 8.6). By contrast, the majority of biomarkers studied showed no significant correlation with future head and neck cancer development. This study provides the first direct evidence that multiple inflammatory biomarkers are coordinately elevated in future lung and esophageal cancer patients 2 or more years before cancer diagnosis.
Keywords: Aerodigestive cancer, esophageal squamous cell carcinoma, head and neck squamous cell carcinoma, lung cancer, serum inflammatory biomarker
It has long been known that chronic inflammation promotes tumor development, while emerging tumors induce both local and systemic inflammatory responses.1–4 Most cancers are linked to somatic mutations and environmental exposures,5 but excess inflammation can accelerate the malignant transformation, progression, and metastasis of many solid tumors,6 including those of the head and neck, aerodigestive tract,7–11 liver,12 and bladder.13 Recent research also suggests that an inflammatory component may be present in the microenvironment of all neoplastic tissues, even in cancers not causally linked to chronic inflammation.14 This relationship between chronic inflammation and cancer is so ubiquitous that it has been called an “emerging hallmark of cancer”.15
Several serum inflammatory molecules are elevated at the time of diagnosis in patients with aerodigestive tract cancers, including those of the head and neck,16,17 esophagus,18,19 and lung.20–24 A small but growing body of published work suggests that serum levels of some inflammatory biomarkers are significantly upregulated long before tumors are clinically detectable. A recent prospective study by Pine et al.25 found abnormal serum levels of IL-8 years before patients developed lung cancer, and similar studies have shown candidate biomarker derangement several years prior to diagnosis of pancreatic cancer,26 gastric cancer,27 non-Hodgkin's lymphoma,28 and ovarian cancer.29
These preliminary results are promising, as they suggest a possible association between dysregulated serum inflammatory molecules and the future development of certain cancers. Nonetheless, the paucity of such studies among patients with aerodigestive cancer highlights the need for further research to determine the presence and significance of inflammatory dysregulation prior to the emergence of clinically detectable aerodigestive tumors. In this article, we present findings from a nested case–control pilot study of 159 subjects enrolled in the GCS,30 in which we investigated whether serum levels of 21 selected cytokines, chemokines, and other immune markers are associated with the clinical emergence of head and neck, esophageal, and lung cancer at least 2 years later.
Materials and Methods
Study population
The present study is a collaboration with the GCS. The 159 study subjects included in the present study are all cases or controls that were originally enrolled and diagnosed in the GCS. The GCS is a prospective epidemiological study of upper gastrointestinal cancers that recruited 50 045 participants, 40–75 years of age, from rural and urban parts of the eastern Golestan Province of Iran between January 2004 and June 2008.30 Study subjects provided detailed information including age, gender, education level, ethnicity, socioeconomic status, place of residence, diet, and lifelong history of tobacco, alcohol, and opium use at the time of study entry using validated questionnaires.31 Biological samples, including hair, nails, urine, and blood, were collected from each participant after the initial interview. All study subjects signed consent forms when they enrolled in the study, which was approved by the Institutional Review Boards of the Digestive Disease Research Center at Tehran University of Medical Sciences (Tehran, Iran), the International Agency for Research on Cancer, and US National Cancer Institute. (Lyon, France NCI: Bethesda, MD, USA) In addition, researchers received approval for this nested case–control study from the Institutional Review Board of Icahn School of Medicine at Mount Sinai (New York, NY, USA) in 2011.
Of note, the Golestan province in northeastern Iran features rates of aerodigestive tract cancers among the highest in the world, particularly ESCC. The study of inflammation as a risk factor for head and neck, esophageal, and lung cancers can often be confounded by heavy tobacco and alcohol use, which can elevate inflammatory biomarkers independently of cancer. The Golestan population is unique in that rates of smoking and alcohol consumption are very low among both men and women.32 This provides an opportunity to study the relationship between inflammation and cancer in a community with high cancer incidence and low prevalence of typical confounders.
Follow-up and cancer assessment
Since enrolment in the GCS, participants have been actively followed up each year using telephone surveys and/or home visits. Study subjects also receive free healthcare services at the Atrak Clinic, (Gonbad, Iran) a specialized gastrointestinal facility established by the Iranian research team. The majority of gastrointestinal malignancies among study subjects have been diagnosed at this site. In addition, the Atrak Clinic and Golestan Cancer Registry databases are reviewed each month to identify new cancer cases among study subjects. For those diagnosed with cancer, researchers mine medical records for detailed information about site and histology. As of April 2013, 170 ESCC cases have been diagnosed, along with 59 cases of lung cancer and 40 cases of HNSCC. Cases and controls for the present pilot study were selected by researchers in the GCS and matched for age, gender, and tobacco and alcohol use. Matched controls were cancer-free throughout the study period.
Inflammatory biomarkers
Ten-milliliter blood samples were collected from each study subject at the time of enrolment into the study. Samples collected from urban participants were immediately processed in the central laboratory at the GCS Center, whereas samples collected in rural areas were refrigerated (4°C) until they were transferred in cooling boxes to the central laboratory. The maximum time between blood collection and final processing of samples was 8 h. Blood samples were centrifuged and serum was aliquoted into 500-μL straws, which were stored at −80°C. We analyzed 159 serum samples for this pilot study, including 81 cancer-free controls, 36 ESCC cases, 28 lung cancer cases, and 14 HNSCC cases. Study entry required signed informed consent, age 40–75 years at time of study enrolment, no history of cancer prior to GCS enrolment and for at least 2 years after enrolment into the Golestan cohort. Selected samples were transported from the central laboratory at the GCS Center to the Icahn School of Medicine at Mount Sinai laboratory on dry ice and stored at −80°C for subsequent analysis. Aliquots were thawed once and immediately analyzed to maximize reproducibility of assays.
On the day of sample analysis, serum samples were thawed and stored on wet ice. Baseline serum levels of several analytes (IL-1β, -7, -12, -13, -17α, TNF-α, -β, IFN-α2, -γ, GRO, IP-10, MIP1-α, -β, MCP-1, MCP-3, FGF-2, TGF-α, sCD40L, G-CSF, GM-CSF, and IL-1Rα) were measured using Luminex (Austin, TX, USA) xMAP multiplex assays (Luminex), which have been widely used in other biomarker studies.33,34 The Luminex xMAP multianalyte profiling system is a liquid array that combines fluids, optics, and digital signal processing with a color-coded microsphere technology to permit the simultaneous quantitative analysis of up to 500 analytes in a single microtiter well, including cytokines, chemokines, and other inflammatory molecules. The specific multiplex array used in these analyses was the highly sensitive HCYTOMAG-60K magnetic bead panel (EMD Millipore) (Billerica, MA, USA). All samples were measured in duplicate (39 unknown samples per batch) with high- and low-quality control samples on each plate. Samples with analyte values below the lower limit of detection were estimated at half the limit of detection for that analyte. Proportions of samples within detectable range were calculated for each analyte (Table S1).
Statistical analysis
Median and interquartile ranges for each biomarker were reported by disease status. P-values were adjusted for multiple comparisons using the Bonferroni correction, which determined the critical P-value to be ≤0.0025 based on the number of biomarkers assessed.20 Differences in biomarker levels between cases and controls were evaluated by Wilcoxon rank sum test. Each cancer cohort was compared with pooled controls. Matched variables included age, sex, cigarette smoking status at sampling (never, former, current 1–20 cigarettes/day, current >20 cigarettes/day) and pack-years of smoking (none, ≤5, 5.1–10, 10.1–20, and >20 pack-years). To examine associations between serum biomarker levels and future cancer development, ORs and 95% confidence intervals were calculated for the association between biomarker levels and cancers of the esophagus, lung, and head and neck separately using logistic regression models. All statistical analyses were carried out using Stata version 11 statistical software (StataCorp LP, College Station, TX, USA).
Exploratory analyses were carried out on the associations between several demographic and lifestyle factors and biomarker levels in the control group using multiple linear regression models, which included the biomarker of interest, age (continuous), sex, ethnicity (Turkmen vs. non-Turkmen), opium use (ever vs. never), and cigarette smoking (0.1–10 and >10 pack-years vs. never cigarette smokers). As distributions of biomarkers of inflammation were generally severely skewed, we used their log-transformed values.
In addition, an area under ROC curve was calculated for each biomarker using non-parametric ROC analyses. With the same method, sensitivity and specificity of selected biomarkers for predicting the development of each cancer type were calculated. Coefficients of variation (intra-assay and inter-assay) were calculated for each biomarker.
Results
One hundred and fifty-nine individuals were included in this study, including 81 controls, 36 esophageal cancer cases, 28 lung cancer cases, and 14 head and neck cancer cases. Demographic characteristics and cigarette smoking status of cases and controls were analyzed for each study participant (Table1). The mean age of participants was approximately 60 years. Males accounted for 55% of controls, and 50%, 57%, and 71% of participants with esophageal, lung, and head and neck cancer, respectively. The majority of study participants were of Turkmen ethnicity (ranging from 75% to 86% in study cohorts). Among controls, 37% of participants had smoked at some point in life; 25% of esophageal cancer cases and 50% of lung and head and neck cancer cases had smoked at some point in life. There was no significant difference between cohorts for any of the variables described.
Table 1.
Characteristics of Golestan Cohort Study participants at baseline
| Characteristics | Control (n = 81) | Esophageal cancer (n = 36) | Lung cancer (n = 28) | Head and neck cancer (n = 14) |
|---|---|---|---|---|
| Age, mean years (SD) | 59.9 (10.0) | 60.5 (10.2) | 58.8 (9.1) | 60.6 (11.9) |
| Sex | ||||
| Women | 36 (44.4) | 18 (50.0) | 12 (42.9) | 4 (28.6) |
| Men | 45 (55.6) | 18 (50.0) | 16 (57.1) | 10 (71.4) |
| Ethnicity | ||||
| Non-Turkmen | 16 (19.8) | 6 (16.7) | 7 (25.0) | 2 (14.3) |
| Turkmen | 65 (80.2) | 30 (83.3) | 21 (75.0) | 12 (85.7) |
| Cigarette smoking | ||||
| Status | ||||
| Never | 51 (63.0) | 27 (75.0) | 14 (50.0) | 7 (50.0) |
| Former | 7 (8.6) | 3 (8.3) | 1 (3.6) | 2 (14.3) |
| Current, ≤20 cigarettes | 16 (19.7) | 5 (13.9) | 8 (28.6) | 4 (28.6) |
| Current, >20 cigarettes | 7 (8.6) | 1 (2.8) | 5 (17.9) | 1 (7.1) |
| Cumulative use | ||||
| None | 51 (63.0) | 27 (75.0) | 14 (50.0) | 7 (50.0) |
| ≤5 pack-years | 5 (6.2) | 3 (8.3) | 2 (7.1) | 0 (0.0) |
| 5.1–10 | 6 (7.4) | 1 (2.8) | 1 (3.6) | 3 (21.4) |
| 10.1–20 | 6 (7.4) | 1 (2.8) | 3 (10.7) | 2 (14.3) |
| >20 | 13 (16.0) | 4 (11.1) | 8 (28.6) | 2 (14.3) |
Except for age, values are shown as n (%). Using t-tests (for age) and χ2-tests or Fisher's exact tests (for categorical variables), there was no difference between values in each cancer group and in the control group.
Coefficients of variation (intra-assay and inter-assay) were calculated for each biomarker (Table S1), which ranged from 4.4% to 21.7% for intra-assay coefficients, and from 6.1% to 34.7% for inter-assay values. The proportion of samples within the measurable range was also calculated for each biomarker (Table S2). Our first Luminex assay analyzed 28 inflammatory molecules of potential interest. However, as the results for several biomarkers (IL-2, -4, -5, -6, -8, -10, and vascular endothelial growth factor) were universally low and at similar levels among the four cohorts, these seven were dropped from the remainder of the analyses.
Median serum levels and interquartile ranges of the studied biomarkers of inflammation by disease status are shown in Table2. Most biomarker levels at baseline were much higher in eventual esophageal cancer and lung cancer patients than in controls (Fig.1). Several biomarkers showed marked differences in median levels between controls and future esophageal and lung cancer cases. The median serum level of FGF-2 among controls was 139.6 pg/mL, whereas that among future esophageal and lung cancer cases was found to be 341.9 pg/mL and 306.7 pg/mL, respectively (P < 0.0001). Trends were similar for many other biomarkers studied, including GM-CSF, IFN-α2, IL-1RF, and TNF-α. Median serum concentration of each of these biomarkers was greater than double among future esophageal and lung cancer cases as compared to controls (all, P < 0.0001). By contrast, these trends were not observed among individuals who later developed head and neck cancer, for whom no values were significant when using the Bonferroni-corrected P-value of 0.0025.
Table 2.
Medians (interquartile ranges) of inflammatory biomarkers by disease status (pg/mL) in Golestan Cohort Study participants
| Biomarker | Control (n = 81) | Esophageal cancer (n = 36) | P-value | Lung cancer(n = 28) | P-value | Head and neck cancer (n = 14) | P-value |
|---|---|---|---|---|---|---|---|
| FGF-2 | 139.6 (120.6–182.7) | 341.9 (217.4–515.3) | <0.0001* | 306.7 (246.4–476.2) | <0.0001* | 194.8 (152.4–265.8) | 0.04 |
| G-CSF | 107.4 (85.3–148.1) | 239.8 (137.6–480.9) | <0.0001* | 222.5 (141.9–401.7) | <0.0001* | 139.4 (121.6–198.2) | 0.08 |
| GM-CSF | 21.3 (14.5–31.1) | 63.7 (39.8–153.1) | <0.0001* | 63.3 (36.4–115.3) | <0.0001* | 33.7 (23.5–48.4) | 0.03 |
| GRO | 450.1 (299.1–718.3) | 599.3 (389.8–850.3) | 0.0500 | 592.3 (393.1–972.0) | 0.0400 | 654.4 (388.7–1037.7) | 0.17 |
| IFN-α2 | 67.6 (35.0–108.3) | 245.3 (139.3–502.0) | <0.0001* | 251.0 (145.9–466.7) | <0.0001* | 124.7 (86.7–189.0) | 0.03 |
| IFN-γ | 18.8 (11.9–22.6) | 39.8 (23.4–65.5) | <0.0001* | 40.7 (23.6–67.2) | <0.0001* | 17.9 (11.6–25.1) | 0.68 |
| IL-12p70 | 20.5 (13.3–39.0) | 102.5 (43.5–269.5) | <0.0001* | 81.4 (48.2–173.6) | <0.0001* | 26.9 (15.8–46.7) | 0.36 |
| IL-13 | 11.1 (7.6–16.2) | 33.1 (18.4–64.9) | <0.0001* | 29.4 (14.0–54.1) | <0.0001* | 8.7 (3.2–13.9) | 0.14 |
| IL-17α | 7.6 (4.7–10.9) | 24.5 (11.1–46.6) | <0.0001* | 25.0 (13.9–40.4) | <0.0001* | 11.0 (5.9–15.1) | 0.14 |
| IL-1Rα | 116.2 (90.3–179.8) | 415.0 (232.2–1254.5) | <0.0001* | 413.2 (207.9–760.1) | <0.0001* | 202.8 (137.3–244.5) | 0.03 |
| IL-1β | 6.2 (4.5–10.4) | 20.4 (9.5–37.3) | 0.0001* | 14.2 (8.6–30.6) | 0.0020* | 4.7(3.2–9.5) | 0.24 |
| IL-7 | 30.1 (19.8–45.4) | 91.9 (45.7–174.9) | <0.0001* | 81.6 (42.6–173.6) | <0.0001* | 32.7 (26.9–47.9) | 0.41 |
| IP-10 | 357.8 (282.7–501.0) | 509.8 (309.5–828.2) | 0.0300 | 569.3 (458.5–825.4) | 0.0002* | 375.7 (297.2–512.7) | 0.62 |
| MCP-1 | 262.4 (187.5–316.0) | 291.8 (209.3–478.0) | 0.0500 | 361.0 (249.4–491.1) | 0.0009* | 339.6 (252.5–377.4) | 0.03 |
| MCP-3 | 29.9 (14.2–42.6) | 76.3 (53.7–119.4) | <0.0001* | 68.6 (52.7–106.2) | <0.0001* | 40.5 (30.7–55.2) | 0.23 |
| MIP-1α | 10.1 (3.0–19.7) | 26.4 (14.2–44.0) | 0.0500 | 25.3 (16.4–38.9) | 0.0002* | 10.7 (3.2–15.3) | 0.68 |
| MIP-1β | 64.4 (40.8–95.8) | 137.1 (90.4–242.8) | <0.0001* | 128.3 (87.4–238.2) | <0.0001* | 74.7 (63.6–99.8) | 0.27 |
| sCD40L | 5728.5 (1835.5–9545.0) | 9831.0 (4070.0–14212.0) | 0.0002* | 8476.0 (3866.8–14212.0) | 0.0100 | 4848.5 (1563.0–10000.0) | 0.87 |
| TGF-α | 3.9 (2.3–8.2) | 15.1 (6.8–28.7) | <0.0001* | 14.0 (6.5–22.1) | <0.0001* | 4.6 (3.2–6.8) | 0.67 |
| TNF-α | 18.8 (13.2–25.0) | 31.1 (21.2–77.7) | <0.0001* | 34.9 (24.5–80.4) | <0.0001* | 18.4 (14.8–23.7) | 0.71 |
| TNF-β | 5.7 (0.9–10.1) | 21.2 (10.2–33.1) | <0.0001* | 17.7 (9.8–31.2) | <0.0001* | 9.3 (3.2–13.5) | 0.03 |
Data points that still achieve significance using a more rigorous P-value of 0.0025, obtained using the Bonferroni correction for multiple comparison. FGF, fibroblast growth factor; G-CSF, granulocyte colony-stimulating factor; GM-CSF, granulocyte/macrophage colony-stimulating factor; GRO, growth-related oncogene; IFN, interferon; IL, interleukin; IP-10, interferon-γ-inducible protein-10; MCP, monocyte chemoattractant protein; MIP, macrophage inflammatory protein; sCD40L, soluble CD40 ligand; TGF, transforming growth factor; TNF, tumor necrosis factor.
Fig 1.
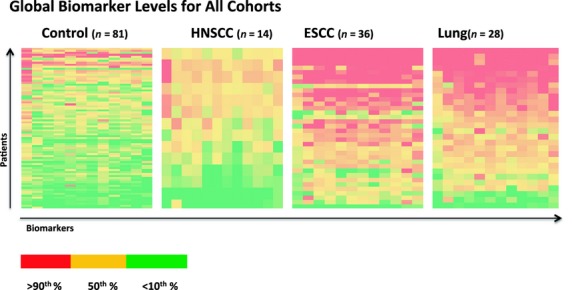
Global representation of baseline serum levels of 21 cancer-associated biomarkers (interleukin [IL]-1β, -7, -12, -13, -17α, tumor necrosis factor [TNF]-α, TNF-β, interferon [IFN]-α2, IFN-γ, growth-related oncogene, interferon-γ-inducible protein-10, macrophage inflammatory protein [MIP]1-α, MIP1-β, monocyte chemoattractant protein-3, fibroblast growth factor-2, transforming growth factor-α, soluble CD40 ligand, granulocyte colony-stimulating factor, granulocyte/macrophage colony-stimulating factor, and IL-1Rα) in esophageal cancer, lung cancer, and head and neck cancer patients and matched controls at least 2 years prior to diagnosis. Biomarker levels in red reflect serum values above the 90th percentile of results, those in yellow represent biomarkers at the 50th percentile, and those in green represent levels below the 10th percentile of results. ESCC, esophageal squamous cell carcinoma; HNSCC, head and neck squamous cell carcinoma.
Odds ratios (with 95% confidence intervals) were calculated to determine the association between baseline serum biomarker levels and the development of cancer over time. Elevated prediagnostic serum levels of several biomarkers were found to be strongly associated with the later development of esophageal cancer, including IL-1Rα (OR 35.88, 4.69–274.51), IFN-α2 (OR 34, 4.44–260.51), FGF-2 (OR 17.43, 3.92–77.4), and IL-12p70 (OR 17, 3.82–75.57). Among patients who went on to develop lung cancer, elevated baseline levels of G-CSF (OR 27.68, 3.59–213.46), GM-CSF (OR 13.33, 2.97–59.89), IL-1Rα (OR 8.54, 2.39–30.55), and IL12-p70 (OR 8.33, 2.33–29.83) were most strongly associated with future cancer development. By contrast, only elevated baseline levels of IFN-α2 showed a significant association with future development of HNSCC (OR 6, 1.26–28.55) (Table3). Regression coefficients were used to determine associations between baseline serum biomarker levels and other variables in the control group. Biomarker levels were found to be higher with older age, Turkmen ethnicity, and cigarette smoking, but lower in men and among opium users. GRO and sCD40L showed opposite correlations. The majority of these results were not significant. Significant associations were observed between these variables and a few specific biomarkers: Turkmen ethnicity (RC = 1.15; P = 0.02) and smoking (RC = 1.68; P = 0.03) were associated with higher levels of IL-1β among controls. Of note, male gender and opium use were both associated with lower levels of most of the serum inflammatory biomarkers studied. These observations were significant for TNF-β, IL-7, and MIP-1β (Table4).
Table 3.
Odds ratios (95% confidence intervals) for the association between biomarker levels and esophageal, lung, and head and neck cancers in Golestan Cohort Study participants
| Biomarker | Esophageal cancer | Lung cancer | Head and neck cancer |
|---|---|---|---|
| FGF-2 | 17.43 (3.92–77.4) | 4.72 (1.63–13.62) | 3.76 (0.98–14.48) |
| G-CSF | 5.13 (1.93–13.64) | 27.68 (3.59–213.46) | 3.76 (0.98–14.48) |
| GM-CSF | 17.43 (3.92–77.40) | 13.33 (2.97–59.89) | 3.76 (0.98–14.48) |
| GRO | 1.81 (0.81–4.07) | 1.85 (0.76–4.49) | 1.85 (0.57–5.99) |
| IFN-α2 | 34 (4.44–260.51) | 8.33 (2.33–29.83) | 6 (1.26–28.55) |
| IFN-γ | 5 (1.87–13.36) | 8 (2.23–28.76) | 1.6 (0.48–5.32) |
| IL-12p70 | 17 (3.82–75.57) | 8.33 (2.33–29.83) | 1.8 (0.55–5.84) |
| IL-13 | 10.67 (3.01–37.75) | 4.6 (1.58–13.33) | 0.75 (0.24–2.36) |
| IL-17α | 6.36 (2.25–17.98) | 8.54 (2.39–30.55) | 2.56 (0.74–8.84) |
| IL-1Rα | 35.88 (4.69–274.51) | 8.54 (2.39–30.55) | 12.3 (1.53–99.05) |
| IL-1β | 4 (1.57–10.21) | 4.6 (1.59–13.3) | 0.75 (0.24–2.36) |
| IL-7 | 11 (3.12–38.81) | 6 (1.91–18.87) | 1.33 (0.42–4.19) |
| IP-10 | 1.61 (0.72–3.58) | 6.15 (1.96–19.32) | 1.85 (0.57–5.99) |
| MCP-1 | 1.61 (0.72–3.58) | 3.08 (1.18–8.03) | 2.56 (0.74–8.84) |
| MCP-3 | 10.94 (3.09–38.68) | 8.55 (2.39–30.62) | 3.4 (0.87–13.37) |
| MIP-1α | 5 (1.88–13.32) | 8.33 (2.33–29.83) | 1 (0.32–3.11) |
| MIP-1β | 17.43 (3.92–77.4) | 6.15 (1.96–19.32) | 2.56 (0.74–8.84) |
| sCD40L | 2.27 (0.99–5.23) | 1.8 (0.74–4.38) | 0.75 (0.24–2.36) |
| TGF-α | 6.15 (2.17–17.49) | 8.55 (2.39–30.62) | 1.37 (0.43–4.3) |
| TNF-α | 8.2 (2.66–25.31) | 8.55 (2.39–30.55) | 0.77 (0.24–2.41) |
| TNF-β | 5 (1.88–13.32) | 6 (1.91–18.87) | 2.25 (0.64–7.91) |
FGF, fibroblast growth factor; G-CSF, granulocyte colony-stimulating factor; GM-CSF, granulocyte/macrophage colony-stimulating factor; GRO, growth-related oncogene; IFN, interferon; IL, interleukin; IP-10, interferon-γ-inducible protein-10; MCP, monocyte chemoattractant protein; MIP, macrophage inflammatory protein; sCD40L, soluble CD40 ligand; TGF, transforming growth factor; TNF, tumor necrosis factor.
Table 4.
Association between selected demographic and lifestyle factors and biomarkers among Golestan Cohort Study controls: Regression coefficients (P-value)
| Biomarker | Age, years (continuous) | Sex, men (n = 26) | Ethnicity, Turkmen (n = 39) | Opium use, ever (n = 7) | Cigarette use, pack years | |
|---|---|---|---|---|---|---|
| 0.1–10 (n = 6) | >10 (n = 9) | |||||
| FGF-2 | 0.01 (0.13) | −0.19 (0.07) | 0.07 (0.59) | −0.23 (0.15) | 0.08 (0.62) | 0.19 (0.26) |
| G-CSF | 0.00 (0.55) | 0.03 (0.85) | 0.13 (0.43) | −0.24 (0.23) | 0.10 (0.61) | 0.22 (0.31) |
| GM-CSF | 0.00 (0.55) | −0.05 (0.71) | 0.16 (0.40) | −0.20 (0.38) | −0.27 (0.23) | 0.18 (0.46) |
| GRO | −0.01 (0.17) | 0.14 (0.58) | −0.30 (0.35) | 0.66 (0.09) | −0.57 (0.15) | −0.77 (0.07) |
| IFN-α2 | 0.01 (0.71) | −0.58 (0.13) | 0.26 (0.59) | −0.82 (0.16) | 0.35 (0.55) | 0.51 (0.41) |
| IFN-γ | 0.00 (0.70) | −0.01 (0.97) | 0.30 (0.26) | −0.30 (0.34) | 0.13 (0.67) | 0.24 (0.47) |
| IL-12p70 | 0.01 (0.19) | −0.25 (0.31) | 0.12 (0.72) | −0.60 (0.12) | 0.04 (0.91) | 0.58 (0.17) |
| IL-13 | 0.00 (0.61) | −0.27 (0.09) | 0.20 (0.32) | −0.28 (0.23) | 0.05 (0.85) | 0.17 (0.51) |
| IL-17α | 0.01 (0.40) | −0.21 (0.23) | 0.16 (0.49) | −0.26 (0.34) | 0.06 (0.83) | 0.55 (0.06) |
| IL-1Rα | 0.01 (0.40) | −0.29 (0.16) | 0.28 (0.29) | −0.42 (0.19) | 0.11 (0.71) | 0.40 (0.24) |
| IL-1β | 0.02 (0.38) | −0.52 (0.25) | 1.15 (0.05) | −1.28 (0.07) | 0.52 (0.46) | 1.68 (0.03) |
| IL-7 | 0.01 (0.19) | −0.31 (0.15) | 0.15 (0.58) | −0.70 (0.04) | 0.31 (0.34) | 0.54 (0.13) |
| IP-10 | 0.01 (0.13) | −0.30 (0.11) | 0.43 (0.08) | −0.49 (0.09) | −0.01 (0.97) | 0.27 (0.37) |
| MCP-1 | 0.01 (0.30) | −0.27 (0.17) | 0.25 (0.33) | −0.25 (0.41) | 0.32 (0.30) | 0.54 (0.10) |
| MIP-1α | 0.03 (0.28) | −0.44 (0.49) | 0.47 (0.58) | −1.42 (0.16) | 0.85 (0.39) | 0.80 (0.45) |
| MIP-1β | 0.02 (0.26) | −0.49 (0.29) | 0.78 (0.19) | −1.56 (0.03) | 0.60 (0.40) | 0.96 (0.21) |
| MCP-3 | 0.00 (0.91) | −0.51 (0.10) | 0.25 (0.54) | −0.44 (0.35) | 0.09 (0.84) | 0.20 (0.70) |
| PGE-2 | −0.03 (0.10) | 0.03 (0.94) | 0.25 (0.68) | −0.49 (0.42) | −0.15 (0.83) | 0.75 (0.29) |
| sCD40L | 0.00 (0.91) | 0.44 (0.25) | −0.27 (0.58) | 0.73 (0.21) | −0.51 (0.39) | −1.23 (0.06) |
| TGF-α | 0.02 (0.05) | −0.25 (0.36) | 0.25 (0.49) | −0.71 (0.09) | 0.10 (0.82) | 0.27 (0.55) |
| TNF-α | 0.02 (0.12) | −0.27 (0.43) | 0.63 (0.16) | −1.01 (0.06) | 0.43 (0.41) | 0.83 (0.14) |
| TNF-β | 0.01 (0.59) | −1.16 (0.01) | 0.43 (0.42) | −0.27 (0.67) | 0.40 (0.53) | 1.02 (0.14) |
Reference groups for categorical variables were as follows: sex, women (n = 22); ethnicity, non-Turkmen (n = 9); opium, never-users (n = 41); and cigarette use, never-users (n = 33). FGF, fibroblast growth factor; G-CSF, granulocyte colony-stimulating factor; GM-CSF, granulocyte/macrophage colony-stimulating factor; GRO, growth-related oncogene; IFN, interferon; IL, interleukin; IP, interferon-γ-inducible protein; MCP, monocyte chemoattractant protein; MIP, macrophage inflammatory protein; PGE-2, prostaglandin E2; sCD40L, soluble CD40 ligand; TGF, transforming growth factor; TNF, tumor necrosis factor.
The ROC areas for discrimination of head and neck, lung, and esophageal cancers from controls were also calculated for each biomarker studied (Table S3). The highest ROC area was 88% for esophageal cancer (GM-CSF and IFN-α2) and 85% for lung cancer (GM-CSF). None of the biomarkers had a ROC area >69% for discrimination of head and neck cancer patients from controls. We selected five biomarkers that showed highest ROC in all three cancers, including FGF-2, GM-CSF, IFN-α2, IL-1R, and TNF-α, These biomarkers showed moderate ability to discriminate cancer patients from controls (Table S4). As these variables were highly correlated, combining these biomarkers did not markedly increase discrimination (data not shown).
Discussion
This pilot study is an investigation of the association between prediagnostic serum inflammatory biomarkers levels and future development of aerodigestive tract cancers. In this study cohort, baseline levels of a wide range of cancer-associated serum inflammatory biomarkers were grossly elevated at least 2 years prior to diagnosis among individuals who went on to develop lung and esophageal cancer as compared to future head and neck cancer patients and matched controls (Fig.1). Elevated levels of IL-1Rα, IFN-α2, FGF-2, and IL-12p70 showed the strongest correlation with future esophageal cancer development. Among future lung cancer patients, elevated baseline levels of G-CSF, GM-CSF, IL-1Rα, and IL12-p70 showed the strongest association with cancer development. There were no strong associations between elevated levels of the biomarkers studied and future development of head and neck cancer.
Abundant research has shown many of the biomarkers studied here to be elevated among individuals with established cancers at or after the time of diagnosis. As these molecules modulate multiple immune/inflammatory responses, the specific roles of each biomarker in promoting carcinogenesis are complex and multifactorial. Nonetheless, the biomarkers found to be most strongly correlated with future lung and/or esophageal cancer in this study were either Th1-cell stimulating inflammatory molecules (IL-1Rα, IL-12p70, IFN-α2) or growth factors (FGF-2, G-CSF, GM-CSF). Interleukin-1Rα, IL-12p70, and IFN-α2 impact a variety of inflammatory signaling pathways involved in the response to viral infection. Fibroblast growth factor-2 promotes angiogenesis, while G-CSF inhibits apoptosis and GM-CSF acts as a growth factor for white blood cells.
Recent research has suggested that elevated levels of certain prediagnostic inflammatory biomarkers may also be associated with an increased likelihood of developing cancer over time. Multiple studies have shown elevated serum levels of C-reactive protein to be associated with an increased risk of developing lung cancer.25,35–38 A nested case–control study found an association between elevated serum levels of several biomarkers (IL-2, -4, -6, -12(p40), and -13) and the development of epithelial ovarian cancer up to 5 years later.29 Another nested case–control study within the prostate, lung, colorectal, ovarian cohort reported that among future non-Hodgkin's lymphoma patients, elevations in serum soluble TNF receptor 1 and soluble CD27 were present over 6 years prior to diagnosis.28 These findings support the hypothesis that inflammatory biomarkers may become deranged long before some cancers are clinically detectable. However, patterns of inflammatory dysregulation are likely cancer-specific, and the utility of this technique may vary depending on the cancer being studied.
While there is a correlation between baseline serum inflammatory biomarker levels and future lung and esophageal cancer development in this cohort, it remains unclear why such striking patterns of inflammatory dysregulation are observed 2 or more years prior to cancer diagnosis, particularly when there are no significant differences between cases and controls regarding age, ethnicity, and smoking patterns. We offer two potential explanations for this observation. First, this association may be driven by exposure to an as-yet-unidentified inflammatory carcinogen among this patient population. Several risk factors for esophageal squamous cell carcinoma are specific to the community living in Golestan, Iran, including consumption of very hot tea, low fruit and vegetable intake, and low socioeconomic status.30 Replication of this study in prospective cohorts with different patterns of risk factors is essential to elucidate this question further. By contrast, these findings may suggest that immune dysregulation is the first detectable sign of an existing, indolent lung or esophageal carcinoma that is small enough to evade clinical detection, as Purdue et al.28 suggested in their analysis of elevated inflammatory biomarkers among future non-Hodgkin's lymphoma cases. Assessing biomarker levels in a prospective cohort at multiple time points prior to cancer diagnosis may further clarify the underlying mechanism at work here.
Another surprising observation in this study is that inflammatory biomarkers are markedly upregulated in future lung and esophageal cancer patients, whereas inflammatory profiles among individuals who later develop head and neck cancer are similar to those of the control population. This finding is of particular interest, as substantial research has already indicated the role of chronic inflammatory dysfunction in the pathogenesis and progression of head and neck cancers. It is difficult to make strong conclusions about these results due to the small number of head and neck cancer patients included in this pilot study. These findings must be validated in a future prospective study that includes a larger number of head and neck cancer patients and stratifies by human papillomavirus status.
This study has several strengths. It is among the first to assess a broad panel of inflammatory biomarkers in prediagnostic serum samples of patients who later developed head and neck, lung, and esophageal cancers. It also features a study population that, due to relatively low rates of tobacco and alcohol use, provides a unique opportunity to examine the relationship between inflammatory molecules and cancer with reduced confounding by known inflammatory carcinogens.
This study also has several limitations. As it is a small pilot study designed to assess feasibility, our findings are suggestive rather than definitive. Nonetheless, the strong trend towards elevated serum inflammatory biomarkers observed among future esophageal and lung cancer patients justify validation of these observations in a larger prospective study. In addition, findings from this study may not be generalizable to a Western population of lung and esophageal cancer patients, as the community in Golestan has a unique set of environmental exposures, cultural practices, and genetic predispositions. These variables may explain why this study did not find elevated levels of pro-inflammatory cytokines IL-6 and IL-8 among subjects who later developed lung cancer, whereas previous studies have noted a correlation between individuals with elevated prediagnostic levels of these biomarkers and future development of lung cancer.25 Given the substantial number of differences between this population and others that have previously been studied, follow-up studies in both Western and international populations are necessary to determine validity and reproducibility of these findings.
In summary, we found significantly increased levels of multiple biomarkers of inflammation in persons who went on to develop esophageal and lung cancer, at least 2 years prior to cancer development. These findings may represent exposure to an unknown inflammatory carcinogen, or inflammation associated with occult cancer long before it becomes clinically detectable. Several of the biomarkers studied showed strong association with future esophageal and lung cancer development, suggesting that they might be useful as predictive biomarkers. These results need to be validated in future studies that will include other populations and assesses biomarker trends at multiple time points prior to cancer development.
Acknowledgments
This study was supported by the US National Cancer Institute (grant R03DE0217141) and US National Institute of Dental and Craniofacial Research (grant K08CA154963) (to A.S.), as well as the ISMMS Department of Otolaryngology Steven Sacks Clinical Research Fellowship (to B.K.). The Golestan Cohort Study was supported by Tehran University of Medical Sciences (grant no. 81/15), Cancer Research UK (grant no. C20/A5860), the Intramural Research Program of the US National Cancer Institute, and various collaborative research agreements with the International Agency for Research on Cancer.
Glossary
Abbreviations
- ESCC
esophageal squamous cell carcinoma
- FGF
fibroblast growth factor
- GCS
Golestan Cohort Study
- G-CSF
granulocyte colony-stimulating factor
- GM-CSF
granulocyte/macrophage colony-stimulating factor
- GRO
growth-related oncogene
- HNSCC
head and neck squamous cell carcinoma
- IFN
interferon
- IL
interleukin
- IP
interferon-γ-inducible protein
- MCP
monocyte chemoattractant protein
- MIP
macrophage inflammatory protein
- OR
odds ratio
- RC
regression coefficient
- ROC
receiver operating characteristic
- sCD40L
soluble CD40 ligand
- TGF
transforming growth factor
- TNF
tumor necrosis factor
Disclosure Statement
The authors have no conflict of interest.
Supporting Information
Additional supporting information may be found in the online version of this article:
Table S1. Intra-assay and inter-assay coefficients of variation for biomarkers for discrimination of esophageal, lung, and head and neck cases from controls in the Golestan Cohort Study.
Table S2. Proportion (%) of biomarkers for discrimination of esophageal, lung, and head and neck cases from controls in the Golestan Cohort Study, within detectable range.
Table S3. Receiver operating characteristic area (95% confidence interval) for biomarkers for discrimination of esophageal, lung, and head and neck cancer cases versus controls in the Golestan Cohort Study.
Table S4. Sensitivity and specificity of selected biomarkers for discrimination of esophageal, lung, and head and neck cases from controls in the Golestan Cohort Study. Values represent those that showed highest discrimination of cancer sites from controls.
References
- Balkwill F, Mantovani A. Inflammation and cancer: back to Virchow? Lancet. 2001;357:539–45. doi: 10.1016/S0140-6736(00)04046-0. [DOI] [PubMed] [Google Scholar]
- Coussens LM, Werb Z. Inflammation and cancer. Nature. 2002;420:860–7. doi: 10.1038/nature01322. [DOI] [PMC free article] [PubMed] [Google Scholar]
- Grivennikov SI, Greten FR, Karin M. Immunity, inflammation, and cancer. Cell. 2010;140:883–99. doi: 10.1016/j.cell.2010.01.025. [DOI] [PMC free article] [PubMed] [Google Scholar]
- Shacter E, Weitzman SA. Chronic inflammation and cancer. Oncology. 2002;16:217–26. ; discussion 30–2. [PubMed] [Google Scholar]
- Aggarwal BB, Vijayalekshmi RV, Sung B. Targeting inflammatory pathways for prevention and therapy of cancer: short-term friend, long-term foe. Clin Cancer Res. 2009;15:425–30. doi: 10.1158/1078-0432.CCR-08-0149. [DOI] [PubMed] [Google Scholar]
- Peek RM, Jr, Mohla S, DuBois RN. Inflammation in the genesis and perpetuation of cancer: summary and recommendations from a national cancer institute-sponsored meeting. Cancer Res. 2005;65:8583–6. doi: 10.1158/0008-5472.CAN-05-1777. [DOI] [PubMed] [Google Scholar]
- McCann J. Esophageal cancers: changing character, increasing incidence. J Natl Cancer Inst. 1999;91:497–8. doi: 10.1093/jnci/91.6.497. [DOI] [PubMed] [Google Scholar]
- Nicholson A, Jankowski J. Acid reflux and oesophageal cancer. Recent Results Cancer Res. 2011;185:65–82. doi: 10.1007/978-3-642-03503-6_4. [DOI] [PubMed] [Google Scholar]
- Williams MP, Pounder RE. Helicobacter pylori: from the benign to the malignant. Am J Gastroenterol. 1999;94:S11–6. doi: 10.1016/s0002-9270(99)00657-7. [DOI] [PubMed] [Google Scholar]
- Malkinson AM, Bauer A, Meyer A, et al. Experimental evidence from an animal model of adenocarcinoma that chronic inflammation enhances lung cancer risk. Chest. 2000;117:228S. doi: 10.1378/chest.117.5_suppl_1.228s. [DOI] [PubMed] [Google Scholar]
- Farrell RJ, Peppercorn MA. Ulcerative colitis. Lancet. 2002;359:331–40. doi: 10.1016/S0140-6736(02)07499-8. [DOI] [PubMed] [Google Scholar]
- Imperial JC. Natural history of chronic hepatitis B and C. J Gastroenterol Hepatol. 1999;14(Suppl):S1–5. doi: 10.1046/j.1440-1746.1999.01903.x. [DOI] [PubMed] [Google Scholar]
- Badawi AF, Mostafa MH, Probert A, O'Connor PJ. Role of schistosomiasis in human bladder cancer: evidence of association, aetiological factors, and basic mechanisms of carcinogenesis. Eur J Cancer Prev. 1995;4:45–59. doi: 10.1097/00008469-199502000-00004. [DOI] [PubMed] [Google Scholar]
- Colotta F, Allavena P, Sica A, Garlanda C, Mantovani A. Cancer-related inflammation, the seventh hallmark of cancer: links to genetic instability. Carcinogenesis. 2009;30:1073–81. doi: 10.1093/carcin/bgp127. [DOI] [PubMed] [Google Scholar]
- Hanahan D, Weinberg RA. Hallmarks of cancer: the next generation. Cell. 2011;144:646–74. doi: 10.1016/j.cell.2011.02.013. [DOI] [PubMed] [Google Scholar]
- Linkov F, Lisovich A, Yurkovetsky Z, et al. Early detection of head and neck cancer: development of a novel screening tool using multiplexed immunobead-based biomarker profiling. Cancer Epidemiol Biomarkers Prev. 2007;16:102–7. doi: 10.1158/1055-9965.EPI-06-0602. [DOI] [PubMed] [Google Scholar]
- Melinceanu L, Lerescu L, Tucureanu C, et al. Serum perioperative profile of cytokines in patients with squamous cell carcinoma of the larynx. J Otolaryngol Head Neck Surg. 2011;40:143–50. [PubMed] [Google Scholar]
- Diakowska D, Markocka-Maczka K, Grabowski K, Lewandowski A. Serum interleukin-12 and interleukin-18 levels in patients with oesophageal squamous cell carcinoma. Exp Oncol. 2006;28:319–22. [PubMed] [Google Scholar]
- Wallner G, Ciechanski A, Dabrowski A, et al. Vascular endothelial growth factor and basic fibroblast growth factor in patients with squamous cell oesophageal cancer. Folia Histochem Cytobiol. 2001;39(Suppl 2):122–3. [PubMed] [Google Scholar]
- Brichory FM, Misek DE, Yim AM, et al. An immune response manifested by the common occurrence of annexins I and II autoantibodies and high circulating levels of IL-6 in lung cancer. Proc Natl Acad Sci USA. 2001;98:9824–9. doi: 10.1073/pnas.171320598. [DOI] [PMC free article] [PubMed] [Google Scholar]
- Kaminska J, Kowalska M, Kotowicz B, et al. Pretreatment serum levels of cytokines and cytokine receptors in patients with non-small cell lung cancer, and correlations with clinicopathological features and prognosis. M-CSF – an independent prognostic factor. Oncology. 2006;70:115–25. doi: 10.1159/000093002. [DOI] [PubMed] [Google Scholar]
- Orditura M, De Vita F, Catalano G, et al. Elevated serum levels of interleukin-8 in advanced non-small cell lung cancer patients: relationship with prognosis. J Interferon Cytokine Res. 2002;22:1129–35. doi: 10.1089/10799900260442557. [DOI] [PubMed] [Google Scholar]
- Seike M, Yanaihara N, Bowman ED, et al. Use of a cytokine gene expression signature in lung adenocarcinoma and the surrounding tissue as a prognostic classifier. J Natl Cancer Inst. 2007;99:1257–69. doi: 10.1093/jnci/djm083. [DOI] [PubMed] [Google Scholar]
- Yanagawa H, Sone S, Takahashi Y, et al. Serum levels of interleukin 6 in patients with lung cancer. Br J Cancer. 1995;71:1095–8. doi: 10.1038/bjc.1995.212. [DOI] [PMC free article] [PubMed] [Google Scholar]
- Pine SR, Mechanic LE, Enewold L, et al. Increased levels of circulating interleukin 6, interleukin 8, C-reactive protein, and risk of lung cancer. J Natl Cancer Inst. 2011;103:1112–22. doi: 10.1093/jnci/djr216. [DOI] [PMC free article] [PubMed] [Google Scholar]
- Lin Y, Kikuchi S, Tamakoshi A, et al. Serum transforming growth factor-beta1 levels and pancreatic cancer risk: a nested case–control study (Japan) Cancer Causes Control. 2006;17:1077–82. doi: 10.1007/s10552-006-0048-0. [DOI] [PubMed] [Google Scholar]
- Yatsuya H, Toyoshima H, Tamakoshi K, et al. Serum levels of insulin-like growth factor I, II, and binding protein 3, transforming growth factor beta-1, soluble fas ligand and superoxide dismutase activity in stomach cancer cases and their controls in the JACC Study. J Epidemiol. 2005;15(Suppl 2):S120–5. doi: 10.2188/jea.15.S120. [DOI] [PMC free article] [PubMed] [Google Scholar]
- Purdue MP, Lan Q, Bagni R, et al. Prediagnostic serum levels of cytokines and other immune markers and risk of non-hodgkin lymphoma. Cancer Res. 2011;71:4898–907. doi: 10.1158/0008-5472.CAN-11-0165. [DOI] [PMC free article] [PubMed] [Google Scholar]
- Clendenen TV, Lundin E, Zeleniuch-Jacquotte A, et al. Circulating inflammation markers and risk of epithelial ovarian cancer. Cancer Epidemiol Biomarkers Prev. 2011;20:799–810. doi: 10.1158/1055-9965.EPI-10-1180. [DOI] [PMC free article] [PubMed] [Google Scholar]
- Pourshams A, Khademi H, Malekshah AF, et al. Cohort Profile: The Golestan Cohort Study–a prospective study of oesophageal cancer in northern Iran. Int J Epidemiol. 2010;39:52–9. doi: 10.1093/ije/dyp161. [DOI] [PMC free article] [PubMed] [Google Scholar]
- Abnet CC, Saadatian-Elahi M, Pourshams A, et al. Reliability and validity of opiate use self-report in a population at high risk for esophageal cancer in Golestan, Iran. Cancer Epidemiol Biomarkers Prev. 2004;13:1068–70. [PubMed] [Google Scholar]
- Nasrollahzadeh D, Kamangar F, Aghcheli K, et al. Opium, tobacco, and alcohol use in relation to oesophageal squamous cell carcinoma in a high-risk area of Iran. Br J Cancer. 2008;98:1857–63. doi: 10.1038/sj.bjc.6604369. [DOI] [PMC free article] [PubMed] [Google Scholar]
- Roberson R, Kuddo T, Horowitz K, Caballero M, Spong CY. Cytokine and chemokine alterations in Down syndrome. Am J Perinatol. 2012;29:705–8. doi: 10.1055/s-0032-1314892. [DOI] [PubMed] [Google Scholar]
- Shebl FM, Yu K, Landgren O, Goedert JJ, Rabkin CS. Increased levels of circulating cytokines with HIV-related immunosuppression. AIDS Res Hum Retroviruses. 2012;28:809–15. doi: 10.1089/aid.2011.0144. [DOI] [PMC free article] [PubMed] [Google Scholar]
- Allin KH, Bojesen SE, Nordestgaard BG. Baseline C-reactive protein is associated with incident cancer and survival in patients with cancer. J Clin Oncol. 2009;27:2217–24. doi: 10.1200/JCO.2008.19.8440. [DOI] [PubMed] [Google Scholar]
- Chaturvedi AK, Caporaso NE, Katki HA, et al. C-reactive protein and risk of lung cancer. J Clin Oncol. 2010;28:2719–26. doi: 10.1200/JCO.2009.27.0454. [DOI] [PMC free article] [PubMed] [Google Scholar]
- Heikkila K, Ebrahim S, Lawlor DA. A systematic review of the association between circulating concentrations of C reactive protein and cancer. J Epidemiol Community Health. 2007;61:824–33. doi: 10.1136/jech.2006.051292. [DOI] [PMC free article] [PubMed] [Google Scholar]
- Zhou B, Liu J, Wang ZM, Xi T. C-reactive protein, interleukin 6 and lung cancer risk: a meta-analysis. PLoS ONE. 2012;7:e43075. doi: 10.1371/journal.pone.0043075. [DOI] [PMC free article] [PubMed] [Google Scholar]
Associated Data
This section collects any data citations, data availability statements, or supplementary materials included in this article.
Supplementary Materials
Table S1. Intra-assay and inter-assay coefficients of variation for biomarkers for discrimination of esophageal, lung, and head and neck cases from controls in the Golestan Cohort Study.
Table S2. Proportion (%) of biomarkers for discrimination of esophageal, lung, and head and neck cases from controls in the Golestan Cohort Study, within detectable range.
Table S3. Receiver operating characteristic area (95% confidence interval) for biomarkers for discrimination of esophageal, lung, and head and neck cancer cases versus controls in the Golestan Cohort Study.
Table S4. Sensitivity and specificity of selected biomarkers for discrimination of esophageal, lung, and head and neck cases from controls in the Golestan Cohort Study. Values represent those that showed highest discrimination of cancer sites from controls.