

SUMMARY
Next-generation sequencing of human tumours has refined our understanding of the mutational processes operative in cancer initiation and progression, yet major questions remain regarding factors that induce driver mutations, and the processes that shape their selection during tumourigenesis. We performed whole-exome sequencing (WES) on adenomas from three mouse models of non-small cell lung cancer (NSCLC), induced by exposure to carcinogens (Methyl-nitrosourea (MNU) and Urethane), or by genetic activation of Kras (KrasLA2). Although the MNU-induced tumours carried exactly the same initiating mutation in Kras as seen in the KrasLA2 model (G12D), MNU tumours had an average of 192 non-synonymous, somatic single nucleotide variants (SNVs), compared to only 6 in tumours from the KrasLA2 model. In contrast, the KrasLA2 tumours exhibited a significantly higher level of aneuploidy and copy number alterations (CNAs) compared to the carcinogen-induced tumours, suggesting that carcinogen and genetically-engineered models adopt different routes to tumour development. The wild type (WT) allele of Kras has been shown to act as a tumour suppressor in mouse models of NSCLC. We demonstrate that urethane-induced tumours from WT mice carry mostly (94%) Q61R Kras mutations, while those from Kras heterozygous animals carry mostly (92%) Q61L mutations, indicating a major role of germline Kras status in mutation selection during initiation. The exome-wide mutation spectra in carcinogen-induced tumours overwhelmingly display signatures of the initiating carcinogen, while adenocarcinomas acquire additional C>T mutations at CpG sites. These data provide a basis for understanding the conclusions from human tumour genome sequencing that identified two broad categories based on relative frequency of SNVs and CNAs1, and underline the importance of carcinogen models for understanding the complex mutation spectra seen in human cancers.
Sequencing studies of human cancers have identified a number of mutation “signatures”, suggesting that tumours carry an imprint of the environmental agents to which patients were exposed2–4. There are presently no studies of genome-wide carcinogen signatures in any mouse cancer models, despite widespread use of these models in studies of cancer. To address the importance of engineered versus carcinogen-induced mutations, we investigated the mutations in mouse NSCLC arising as a result of spontaneous oncogenic activation of Kras (KrasLA2)5, or exposure to urethane or MNU6. Both carcinogens initiate lung tumourigenesis by oncogenic mutation of Kras, which is frequently mutated in human NSCLC7. WES was performed on 82 FVB/N lung adenomas, 44 induced by urethane, 26 by MNU, and 12 by the KrasLA2 allele (Extended Data Table 1). To study the tumour suppressive role of WT Kras, we included mice with one functionally null Kras allele, Kras+/LSL-G12D (see methods)8, hereafter referred to as Kras+/−. Importantly, these mice develop larger and more tumours than WT littermates following carcinogen treatment9,10.
Carcinogen-induced tumours had far more SNVs than KrasLA2 tumours (Fig. 1a), with an average of 728 and 185 in MNU- and urethane-induced tumours, respectively, and 47 in KrasLA2 tumours. This is similar to findings in humans where lung tumours from smokers contained orders of magnitude more SNVs than tumours from non-smokers11. We performed hierarchical clustering on the 96 possible SNVs, classified by trinucleotide context and substitution3, and tumours cluster perfectly by treatment (Fig. 1b), underscoring distinct mutational spectra. Highly consistent signatures are apparent across all tumours of each carcinogen group (Fig. 1c and Extended Data Fig. 1a-b), in agreement with the known A>T, A>G, and G>A substitutions induced by urethane12, and G>A transitions induced by MNU13. The elevated SNV burden and clear carcinogen imprint show that most SNVs were induced during the period of carcinogen activity following administration. In contrast, KrasLA2 tumours showed no notable signatures (Extended Data Fig. 1c).
Figure 1. Differences in mutation burden and spectra between carcinogen and genetic models.

a, Total SNVs per tumour. Light shades denote Kras+/− genotype. All comparisons of SNVs between treatment groups were significant (p ≤ 1.0x10⁻⁶, Wilcoxon rank-sum test, Holm’s correction). No significant differences were observed between WT and Kras+/− tumours. b, Unsupervised, hierarchical clustering of tumours by trinucleotide context substitutions. c, Stacked heatmaps of mutation spectra for five representative MNU-induced and urethane-induced tumours (see Extended Data Fig. 1 for all tumours). Substitutions are shown below each heatmap, with 5′ and 3′ flanking base displayed on top and right, respectively.
A highly significant 5′-flanking purine bias and 3′-flanking thymidine bias for G>A transitions was identified in the MNU-induced tumours (Extended Data Fig. 2a). Indeed, GGT>A is the most frequent SNV in this group. In urethane-induced tumours, a slight bias for 3′-cytidine in A>G transitions and 3′-guanosine in A>T transversions was seen (Extended Data Fig. 2b-c), while G>A transitions were also common (Extended Data Fig. 2d). The most frequent SNVs in KrasLA2 tumours were CGN>A (or the complement, NCG>T) (Extended Data Fig. 2e). Importantly, CGN>A is a signature of genomic instability in cancer and normal cells3,14,15.
In concordance with MNU’s propensity to induce GGT>A transitions, 25/26 MNU-induced lung tumours carried this transition in codon 12 of Kras, resulting in a G12D mutation, while all 44 urethane-induced tumours harbored Kras Q61 mutations (SI Table 1). Histological evaluation revealed the expected tumour types (Extended Data Fig. 3a), and solid tumours were significantly enriched in the MNU and KrasLA2 groups, which share the Kras G12D mutation (Extended Data Fig. 3b). It is possible that Kras G12D initiates a pathway to solid NSCLC that is distinct from that initiated by Q61 mutants. Alternatively, urethane may induce Kras mutations in a different population of tumour-initiating cells. Remarkably, urethane-induced tumours from WT mice had almost exclusively Kras Q61R mutations, while tumours from Kras+/− mice had almost exclusively Q61L mutations (Extended Data Fig. 4a-b). This switch is not likely due to differences in carcinogen metabolism or DNA repair, as neither the overall mutation spectra (Extended Data Fig. 1b) nor the exome-wide rates of the causative Q61R and Q61L substitutions (Extended Data Fig. 4c) differed between tumours of the two genotypes. This suggests that Kras Q61R and Q61L are functionally distinct, and selection of cells harboring these oncoproteins is modulated by WT Kras. Intriguingly, in the single instance of a Kras Q61L mutant tumour from a WT mouse, a Kras loss-of-function mutation (T35A)16,17 was also found, potentially inactivating the WT allele. Although KRAS Q61 mutations are relatively rare in human lung cancer, further investigation of the Q61 switch may yield valuable insights into RAS mutation selection, and the interplay of RAS oncogenes and their proto-oncogenes. While further studies are needed to identify the mechanism of this selection, we conclude that Kras mutations are not only carcinogen-dependent, but are influenced by germline differences that alter the expression of WT Kras.
We focused our search for additional driver mutations on genes known to harbor bona fide driver mutations in human cancers18,19 (see Methods). 65 consequential SNVs in 49 of these genes were validated (Extended Data Table 2), most involving amino acids conserved between mouse and human. SNVs in Akt1, Atm, Rnf43, Notch1, Ret, and Rb1, in particular, occurred at positions homologous to mutations in human cancers (SI Table 2). Two nonsense and two missense mutations were found in Mtus1, a candidate tumour suppressor gene in multiple cancers20–23. In concordance with its role as a tumour suppressor, knockdown of Mtus1 accelerated growth in a mouse lung cancer cell line driven by Kras G12D (Extended Data Fig. 5a-b). In addition, MTUS1 expression is significantly and positively associated with overall survival across all stages in human lung adenocarcinoma (TCGA LUAD RNA-seq, n = 354) (Extended Data Fig. 5c; SI Table 3). This association was validated in an independent human lung adenocarcinoma dataset24 (SI Table 3).
The observation that KrasLA2 tumours have on average 15-fold fewer SNVs than MNU-induced tumours (Fig. 1b), despite sharing similar histology and the same Kras mutation, suggested there are additional factors influencing tumourigenesis in these samples. Indeed, we found that CNAs are widespread in KrasLA2 tumours (average = 3.25) but infrequent in carcinogen-induced tumours (average = 0.07), and hierarchical clustering by copy-number profile clearly segregated the carcinogen-induced and KrasLA2 tumours into different groups (Fig. 2). Most KrasLA2 tumours (9/12) showed amplification of Kras, mainly via gain of one copy of chromosome 6. These tumours also carried common gains on chromosomes 2, 10, 12, 15, and 17, and deletions on chromosomes 4, 9, 11, and 17 (Extended Data Fig. 6), consistent with previously published aCGH results from the KrasLA2 model25. In contrast, carcinogen-induced tumours had very few CNAs and aneuploidies.
Figure 2. Distinct copy number profiles of genetically- and chemically-induced tumours.

Unsupervised, hierarchical clustering of log2 transformed read count ratios. KrasLA2 tumours showed a significantly higher number of CNAs compared to carcinogen-induced tumours (p = 4.3−10, Wilcoxon rank-sum test). Chromosomes are aligned head to tail on the X axis, starting at the left. Samples are labeled by treatment and genotype, with Kras+/− samples appearing as light blue and light red. Sample SNV burden is displayed along the Y axis in greyscale.
A summary of SNVs and CNAs involving driver genes reveals that all SNVs occurred in carcinogen-induced tumours and overwhelmingly showed the signature of the initiating carcinogen (Fig. 3). This suggests that carcinogen models produce tumours with a diversity of potential secondary driver SNVs, recapitulating in part the mutational heterogeneity seen in human cancer. One MNU-induced tumour harbored an E40K mutation in Akt1, generating a constitutively active oncoprotein26, and an early nonsense mutation in the tumour suppressor gene Pax5. Together with Kras G12D, this tumour had three functional mutations in cancer drivers, all MNU signature mutations likely induced in the same cell following MNU treatment. Although the KrasLA2 tumours had no SNVs in established driver genes, some exhibited CNAs involving driver genes mutated in the carcinogen-induced tumours (Fig. 3). Further evidence for the role of CNAs in genetically-engineered mouse models of cancer is provided by a recent report showing that mouse small-cell lung cancers induced by inactivation of Trp53 and Rb1 exhibit many CNAs, but a paucity of SNVs27. Similarly, mouse lung tumours induced by Cre-activation of KrasLSL-G12D exhibit extremely few exome-wide SNVs (personal communication, Tyler Jacks). We conclude that carcinogen and genetic models show fundamental differences in patterns of genomic alterations, and that the requirement for CNAs may be abrogated by the high frequency of carcinogen-induced SNVs—a reciprocal relationship also seen in a recent analysis of TCGA sequencing of several thousand human tumours1.
Figure 3. Consequential SNVs in high-likelihood driver genes only occur in carcinogen-induced tumours.

All missense and nonsense SNVs, amplifications, and deletions in genes listed in Extended Data Table 2 are displayed. KrasLA2, urethane-, and MNU-induced tumours are denoted above in green, blue, and red, respectively, with lighter shading denoting Kras+/− genotype. SNVs with unequivocal evidence of consequence are bordered in black. All SNVs, excepting those marked with an asterisk, are concordant with the signature mutations of the inducing carcinogen. The bottom panel shows total SNVs per tumour (NS = nonsynonymous, S = synonymous).
To understand the processes operative in progression to adenocarcinoma, we performed WES on 9 FVB/N and 13 A/J strain urethane-induced, histologically-confirmed lung adenocarcinomas (Extended Data Fig. 7a-b). The observed urethane-signature A>G and A>T substitutions recapitulate the rates and patterns seen in the adenomas with remarkable fidelity (Extended Data Fig. 8), validating the utility of mouse carcinogen models to resolve complex mutational spectra. Further analysis revealed a significant increase of the CGN>A signature of genomic instability in both FVB/N and A/J adenocarcinomas (Fig. 4). This elevation cannot be attributed solely to tumour age, as the FVB/N adenocarcinomas and adenomas were harvested following the same 20-week protocol.
Figure 4. Adenocarcinomas show enrichment for a signature of genomic instability.
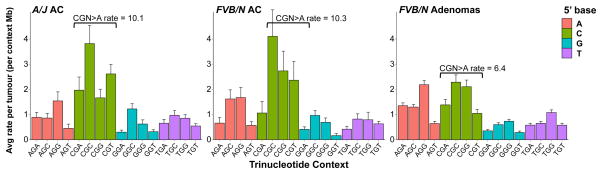
Breakdown of G>A transitions in A/J and FVB/N adenocarcinomas reveals significant increases in CGN>A (NCG>T) transition rates over FVB/N adenomas (p = 0.00047 and 0.0143, respectively, Wilcoxon rank-sum), despite similar rates and patterns of other G>A transitions. Mutation counts per tumour were normalized to total length of sequenced trinucleotide contexts in each tumour and averaged. Error bars represent SEM.
Most adenocarcinomas harbored Q61R mutations in Kras (SI Table 4). Although urethane is known to induce Kras Q61L lung adenomas in A/J mice, adenocarcinomas from these animals harbor predominantly Kras Q61R mutations28. Eleven additional SNVs in driver genes were identified, as well as 3 SNVs in the reported mouse lung adenoma suppressor gene Fat429 (SI Table 5). Compared to the urethane-induced adenomas, the adenocarcinomas are enriched for tumours with SNVs in high-likelihood driver genes other than Kras (Fisher p = 0.046), as well as tumours harboring CGN>A transitions in these genes (Fisher p = 0.034). These data suggest that CGN>A transitions may play a role in progression of adenomas to adenocarcinomas.
A comparison of all validated carcinogen-induced mouse mutations with WES of human lung adenocarcinoma (TCGA LUAD, n = 230) revealed substantial overlap in driver genes harboring consequential mutations, both overall and in KRAS-mutant tumours (SI Table 6). Some of the most frequently mutated genes in the mouse tumours (Arid1b, Atm, Crebbp, Mll2, Rb1) were also frequently mutated in the human tumours. Many of the mouse mutations occurred near mutations identified in TCGA LUAD, including functional mutations in Akt1, Atm, and Cbl (SI Table 7). In addition, the driver genes ALK, APC, JAK2, MET, and NF1, commonly mutated in human NSCLC11, were mutated in the mouse tumours. Finally, an analysis of MTUS1 mutations in TCGA LUAD revealed only consequential mutations (1.7%)—two missense mutations, and two frameshift deletions—suggesting that loss-of-function mutations in MTUS1 may be selected for in a subset of lung adenocarcinomas.
Genomic analysis of mouse tumours induced by a range of carcinogens may help reveal the relationships between environmental exposures and tumour architecture. Models that encompass heterogeneity in both genetic background and carcinogen exposure may also be useful for preclinical testing of cancer therapeutics, as the diversity of germline and somatic SNVs may recapitulate variation in drug response and resistance observed in human clinical trials. Importantly, carcinogen models enable production of tumours with a range of initiating Ras lesions, providing a valuable resource for interrogating the specificity and idiosyncrasies of these different mutations.
METHODS
Mouse strains and tumour induction
KrasLA2 and KrasLSL-G12D alleles, originally on a C57BL6/129/SvJae background, were backcrossed onto the FVB/N genetic background for more than 20 generations. Mice were treated with urethane (1 g/kg) or MNU (50 mg/kg) dissolved in PBS by intraperitoneal injection at ~7–12 weeks of age. Lung tumours from mice induced with carcinogen were harvested at ~20 weeks after injection, or ~32 weeks in the A/J animals, while spontaneous lung tumours were collected from KrasLA2 mice at ~9 months of age. For the urethane-induced adenomas, 18 tumours from 7 WT animals and 26 tumours from 9 KrasLSL-G12D animals were collected. For the MNU treatment group, 5 tumours from 4 WT animals and 21 tumours from 3 KrasLSL-G12D animals were collected. A total of 12 tumours were collected from 4 KrasLA2 animals. 8 histologically confirmed adenocarcinomas were collected from 4 FVB/N KrasLSL-G12D animals, and 1 from a WT FVB/N animal. 13 tumours, including 10 histologically confirmed adenocarcinomas, were collected from 7 WT A/J animals. KrasLSL-G12D is a latent G12D allele that is inactive in the absence of Cre-recombinase. Importantly, lungs from KrasLSL-G12D heterozygous mice were shown to have an approximately 2-fold reduction of Kras mRNA transcript and protein compared to WT littermates30. Furthermore, these mice had more and larger lung tumours than WT mice following carcinogen treatment30, similar to results seen for animals heterozygous for the original Kras null allele31.
No animals or tumours were excluded from the analysis. Tumours were collected from male and female mice, and no sex differences were observed. No formal randomization was performed, and all analyses were performed against the entire set of data in an unbiased manner. All animal experiments were approved by the University of California San Francisco Laboratory Animal Resource Center.
DNA Isolation and sequencing
Formalin-fixed or flash-frozen tumours free of visible normal tissue were digested overnight in proteinase K (Bioline) and phenol/chloroform purified using 5 PRIME Phase Lock Gel Heavy Tubes (Fisher Scientific). Integrity of genomic DNA was assessed by electrophoresis on 1% agarose gels, and concentration was determined by nanodrop spectrophotometry and PicoGreen (Invitrogen). Exome enrichment and sequencing genomic libraries were prepared using the Illumina Paired End Sample Prep Kit following manufacturer instructions. Enrichment was performed as described previously32 using the Agilent SureSelect Mouse All Exon kit following the manufacturer’s recommended protocol. Each exome was sequenced using a 76bp paired-end protocol on the Illumina platform (GAII or HiSeq2000).
Sequence alignment, processing and quality control
Tumour.bam files were aligned to the GRCm38/mm10 version of the Mus musculus genome using BWA (version 0.5.9)33. After alignment, duplicates were marked and mate information was fixed using Picard (version 1.80; http://picard.sourceforge.net/). We then recalibrated base quality score and realigned reads around indels using GATK (version 2.2–15)34. Finally, alignment and coverage metrics were collected using Picard. We sequenced an average of 75 million unique on-target reads per tumour. Targeted bases were sequenced to a mean depth of 72, and greater than 88% of targeted bases were sequenced to 20X coverage or greater. There were no significant differences in depth of coverage or proportion of regions covered to 20X between tumour induction groups.
Identification of SNVs and annotation
SNVs were identified using the somatic variant detection program, MuTect (version 1.1.4)35. Tumours were called against DNA taken from normal tail isolated from two WT FVB/N control samples. GRCm38/mm10 served as the reference during calling. Each set of variants was then subset to those variants that passed MuTect filters and had a minimum read depth of 12. The intersection of both callsets was then filtered for known variants from the database of mouse variation available at ftp-mouse.sanger.ac.uk (release 1303, mgp.v3). Variants found only in Mus spretus, Mus castaneus, or Mus musculus musculus were not used for filtration. All samples were also filtered for variants observed in a panel of six controls. These comprised the two WT samples used for variant calling, two KrasLA2 mice, and two KrasLSL-G12D heterozygous mice. These mice were then called for variants using FreeBayes (version 0.9.8; http://arxivorg/abs/1207.3907), UnifiedGenotyper (version 2.2–15)34 and mpileup (version 0.1.18)36. Variants from each caller were then filtered for sites with a minimum quality of 50 and minimum depth of 10. Variants called by a minimum of two callers were used to filter variants. Surviving variants were annotated using Annovar (downloaded on 5/9/2013)37. A final level of filtration was performed on variants that showed clear clustering by mouse, which were called SNPs and discarded. In KrasLSL-G12D mice, MNU-induced G12D mutation of the WT allele was clearly distinguished from latent G12D on the KrasLSL-G12D allele by observation of a nearby SNP, unique to the KrasLSL-G12D allele, in the exome-sequencing reads as well as Sanger sequencing.
Mutation spectra analysis
SNVs in all tumours were annotated by the 96 possible trinucleotide context substitutions (6 types of substitutions x 4 possible flanking 5′-bases x 4 possible flanking 3′-bases) and summed in each tumour, creating a matrix of 82 tumours x 96 substitutions. For hierarchical clustering, these counts were converted to per tumour proportions and clustered by Euclidean distance and similarity computed by nearest neighbor in R. For heatmaps in Fig. 1c and Extended Data Fig. 1, substitution counts were log10 normalized, column scaled and centered on 0. Mutation spectra barplots were created by dividing each totaled type of substitution in each tumour by the total number of successfully sequenced contexts (defined as ≥ 10X coverage) in that tumour corresponding to each substitution, retrieved from mpileup of the .bams in samtools. The resulting per-tumour substitution rates were then averaged across all tumours in the respective treatment groups.
Prioritization of high-likelihood driver genes
We explored a recently published gene prioritization approach that specifically addresses the phenomenon of spurious enrichment of longer genes by adjusting for gene expression and replication timing4. However, given the scarcity of recurrent variants in our dataset limiting the utility of this approach, we decided to prioritize variants that occurred in genes described by Vogelstein et al. (2013) as known to harbor bona fide driver mutations in cancer19, as well as the recently identified lung cancer driver genes Fgfr4, Map3k9, and Pak518. In particular, Vogelstein et al. described a stringent list of 125 driver genes harboring subtle mutations based on the criteria that >20% recorded mutations in oncogenes must be recurrent and missense, and >20% recorded mutations in tumour suppressors must be inactivating. Mtus1 was chosen for further investigation due to recurrence of missense and nonsense mutations. Variants were compared to known human somatic mutations as available via the COSMIC database38. Briefly, the mouse and human sequences for homologous proteins were pairwise aligned using Clustal Omega39 and the human protein position homologous to the mouse mutation was used to query COSMIC for known missense and nonsense mutations at or surrounding this peptide position. Local conservation was determined after sequence alignment using a +/− 10 amino acid residue window surrounding the substituted amino acid.
Validation of SNVs
SNVs were validated by either Sequenom MassARRAY or conventional Sanger sequencing. SNVs were called validated if they were detected in the tumour but not matched normal DNA. A subset of SNVs which failed both methods for technical reasons was called validated if individual inspection of the aligned reads in tumours and controls strongly supported validity, as performed in previous studies40. Method of validation for SNVs in driver genes is noted in Extended Data Table 2 and SI Table 5. Altogether, validation was attempted on 401 SNVs from the adenomas. A total of 11 failed for technical reasons, and 13 were inconclusive. A total of 17 variants were validated by visual inspection, representing 4.2% of the 401 variants tested. SNVs tested by Sequenom were called inconclusive if the SNV was observed in the tumour but failed in the control, or the SNV was observed in the tumour and not the matched normal control, but was observed in control tissue from another mouse. SNVs tested by visual inspection were called inconclusive if inspection suggested somatic origin, but total variant reads were less than 10. The overall validation rate (excluding inconclusive SNVs) was 87%. The Sequenom validation rate alone was 86%. The vast majority of Kras mutations were validated by Sanger sequencing, although a small subset went undetected by this method (SI Table 1) despite confirmation by manual inspection of the alignments, suggesting a higher sensitivity afforded by WES. These patterns confirm previous results on carcinogen-specific mutations in Kras6,9,10. Sanger sequencing validation was attempted on 20 randomly selected CGN>A transitions as well as 3 CGN>A transitions in driver genes in the adenocarcinoma samples, 15 of which passed (SI Table 8). Alignments were visually inspected for the remaining 8, all of which supported somatic origin, but only one of which had enough variant reads (>= 10) to pass. Interestingly, the inconclusive variants and the majority of the validated variants had very low variant read fractions, supporting a hypothesis that the CGN>A mutations were acquired during progression and are represented in subclonal tumour fractions.
Assessment of copy number from read depth
Copy number was estimated from sequencing data using FREEC (version v6.4; http://bioinfo-out.curie.fr/projects/freec/). Read depth was compared between tumour and control samples to estimate copy number in 8 kb windows, and subsequently segmented via a LASSO based algorithm41. FREEC was run with the following parameters: window size, 8 kb; step size, 2.5 kb; contaminationAdjustment = TRUE; noisyData = TRUE; BAF calculation activated. 2.5 kb windows were then aggregated into 15 kb bins by taking the median ratio for all covered windows. Each tumour was profiled against the two WT controls used for variant calling. Aggregate profiles were generated for each tumour by the following rules: if either ratio was approximately neutral, the region was considered neutral; if both ratios were aberrant with the same directionality, the more conservative ratio was used; if both ratios were aberrant with different directionality, the region was discarded. Resulting merged ratios were then inspected for high missing rates and low variance, which were then omitted. Additionally, several small regions with evidence of technical artifacts resulting in extremely consistent aberration rates (greater than 50% of samples) across all treatment groups were manually excluded. Particularly, these regions were manually inspected for the existence of large gene families that could account for misalignments and result in spurious aneuploidies. Short spans on chromosomes 1, 4, 6, and 12 were discarded as artifacts.
Histological classification
A small piece of each tumour was collected and paraffin embedded for pathology, sectioned to 6 μm and H&E stained. Histological architecture was classified as either papillary, solid, or mixed papillary and solid. Solid was defined as histology with marked lack of papillary structure, yet more structure than traditionally solid lung adenocarcinomas in humans. Adenocarcinomas were called based on large size and the presence of the following cytological criteria: tumour cell crowding, scattered mitotic figures, nuclear atypia (enlargement and moderate pleomorphism), nuclear membrane irregularity, and prominent nucleoli. All histology was called by a lung pathologist blinded to the study groups and conditions.
Cell culture, Mtus1 knockdown, and MTT assay
The mouse lung cancer cell line K493.1, which harbors a Kras G12D mutation, was grown in DMEM supplemented with 10% fetal bovine serum (Atlas Biologicals). Mtus1 was knocked down using 50 nM ON-TARGETplus SMARTpool siRNA (Dharmacon) containing multiple pooled siRNAs targeting all isoform transcripts of mouse Mtus1 (Cat: L-065229-01). Transfection of siRNA was performed at ~20–40% cell confluence using Lipofectamine-2000 (Invitrogen). In parallel, cells were transfected with control ON-TARGETplus Non-Targeting Pool siRNA (Cat: D-001810-10). RNA was harvested from cells at day 3 after transfection using Trizol reagent (Invitrogen), DNA was removed using the TURBO DNA-free kit (Ambion), and cDNA was synthesized from 500 ng RNA using the Superscript III First-strand Synthesis kit (Invitrogen). qRT-PCR was performed on cDNA using TaqMan Assays-on-Demand (Applied Biosystems) against mouse Mtus1 (Mm00628662_m1 Mtus1) and b-actin on the 7900HT Fast Real-Time PCR System (Applied Biosystems). Reactions were performed in quadruplicate, and levels of Mtus1 were normalized to b-actin. Cell proliferation was assayed in 96-well plates (six replicate wells per group) at days 1, 2, and 3 after siRNA transfection using MTT (Invitrogen). Formazan crystals were re-suspended in DMSO, and absorbance was read at 540 nm. Four independent experiments were performed, and a significant increase in absorbance (Wilcoxon rank-sum test) was always seen in the Mtus1 knockdown compared to control siRNA cells at day 3. One representative experiment is shown in Extended Data Fig. 5b. All protocols were performed following manufacturer’s instructions.
Survival analyses in human lung cancer datasets
The TCGA LUAD (human lung adenocarcinoma) and LUSC (human lung squamous cell carcinoma) datasets were downloaded from the UCSC Cancer Genomics Browser (https://genome-cancer.ucsc.edu). Illumina HiSeq 2000 RNA Sequencing expression data was used for analyses of gene expression with overall survival. A validation dataset for MTUS1 expression in lung adenocarcinoma24 was downloaded from https://caintegrator.nci.nih.gov/caintegrator/. Analysis of MTUS1 expression and survival was also repeated in a second squamous cell carcinoma (SCC) dataset42, which was downloaded from the UCSC Cancer Genomics Browser. No association between MTUS1 expression and survival was seen in the SCC datasets (SI Table 3), suggesting that MTUS1 expression may only have prognostic significance in certain types of lung cancer such as NSCLC. For all survival analyses, clinical covariates of sex, age, cigarette pack years smoked, and stage were included, except in the Shedden, et al. dataset24 where cigarette pack years smoked was not available. Cox regression was performed in R with gene expression as a continuous variable. High and low expression groups were split about median expression values for plotting Kaplan-Meier curves.
Human versus mouse mutation comparison
Genes included in this comparison were limited to known driver genes (see Prioritization of high-likelihood driver genes) harboring mutations in the carcinogen-induced mouse tumours. The TCGA LUAD WES.vcf was downloaded from the UCSC Cancer Genomics Browser (https://genome-cancer.ucsc.edu). Only functional SNVs and indels were included. Validated functional SNVs from carcinogen-induced mouse adenomas and adenocarcinomas, and CNAs from the carcinogen-induced adenomas, were used in the comparison. Inclusion of mouse CNAs (6 total) made little difference overall, but were included to emphasize recurrent mutation of Rb1 in the mouse tumours, which had four deletions and two missense SNVs.
Generation of plots
All plots were created using the statistical computing language R (R Core Team (2013). R: A language and environment for statistical computing. R Foundation for Statistical Computing, Vienna, Austria. http://www.R-project.org/). Heatmaps were generated using the heatmap.2 function in the gplots package (Gregory R. Warnes, et al. (2014). gplots: Various R programming tools for plotting data. http://CRAN.R-project.org/package=gplots), Kaplan-Meier curves were generated using the survival package (Therneau T (2013). A Package for Survival Analysis in S. http://CRAN.R-project.org/package=survival), and all other plots were made using the ggplot2 package (H. Wickham (2009). ggplot2: elegant graphics for data analysis. Springer, New York).
Statistical analyses
The nonparametric Wilcoxon rank-sum test (Mann-Whitney U test) was used in Figures 1, 2, 4, and Extended Data Figures 2, 4, and 5 for testing the alternative hypothesis that two populations of values differ against the null hypothesis that they are the same. This test was chosen due to efficiency in handling both normal and non-normal distributions. The Fisher Exact test was used in the text and in Extended Data Figures 3 and 4 to compare count data between groups, and was chosen for its robust ability to handle high and low ranges of count data. Where appropriate, p-values were adjusted for multiple tests using the Holm’s correction for multiple comparisons. Survival analysis in Extended Data Figure 5 is explained in the section “Survival analyses in human lung cancer datasets”. All data were visualized in R using summary statistics and basic plotting functions prior to statistical testing, and variance was comparable in all cases where the Wilcoxon rank-sum test was used. All assumptions of statistical tests were met.
Data deposition
The raw.bam files are available at ENA (accession ERP001454). A sample ID key with study names and ENA names is provided in supplementary information (ExomeLungTumorIDs_Key.txt). Variant call format files of SNVs used in analyses in the paper are provided in supplementary information (Adenomas_variants.txt, Adenocarcinomas_variants.txt).
Extended Data
Extended Data Figure 1. Distinct and consistent mutation spectra across tumours from carcinogen and genetic models.

a–c, Stacked heatmaps displaying the mutation spectra of all MNU-induced, a, urethane-induced, b, and KrasLA2, c, tumours, shown as normalized frequencies of all 96 possible substitutions. Substitutions are shown below each heatmap, with 5′- and 3′-flanking base context displayed on the top and right, respectively. Tumour ID is shown to the left of each heatmap.
Extended Data Figure 2. Highly specific mutation signatures.

a, Breakdown of G>A transitions in MNU-induced tumours. 5′-flanking purine versus pyrimidine G>A substitutions, and 3′-flanking thymidine versus all other G>A substitutions, are highly significant (p < 0.0003, Wilcoxon rank-sum test). b–c, Breakdowns of A>G transitions, b, and A>T transversions, c, in urethane-induced tumours. d–e, All 96 substitutions in urethane-induced, d, and KrasLA2 tumours, e. In e, the CGN>A (NCG>T) signature mutations of genomic instability are denoted. Mutation counts per tumour were normalized to total length of sequenced trinucleotide contexts in each tumour and averaged. Error bars represent SEM.
Extended Data Figure 3. Kras G12D induces tumours with different histologies than codon 61 mutants.

a, Representative papillary, solid, and mixed tumour histologies (200x magnification). b, Breakdown of different histologies in each treatment group. Histologies from KrasLA2 and MNU groups were significantly different than those from urethane, but there was no significant difference between KrasLA2 and MNU (Fisher Exact test, Holm’s correction for multiple comparisons).
Extended Data Figure 4. Germline Kras genotype influences mutation specificity in urethane-induced tumours.

a, Kras mutant alleles for urethane tumours are plotted as colored squares for all three oncogenic alleles detected in these tumours. Kras genotype is indicated as either white (WT) or black (heterozygous) squares. b, Highly significant switch in Kras codon 61 mutations between tumours from WT mice and Kras+/− mice (Fisher Exact test). c, No significant difference was seen between the exome-wide rates of causative Kras Q61R (CAA>G) and Q61L (CAA>T) mutations between tumours from WT and Kras+/− mice (Wilcoxon rank-sum test).
Extended Data Figure 5. MTUS1 is a tumour suppressor in mouse and human lung cancer.

a, qRT-PCR quantification of siRNA knockdown of Mtus1 in a Kras G12D mouse lung cancer cell line (K493.1) (Wilcoxon rank-sum test). b, MTT assay shows increased growth following Mtus1 knockdown (Wilcoxon rank-sum test). Four independent trials were performed and growth was significantly increased by day 3 after knockdown in each experiment. One representative trial is shown. c, MTUS1 expression is significantly associated with overall survival in human lung adenocarcinoma, p=0.00097, χ2=10.9. Analysis was performed using clinical covariates gender, age, pack years smoked, and stage.
Extended Data Figure 6. Proportion of tumours with CNAs in each treatment group.

Amplifications and deletions were defined as regions with a log2 ratio greater than 0.5 or less than −0.5, respectively. Chromosomes are arranged on the X axis in a head-to-tail formation.
Extended Data Figure 7. Histological confirmation of lung adenocarcinomas.

a–b, Representative histologies (400x magnification) of A/J, a, and FVB/N, b, adenocarcinomas. Zoom insets show tumour cell crowding and scattered mitotic figures (black arrowheads), nuclear atypia including enlargement and moderate pleomorphism, nuclear membrane irregularity, and prominent nucleoli. Scale bar = 20 μm.
Extended Data Figure 8. Comparison of urethane-signature mutations in adenomas and adenocarcinomas.

Urethane A>G transitions (left) and A>T transversions (right) are shown in A/J adenocarcinomas, FVB/N adenocarcinomas, and FVB/N adenomas. Mutation counts per tumour were normalized to total length of sequenced trinucleotide contexts in each tumour and averaged. Error bars represent SEM.
Extended Data Table 1.
Treatment groups and lung tumours for WES.
| Treatment | Kras Genotype | Tumours (n) | Kras mutations |
|---|---|---|---|
| Urethane | WT | 18 | Q61R/L/H |
| Het | 26 | Q61R/L/H | |
| MNU | WT | 5 | G12D |
| Het | 21 | G12D | |
| None | LA2 | 12 | G12D |
Extended Data Table 2.
Mouse lung adenoma SNVs in established cancer driver genes and Mtus1.
| Chr | Position | Gene | Exon | Substitution | Consequence | Observed | Tumours | Validated | Validation Method* |
|---|---|---|---|---|---|---|---|---|---|
| 12 | 112662237 | Akt1 | 3 | GGA>A | E40K | 1 | 1024T10 | Yes | Both |
| 17 | 72603313 | Alk | 1 | GGG>A | G133R | 1 | 1024T8 | Yes | Sequenom |
| 18 | 34316299 | Apc | 16 | TGT>A | Q2083X | 1 | 1024T8 | Yes | Inspection |
| 4 | 133720797 | Arid1a | 3 | GGA>A | S520F | 1 | 1024T6 | Yes | Sanger |
| 4 | 133686649 | Arid1a | 15 | GAC>G | D1287G | 1 | 33T4 | Yes | Sanger |
| 17 | 5097671 | Arid1b | 3 | GGG>A | P564L | 1 | 1045T4 | Yes | Sequenom |
| 17 | 5337117 | Arid1b | 18 | AGA>A | S1563F | 1 | 1024T3 | Yes | Sequenom |
| 17 | 5337249 | Arid1b | 18 | GGA>A | S1607F | 1 | 1024T7 | Yes | Sequenom |
| 2 | 153393885 | Asxl1 | 9 | GGG>A | G296R | 1 | 1024T2 | Yes | Sequenom |
| 2 | 153397578 | Asxl1 | 11 | GGC>A | P430S | 1 | 1024T4 | Yes | Sequenom |
| 9 | 53460891 | Atm | 46 | AGG>A | R2200K | 1 | 75T3 | Yes | Sequenom |
| 9 | 53511883 | Atm | 13 | AGA>A | E648K | 1 | 1024T8 | Yes | Sequenom |
| 9 | 53518635 | Atm | 9 | AGA>A | S367F | 1 | 1024T4 | Yes | Both |
| X | 105875634 | Atrx | 9 | GGG>A | G867R | 1 | 1024T3 | Yes | Sequenom |
| 17 | 26190206 | Axin1 | 8 | AGC>A | A727T | 1 | 1039T3 | Yes | Inspection |
| 11 | 101549022 | Brca1 | 2 | GGA>A | P25S | 1 | 1024T7 | Yes | Sequenom |
| 5 | 150558455 | Brca2 | 21 | GGA>A | D2821N | 1 | 1045T1 | Yes | Sequenom |
| 5 | 140882326 | Card11 | 19 | GGA>C | E856Q | 1 | 1045T2 | Yes | Inspection |
| 9 | 44164145 | Cbl | 8 | GGA>A | S401F | 1 | 1024T9 | Yes | Sanger |
| 7 | 25286003 | Cic | 6 | AGG>A | G291R | 1 | 1012T3 | Yes | Inspection |
| 7 | 25287831 | Cic | 9 | GGG>A | G481E | 1 | 1024T5 | Yes | Inspection |
| 16 | 4085706 | Crebbp | 31 | GGT>A | P1890S | 1 | 1024T7 | Yes | Sequenom |
| 16 | 4094715 | Crebbp | 24 | GGG>A | P1353S | 1 | 1024T3 | Yes | Sequenom |
| 16 | 4117340 | Crebbp | 14 | GGT>A | T933I | 1 | 1024T1 | Yes | Sequenom |
| 17 | 33913569 | Daxx | 6 | AGA>A | D596N | 1 | 1024T2 | Yes | Inspection |
| 12 | 3899919 | Dnmt3a | 10 | AGC>A | A352T | 1 | 1045T4 | Yes | Sequenom |
| 15 | 81628398 | Ep300 | 15 | GGA>A | E974K | 1 | 1024T5 | Yes | Inspection |
| X | 95428261 | Fam123b | 2 | AGT>A | V84I | 1 | 1024T4 | Yes | Inspection |
| 7 | 130196315 | Fgfr2 | 9 | CAG>G | C401R | 1 | 1012T3 | Yes | Inspection |
| 5 | 33733951 | Fgfr3 | 12 | GGC>A | A539T | 1 | 1024T1 | Yes | Sequenom |
| 5 | 33733706 | Fgfr3 | 11 | GGT>A | V482I | 1 | 1024T5 | Yes | Sanger |
| 13 | 55160082 | Fgfr4 | 7 | GGC>A | A293V | 1 | 1045T7 | Yes | Inspection |
| 5 | 147344556 | Flt3 | 19 | TGA>A | E789K | 1 | 1045T4 | Yes | Sequenom |
| 6 | 88204692 | Gata2 | 5 | TAC>G | Y376C | 1 | 1024T3 | Yes | Sequenom |
| 2 | 9874578 | Gata3 | 3 | GGA>A | E196K | 1 | 1045T4 | Yes | Sequenom |
| 5 | 114952618 | Hnf1a | 7 | GGG>A | P487S | 1 | 1045T5 | Yes | Sequenom |
| 1 | 65161862 | Idh1 | 7 | GGC>A | G310D | 1 | 1012T3 | Yes | Inspection |
| 19 | 29302040 | Jak2 | 21 | AGT>A | V1010I | 1 | 1024T10 | Yes | Sequenom |
| X | 152268847 | Kdm5c | 19 | CAG>T | Q902L | 1 | 33T4 | Yes | Sanger |
| X | 152271108 | Kdm5c | 23 | GAC>G | T1179A | 1 | 35T1 | Yes | Sanger |
| 5 | 75647780 | Kit | 15 | AGG>A | P728L | 1 | 1024T2 | Yes | Sequenom |
| 4 | 55530863 | Klf4 | 3 | CAG>G | S83G | 1 | 1800T2 | Yes | Sequenom |
| 13 | 111758076 | Map3k1 | 11 | AGA>A | D689N | 1 | 1026T1 | Yes | Inspection |
| 12 | 81780619 | Map3k9 | 1 | GGG>A | G86S | 1 | 1026T2 | Yes | Sanger |
| 12 | 81724480 | Map3k9 | 10 | GGT>A | T778I | 1 | 1026T1 | Yes | Sanger |
| 12 | 81772793 | Map3k9 | 2 | AGG>A | R229K | 1 | 75T1 | Yes | Sanger |
| X | 101294069 | Med12 | 41 | TAC>G | T1985A | 1 | 33T2 | Yes | Sequenom |
| 19 | 6336766 | Men1 | 3 | AGG>A | G169R | 1 | 1024T2 | Yes | Sequenom |
| 6 | 17562227 | Met | 19 | CAA>C | K1196Q | 1 | 1790T1 | Yes | Sequenom |
| 15 | 98852106 | Mll2 | 32 | GGG>A | P2569S | 1 | 1024T4 | Yes | Sequenom |
| 15 | 98859560 | Mll2 | 15 | GGC>A | A1352T | 1 | 1026T2 | Yes | Sequenom |
| 11 | 62343219 | Ncor1 | 30 | AGA>A | E1441K | 1 | 1026T2 | Yes | Sequenom |
| 11 | 79425592 | Nf1 | 13 | TGT>A | C491Y | 1 | 1024T3 | Yes | Sequenom |
| 3 | 98100211 | Notch2 | 8 | GGG>A | P426S | 1 | 1045T2 | Yes | Sequenom |
| 4 | 44691909 | Pax5 | 3 | GGG>A | W112* | 1 | 1024T10 | Yes | Both |
| 5 | 75181651 | Pdgfra | 15 | AAT>T | N711I | 1 | 309T1 | Yes | Sequenom |
| 5 | 75187929 | Pdgfra | 19 | TGA>A | D877N | 1 | 1045T1 | Yes | Sequenom |
| 17 | 20962623 | Ppp2r1a | 13 | GGG>A | P523L | 1 | 1024T7 | Yes | Sequenom |
| 13 | 63525046 | Ptch1 | 17 | AAC>G | N915S | 1 | 1T2 | Yes | Inspection |
| 14 | 73206017 | Rb1 | 22 | GGA>A | S766F | 1 | 1024T7 | Yes | Inspection |
| 14 | 73206083 | Rb1 | 22 | GGA>A | S744F | 1 | 1024T5 | Yes | Inspection |
| 6 | 118164756 | Ret | 17 | AGG>A | R970K | 1 | 1024T5 | Yes | Inspection |
| 11 | 87731186 | Rnf43 | 9 | AGA>A | R371K | 1 | 1024T8 | Yes | Inspection |
| 1 | 55012160 | Sf3b1 | 6 | GGT>A | T203I | 1 | 1045T4 | Yes | Sequenom |
| 10 | 19011651 | Tnfaip3 | 2 | GGT>A | T42I | 1 | 1026T2 | Yes | Sanger |
| 8 | 41083460 | Mtus1 | 2 | GGG>A | W406* | 2 | 1024T5, 1011T1 | Yes | Both |
| 8 | 41084181 | Mtus1 | 2 | CGT>A | T166M | 1 | 1024T7 | Yes | Both |
| 8 | 41015397 | Mtus1 | 7 | GGG>A | G902R | 1 | 1039T4 | Yes | Both |
Validation Method: Both = Sequenom MassArray and Sanger sequencing. Inspection = manual inspection of alignments
Supplementary Material
Acknowledgments
This work was supported by NCI grants R01 CA111834, U01 CA84244, U01 CA141455 and UO1 CA176287 (to A.B.), and partly funded by the Bonnie Addario Foundation. P.M.K.W was supported by the NIH training grant T32 GM007175 and an NSF GRFP award, and is currently supported by an NCI F31 NRSA award. K.D.H was supported by the NIH training grant T32 GM007175, and is currently supported by an NCI F31 NRSA award. D.J.A is supported by Cancer Research UK and the Wellcome Trust. We are greatly appreciative of the help and comments from our colleagues in refining this study and manuscript. We would also like to thank Shon Green, Dr. Tina Yuan, and Dr. Martin McMahon at UCSF Helen Diller Cancer Research Center for kindly providing the cell line K493.1.
Footnotes
AUTHOR CONTRIBUTIONS
P.M.K.W., K.D.H., M.D.T., D.J.A. and A.B contributed to the overall study design. P.M.K.W. carried out most of the experiments, with help from M.D.T. R.D. was responsible for all of the animal studies. Sequencing and Sequenom were performed at the Sanger Institute under the supervision of D.J.A., and data processing was carried out by K.D.H, M.R., A.G.R., and T.M.K. SNV and CNA calling were carried out by K.D.H. Data analysis was carried out primarily by P.M.K.W and K.D.H, with help from E.F. and D.A.Q. K-Y J. made histological assessments of all tumours. Adenomas and adenocarcinomas from the A/J mice were provided by C.J.K. and K.E.G. The manuscript was written primarily by P.M.K.W. and A.B., with contributions from the other authors.
COMPETING FINANCIAL INTERESTS
The authors declare no competing financial interests.
References
- 1.Ciriello G, et al. Emerging landscape of oncogenic signatures across human cancers. Nat Genet. 2013;45:1127–1133. doi: 10.1038/ng.2762. [DOI] [PMC free article] [PubMed] [Google Scholar]
- 2.Stratton MR, Campbell PJ, Futreal PA. The cancer genome. Nature. 2009;458:719–724. doi: 10.1038/nature07943. [DOI] [PMC free article] [PubMed] [Google Scholar]
- 3.Alexandrov LB, et al. Signatures of mutational processes in human cancer. Nature. 2013;500:415–421. doi: 10.1038/nature12477. [DOI] [PMC free article] [PubMed] [Google Scholar]
- 4.Lawrence MS, et al. Mutational heterogeneity in cancer and the search for new cancer-associated genes. Nature. 2013;499:214–218. doi: 10.1038/nature12213. [DOI] [PMC free article] [PubMed] [Google Scholar]
- 5.Johnson L, et al. Somatic activation of the K-ras oncogene causes early onset lung cancer in mice. Nature. 2001;410:1111–1116. doi: 10.1038/35074129. [DOI] [PubMed] [Google Scholar]
- 6.You M, Candrian U, Maronpot RR, Stoner GD, Anderson MW. Activation of the Ki-ras protooncogene in spontaneously occurring and chemically induced lung tumours of the strain A mouse. Proc Natl Acad Sci U S A. 1989;86:3070–3074. doi: 10.1073/pnas.86.9.3070. [DOI] [PMC free article] [PubMed] [Google Scholar]
- 7.Prior IA, Lewis PD, Mattos C. A comprehensive survey of Ras mutations in cancer. Cancer Res. 2012;72:2457–2467. doi: 10.1158/0008-5472.CAN-11-2612. [DOI] [PMC free article] [PubMed] [Google Scholar]
- 8.Jackson EL, et al. Analysis of lung tumour initiation and progression using conditional expression of oncogenic K-ras. Genes Dev. 2001;15:3243–3248. doi: 10.1101/gad.943001. [DOI] [PMC free article] [PubMed] [Google Scholar]
- 9.Zhang Z, et al. Wildtype Kras2 can inhibit lung carcinogenesis in mice. Nat Genet. 2001;29:25–33. doi: 10.1038/ng721. [DOI] [PubMed] [Google Scholar]
- 10.To MD, et al. Kras regulatory elements and exon 4A determine mutation specificity in lung cancer. Nat Genet. 2008;40:1240–1244. doi: 10.1038/ng.211. [DOI] [PMC free article] [PubMed] [Google Scholar]
- 11.Govindan R, et al. Genomic landscape of non-small cell lung cancer in smokers and never-smokers. Cell. 2012;150:1121–1134. doi: 10.1016/j.cell.2012.08.024. [DOI] [PMC free article] [PubMed] [Google Scholar]
- 12.Forkert PG. Mechanisms of lung tumourigenesis by ethyl carbamate and vinyl carbamate. Drug Metab Rev. 2010;42:355–378. doi: 10.3109/03602531003611915. [DOI] [PubMed] [Google Scholar]
- 13.Kurowska M, Labocha-Pawlowska A, Gnizda D, Maluszynski M, Szarejko I. Molecular analysis of point mutations in a barley genome exposed to MNU and gamma rays. Mutat Res. 2012:738–739. 52–70. doi: 10.1016/j.mrfmmm.2012.08.008. [DOI] [PubMed] [Google Scholar]
- 14.Pfeifer GP. Mutagenesis at methylated CpG sequences. Curr Top Microbiol Immunol. 2006;301:259–281. doi: 10.1007/3-540-31390-7_10. [DOI] [PubMed] [Google Scholar]
- 15.Welch JS, et al. The origin and evolution of mutations in acute myeloid leukemia. Cell. 2012;150:264–278. doi: 10.1016/j.cell.2012.06.023. [DOI] [PMC free article] [PubMed] [Google Scholar]
- 16.Drugan JK, et al. Ras interaction with two distinct binding domains in Raf-1 may be required for Ras transformation. J Biol Chem. 1996;271:233–237. doi: 10.1074/jbc.271.1.233. [DOI] [PubMed] [Google Scholar]
- 17.Spoerner M, Herrmann C, Vetter IR, Kalbitzer HR, Wittinghofer A. Dynamic properties of the Ras switch I region and its importance for binding to effectors. Proc Natl Acad Sci U S A. 2001;98:4944–4949. doi: 10.1073/pnas.081441398. [DOI] [PMC free article] [PubMed] [Google Scholar]
- 18.Fawdar S, et al. Targeted genetic dependency screen facilitates identification of actionable mutations in FGFR4, MAP3K9, and PAK5 in lung cancer. Proc Natl Acad Sci U S A. 2013;110:12426–12431. doi: 10.1073/pnas.1305207110. [DOI] [PMC free article] [PubMed] [Google Scholar]
- 19.Vogelstein B, et al. Cancer genome landscapes. Science (80- ) 2013;339:1546–1558. doi: 10.1126/science.1235122. [DOI] [PMC free article] [PubMed] [Google Scholar]
- 20.Di Benedetto M, et al. Mutation analysis of the 8p22 candidate tumour suppressor gene ATIP/MTUS1 in hepatocellular carcinoma. Mol Cell Endocrinol. 2006;252:207–215. doi: 10.1016/j.mce.2006.03.014. [DOI] [PubMed] [Google Scholar]
- 21.Frank B, et al. Copy number variant in the candidate tumour suppressor gene MTUS1 and familial breast cancer risk. Carcinogenesis. 2007;28:1442–1445. doi: 10.1093/carcin/bgm033. [DOI] [PubMed] [Google Scholar]
- 22.Zuern C, et al. Down-regulation of MTUS1 in human colon tumours. Oncol Rep. 2010;23:183–189. [PubMed] [Google Scholar]
- 23.Xiao J, et al. Reduced expression of MTUS1 mRNA is correlated with poor prognosis in bladder cancer. Oncol Lett. 2012;4:113–118. doi: 10.3892/ol.2012.673. [DOI] [PMC free article] [PubMed] [Google Scholar]
- 24.Shedden K, et al. Gene expression-based survival prediction in lung adenocarcinoma: a multi-site, blinded validation study. Nat Med. 2008;14:822–827. doi: 10.1038/nm.1790. [DOI] [PMC free article] [PubMed] [Google Scholar]
- 25.To MD, et al. Progressive genomic instability in the FVB/Kras(LA2) mouse model of lung cancer. Mol Cancer Res. 2011;9:1339–1345. doi: 10.1158/1541-7786.MCR-11-0219. [DOI] [PMC free article] [PubMed] [Google Scholar]
- 26.Ahmed NN, Grimes HL, Bellacosa A, Chan TO, Tsichlis PN. Transduction of interleukin-2 antiapoptotic and proliferative signals via Akt protein kinase. Proc Natl Acad Sci U S A. 1997;94:3627–3632. doi: 10.1073/pnas.94.8.3627. [DOI] [PMC free article] [PubMed] [Google Scholar]
- 27.McFadden DG, et al. Genetic and clonal dissection of murine small cell lung carcinoma progression by genome sequencing. Cell. 2014;156:1298–1311. doi: 10.1016/j.cell.2014.02.031. [DOI] [PMC free article] [PubMed] [Google Scholar]
- 28.Nuzum EO, Malkinson AM, Beer DG. Specific Ki-ras codon 61 mutations may determine the development of urethan-induced mouse lung adenomas or adenocarcinomas. Mol Carcinog. 1990;3:287–295. doi: 10.1002/mc.2940030509. [DOI] [PubMed] [Google Scholar]
- 29.Berndt A, et al. Identification of fat4 and tsc22d1 as novel candidate genes for spontaneous pulmonary adenomas. Cancer Res. 2011;71:5779–5791. doi: 10.1158/0008-5472.CAN-11-1418. [DOI] [PMC free article] [PubMed] [Google Scholar]
- 30.To MD, Rosario RD, Westcott PM, Banta KL, Balmain A. Interactions between wild-type and mutant Ras genes in lung and skin carcinogenesis. Oncogene. 2013;32:4028–4033. doi: 10.1038/onc.2012.404. [DOI] [PMC free article] [PubMed] [Google Scholar]
- 31.Johnson L, et al. K-ras is an essential gene in the mouse with partial functional overlap with N-ras. Genes Dev. 1997;11:2468–2481. doi: 10.1101/gad.11.19.2468. [DOI] [PMC free article] [PubMed] [Google Scholar]
- 32.Varela I, et al. Exome sequencing identifies frequent mutation of the SWI/SNF complex gene PBRM1 in renal carcinoma. Nature. 2011;469:539–42. doi: 10.1038/nature09639. [DOI] [PMC free article] [PubMed] [Google Scholar]
- 33.Li H, Durbin R. Fast and accurate short read alignment with Burrows-Wheeler transform. Bioinformatics. 2009;25:1754–60. doi: 10.1093/bioinformatics/btp324. [DOI] [PMC free article] [PubMed] [Google Scholar]
- 34.DePristo MA, et al. A framework for variation discovery and genotyping using next-generation DNA sequencing data. Nat Genet. 2011;43:491–8. doi: 10.1038/ng.806. [DOI] [PMC free article] [PubMed] [Google Scholar]
- 35.Cibulskis K, et al. Sensitive detection of somatic point mutations in impure and heterogeneous cancer samples. Nat Biotechnol. 2013;31:213–9. doi: 10.1038/nbt.2514. [DOI] [PMC free article] [PubMed] [Google Scholar]
- 36.Li H, et al. The Sequence Alignment/Map format and SAMtools. Bioinformatics. 2009;25:2078–9. doi: 10.1093/bioinformatics/btp352. [DOI] [PMC free article] [PubMed] [Google Scholar]
- 37.Wang K, Li M, Hakonarson H. ANNOVAR: functional annotation of genetic variants from high-throughput sequencing data. Nucleic Acids Res. 2010;38:e164. doi: 10.1093/nar/gkq603. [DOI] [PMC free article] [PubMed] [Google Scholar]
- 38.Forbes SA, et al. COSMIC: mining complete cancer genomes in the Catalogue of Somatic Mutations in Cancer. Nucleic Acids Res. 2011;39:D945–50. doi: 10.1093/nar/gkq929. [DOI] [PMC free article] [PubMed] [Google Scholar]
- 39.Sievers F, et al. Fast, scalable generation of high-quality protein multiple sequence alignments using Clustal Omega. Mol Syst Biol. 2011;7:539. doi: 10.1038/msb.2011.75. [DOI] [PMC free article] [PubMed] [Google Scholar]
- 40.Nik-Zainal S, et al. Mutational processes molding the genomes of 21 breast cancers. Cell. 2012;149:979–993. doi: 10.1016/j.cell.2012.04.024. [DOI] [PMC free article] [PubMed] [Google Scholar]
- 41.Boeva V, et al. Control-free calling of copy number alterations in deep-sequencing data using GC-content normalization. Bioinformatics. 2011;27:268–9. doi: 10.1093/bioinformatics/btq635. [DOI] [PMC free article] [PubMed] [Google Scholar]
- 42.Raponi M, et al. Gene expression signatures for predicting prognosis of squamous cell and adenocarcinomas of the lung. Cancer Res. 2006;66:7466–7472. doi: 10.1158/0008-5472.CAN-06-1191. [DOI] [PubMed] [Google Scholar]
Associated Data
This section collects any data citations, data availability statements, or supplementary materials included in this article.